Mid-week market update: I recently identified a 2022 market formation where the S&P 500 declines into an FOMC meeting and rallies afterward. The key question for investors is whether the same pattern will repeat itself for the July meeting. If so, the market should top out about now.
Here are the bull and bear cases.
The bear case
Let’s begin with the bear case, which represents the base case scenario. Here are some catalysts that could spark a risk-off episode.
Anxiety over European energy supplies are rising. The NY Times reported that the EU has asked member states to start rationing natural gas in anticipation of a Russian gas cutoff in retaliation for European support of Ukraine. The positions on both sides are becoming dug in. A recent German poll which asked whether respondents would keep supporting Ukraine despite higher energy prices was a resounding “yes”, except for the supporters of the far-right AfD.
Higher energy prices, which have the dual effect of pressuring inflation and pushing the economy into recession, puts the ECB in a difficult position. Tumbling cyclically copper prices in the face of rising European gas prices illustrates the economic impact of the Russia-Ukraine war. Even worse, water levels on the Rhine have fallen to levels that make it difficult to transport coal, which is the emergency alternative fuel, to power plants. As well, the latest drama from Italy indicates that the Draghi government is unlikely to survive, which presents challenges for the ECB as it tries to control peripheral bond spreads as it tightens monetary policy. The ECB’s interest rate decision tomorrow could be a source of market turbulence.
Over on this side of the Atlantic, Q2 earnings season has been weaker than usual. According to the Earnings Scout, both the EPS and sales beat rates are below historical averages. With 12% of companies reported, the EPS beat rate is 75% (vs. the 5-year average of 81%) and the sales beat rate is 69% (vs. the 5-year average of 77%).
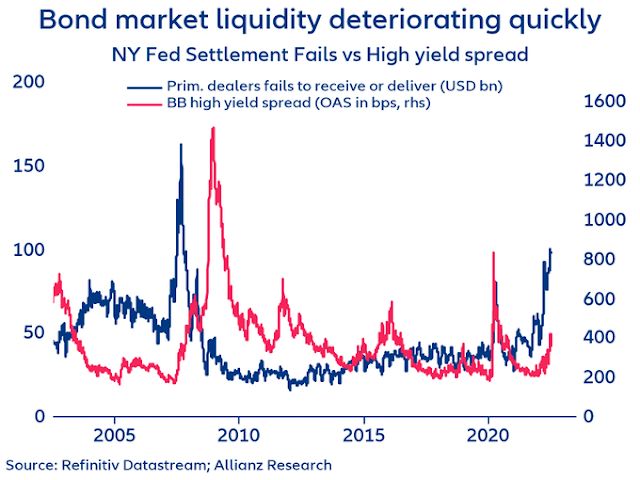
As market participants look ahead to the FOMC meeting next week, monetary tightening is raising the stress in the financial system. Liquidity is worsening, as evidenced by a rate of failed bond trade settlements that was last seen during the GFC. In particular, junk bond risk premium is especially sensitive to liquidity conditions. A bond market blowup would not be conducive to risk appetite.
The bull case
Here is the bull case. USD strength has created havoc in fragile EM economies. Dollar positioning is at a crowded long and could reverse soon.
As well, the latest BoA Global Fund Manager Survey shows that cash levels are at historically low levels, and so are equity allocations.
The FT reported that Ukraine and Russia are nearing a possible deal to transport grain through the Black Sea, which would be a huge positive surprise that alleviates inflation pressure.
Ukraine and Russia are close to agreeing a deal to secure the safe passage of millions of tonnes of grain through the Black Sea but remain at odds over how to ensure the security of the ports and ships along the crucial export route, according to people familiar with the UN-led negotiations.
The four-party agreement, which is also being mediated by Turkey, would end a months-long Russian blockade of Ukraine’s Black Sea ports that has cut off the export route for one of the world’s leading grain producers and threatened a global food crisis.
Bull or bear?
Where does that leave us? Tactically, the SKEW Index, which measures the market pricing of tail-risk is historically low at about 120. The market hasn’t crashed with SKEW at these levels. I interpret this to mean that even if the stock market were to weaken, downside risk should be relatively low.
From a technical perspective, the S&P 500 has staged an upside breakout through a falling trend line and its 50 dma. If the breakout holds, it would be a signal of a possible inflection point and a new bull leg in the market. On the other hand, the VIX Index is nearing the bottom of its Bollinger Band, which is an overbought condition for the market.
The next few days will be a test for both bulls and bears. Should the FOMC pattern of market weakness continue into next week, investors and traders should consider that to be a low-risk entry point for long equity positions.


Some developments:
1. CDS spreads for HY and IG have dropped 85.8bps and 15.1bps respectively in 3 weeks, very large drops historically and very bullish for equities going forward for all timeframes.
2. SMH, IWM, XBI exhibiting strong momentum.
3. ITB, XHB showing contrarian positive momentum in the face all negative headwinds.
A lot of positives developing. Let’s monitor the movements. Potentially significant.
Interesting. Why did Ten year yields fall by a large 15 bps?
You can’t argue with the current relative strength of RCD (discretionary) to RHS (staples) and what the weekly chart shows:
https://i.imgur.com/5fbjJHM.png
But the same RCD made a run from 8/8/08 (that is a good date to remember) to 9/19/08 before cratering. Same goes for 12/05/08 to 1/09/09. Both were false break outs in a long recession and no bears were arguing much with the bulls about who got it wrong.
So give it a few weeks and see if a recession matters.
https://www.marketwatch.com/story/ukraine-russia-sign-u-n-deal-to-export-grain-on-black-sea-01658500911?mod=mw_latestnews