Preface: Explaining our market timing models
We maintain several market timing models, each with differing time horizons. The “Ultimate Market Timing Model” is a long-term market timing model based on the research outlined in our post, Building the ultimate market timing model. This model tends to generate only a handful of signals each decade.
The Trend Asset Allocation Model is an asset allocation model that applies trend following principles based on the inputs of global stock and commodity prices. This model has a shorter time horizon and tends to turn over about 4-6 times a year. The performance and full details of a model portfolio based on the out-of-sample signals of the Trend Model can be found here.

My inner trader uses a trading model, which is a blend of price momentum (is the Trend Model becoming more bullish, or bearish?) and overbought/oversold extremes (don’t buy if the trend is overbought, and vice versa). Subscribers receive real-time alerts of model changes, and a hypothetical trading record of the email alerts is updated weekly here. The hypothetical trading record of the trading model of the real-time alerts that began in March 2016 is shown below.

The latest signals of each model are as follows:
- Ultimate market timing model: Sell equities
- Trend Model signal: Bearish
- Trading model: Neutral
Update schedule: I generally update model readings on my site on weekends and tweet mid-week observations at @humblestudent. Subscribers receive real-time alerts of trading model changes, and a hypothetical trading record of those email alerts is shown here.
Subscribers can access the latest signal in real-time here.
A resilient market
The US stock market has been surprisingly resilient in the face of bad news. The pattern has been the same on Wednesday and Thursday. Futures opened the day deeply negative, first on a hot CPI print Wednesday and a hot PPI print and earnings disappointment Thursday, but rallied over the day to erase most, if not all of the previous losses. The banks, which kicked off Q2 earnings season, have mostly been disappointing, but it only took one positive surprise to spark Friday’s relief rally.

A market that does not react to bad news is a sign of bearish exhaustion. Here are some other catalysts that could spark an unexpected “rip your face off” rally and change the narrative from bearish to bullish.
Supportive factors
Here are some supportive factors that won’t be the cause of rallies, but could put a floor on stock prices.
Gary N. Smith, who is the Fletcher Jones Professor of Economics at Pomona College, wrote in Marketwatch that the stock market enjoys strong valuation support. Using a dividend discount model to value the market, he concluded that there is a 4% chance investors will be overpaying with the S&P 500 at 3902.62.

SentimenTrader has been pounding the table for several weeks about strong insider buying of technology stocks. The 20 dma of insider buying of the NASDAQ 100 is at the highest level since 2011, indicating a bullish risk/reward setup.

The WSJ reported that sentiment is becoming increasingly bearish, which is contrarian bullish.
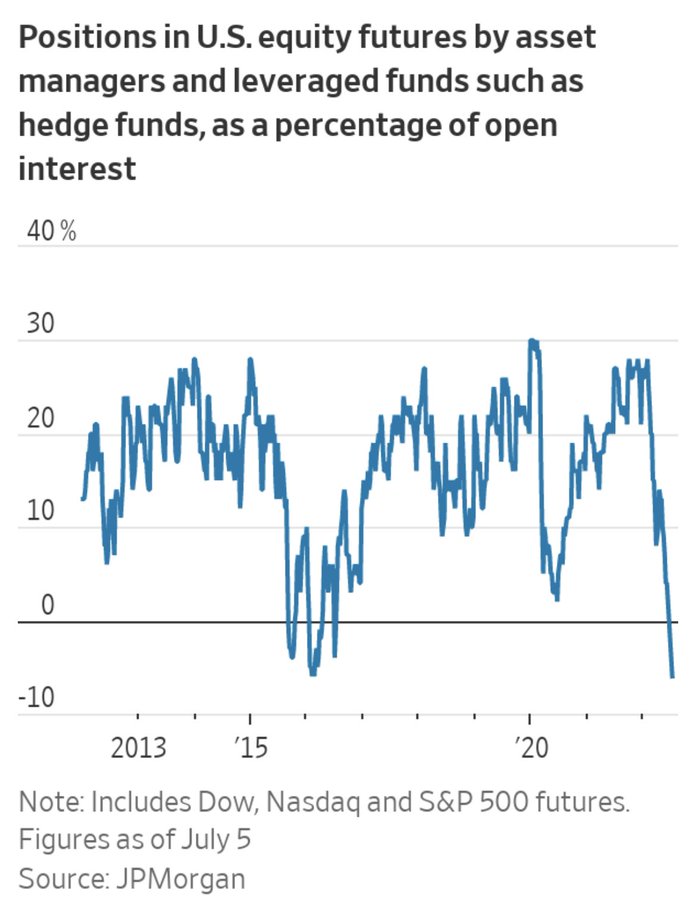
Asset managers and hedge funds recently stepped up bearish bets against U.S. stocks to the highest level since 2016, when fears about a global slowdown were on the rise. That is according to a JPMorgan Chase & Co. analysis of futures tracking major stock indexes.
The average active investor has steadily pared her stock exposure this year and dropped equity allocations to one of the lowest levels since the start of the pandemic, according to a survey by the National Association of Active Investment Managers, which primarily polled registered investment advisers…
Estimates from Deutsche Bank show that investors have steadily decreased their exposure to stocks to some of the lowest levels of the past 12 years. That includes slashed positioning among systematic funds that make buying and selling decisions based on levels of volatility in the markets and other metrics. Meanwhile, bullish bets in the options market among traders big and small recently fell to the lowest level since April 2020.
A cyclical surprise?
While the factors outlined so far will not spark rallies by themselves, here are some catalysts that might.
Earnings season is upon us. Forward 12-month EPS estimates are flattening out as recession fears have grown. The coming weeks will be an acid test for both bulls and bears.

Despite the gloomy outlook, an important cyclically sensitive non-US bellwether reported earnings last week that may be a cause for bullish celebration. TSMC raised its sales outlook while warning that it will delay some capital spending. Positive guidance from a growth cyclical semiconductor company like TSMC is welcome relief amidst all of the macro gloom about a global recession. Semiconductor stocks are trying to turn up in relative strength, which could be a signal for a better cyclical outlook (bottom panel).

Jefferies recently highlighted a historical pattern that semiconductor stocks led the interest cycle by about six months. If these stocks are indeed starting to turn, the rate inflection point should soon follow. Keep an eye on the earnings reports of semiconductors in the coming weeks. A pattern of strong guidance could change the narrative and spark a strong market rally.

Mary Daly, President of the San Francisco Fed, pointed out that this is a very fast tightening cycle. If the semiconductor equity cycle has indeed turned, it’s possible that the lead times will be more compressed than historical experience for that reason.

Falling energy prices?
One macro overhang for the growth outlook is the supply-demand imbalance in a number of key energy and food commodities owing to the Russia-Ukraine war. It is well known that some countries like China and India have been buying Russian energy products, but it is less known that Russian oil has been leaking into the Middle East. As an example, Saudi Arabia has been importing cheap Russian fuel oil to feed power stations and free up the kingdom’s own crude for export. While such developments do little to help Ukraine, it does keep the energy market well supplied and serves to alleviate some of the inflationary pressures that concern global central bankers. As inflation decelerates, central bankers could pivot to a less hawkish monetary policy, which would be bullish for risky assets.

While Europe’s energy shortage is gas and not oil, the latest cover of the Economist may serve as a useful contrarian magazine cover indicator.

As a reminder, this is what happened the last time the magazine published cover indicating panic over energy prices.

Falling food prices?
Finally, the most important possible surprise could come from the grains market. The FT reported that Ukraine, Russia, Turkey, and the UN are negotiating and the parties have made “very substantial progress” on a plan to avert a global food crisis by securing the safe passage of millions of tonnes of grain through the Black Sea. António Guterres, UN Secretary-General, expressed hopes that a final deal could be reached as soon as next week.
This development could be hyper-bullish for two reasons. Food and energy have been pressuring inflation upwards, and a Black Sea deal which allows the safe passage of Russian and Ukrainian grain has the potential to spark strong disinflationary pressures that change the entire inflation expectations narrative. As well, it would alleviate the political pressures on many emerging markets and developed economies and reduce the geopolitical risk premium of risky assets.
Jerome Powell made it clear at the last post-FOMC press conference that the Fed is shifting its focus from core inflation to headline inflation. Relief in food and energy prices will be a welcome development for not only the Fed, but also other central bankers.
Headline inflation is important for expectations. People—the public’s expectations, why would they be distinguishing between core inflation and headline inflation? Core inflation is something we think about because it is a better predictor of future inflation. But headline inflation is what people experience.

In conclusion, the stock market appears to be highly resilient in the face of bad news. A number of factors, such as valuation and insider activity, are putting a floor on stock prices. Three catalysts, such as the unexpected turnaround in the cyclically sensitive semiconductors, a better-supplied oil market, and a possible deal on Black Sea grain exports, have the potential to change the macro narrative from bearish to bullish and spark a “rip your face off” rally. While none of these factors are specifically actionable, investors should be aware of possible asymmetry of risks and behave accordingly.
Excellent perspective this weekend Cam.
My reading of the Jefferies chart 2, is that semis stock price peak about 6 months before EPS cuts, not interest rate cuts. What am I missing in the relation to interest rate cycle? Is it understood EPS cuts lead to interest inflection points?
Looks like BioTech stocks are breaking above their channel.
$WEAT is already down from $12.5 to ~$8.0, not too far from the Feb price of $7.50. Same story with corn.
https://finviz.com/quote.ashx?t=WEAT
It seems the ME is importing roughly 50K bpd more fuel oil from Feb. Is that enough to make a dent in the oil supply to the world markets?
I think if Russia resume natgas supplies after the Nordstream maintenance window ends on July 22nd, and if there is indeed an agreement on grain exports, I think this will be bullish for the risk assets.
Russia may also be close to achieving its goals in Ukraine.
May be this “thaw,” if indeed there is one, suggests parties are willing to sit down and negotiate an end to the war.
Oil – the supply side has limited capacity to increase production. SPR has been cut drastically. Existing oil wells have diminishing output as time goes on. So, unless the world invests in fossil fuel production, it will stay constrained. Even if Russia and Ukraine have a ceasefire, it’s unlikely that sanctions will be lifted anytime soon.
The oil prices are more a function of the expected demand. If any number of macro issues get resolved, the demand will increase. China, for example. If fears of global slowdown are abated, demand expectations will go up.
Food is also a difficult problem. Ukraine is unlikely to get to prewar output levels. India is going through a challenging summer and crops.
I believe that spikes in prices were transient (look at WEAT) chart. Would there be less consumption in case of slowdown? I don’t think so.
Fed has gotten itself in a jam by focusing on more than one inflation metric.
what keeps me up at night is the market cap to gdp, it’s still at 150, in 2009 it dropped to 50. It’s still higher than in 2000. Even a drop to 100 with the GDP being flat means 1/3 off, so 2600. A drop to 50 because of overshooting means around 1300. Of course if GDP tanks, well even more pain, but I think the global debasement of fiat currency is not done. Look at the poster child Japan, so if the currency is being destroyed this lifts the market.
Shorter term, it sure feels like a bear, but I think the Fed pivot is too obvious….so watch for the expected pivot, whenever it comes, a bull trap rally and then a crushing collapse….not saying it will happen of course. Usually when the Fed pivots and lowers rates the market just keeps going down, maybe this time we get something trickier
I wonder if Buffett’s market cap-to-GDP metric needs a revision for the internet age. There are some companies – Google, Microsoft, Amazon (AWS) and probably a few others that enjoy mighty economies of scale and captive customers because of platforms they have built. These monopolies extract extraordinary rents and earn tremendous returns on their capital. Their incremental returns are even ginormous.
I don’t think there have been any companies or industries that have earned so much on so little.
market cap to gdp includes everything, so while some may do very well, it is in a sense at the expense of others. How can u expect the economy to grow faster than it grows? Well I guess if you debase money this could happen, but there will be bumps along the way.
As far as what happened in the past, we did not have the debt.
Market cap to GDP is a proxy for price to sales. The problem with that metric is:
P/E = Price / (Sales * net margin)
Net margins have been improving independent of operting margins because:
1) Lower effective tax rates
2) Lower interest rates (still)
See https://twitter.com/shehzadhqazi/status/1549125348541046787
But profit margins should revert to the mean, not saying tomorrow, not saying it will even happen, but reversion to the mean makes sense because of marketplace competition. In the short run it doesn’t matter, but if we get a hard recession, chances are things will grind lower in profit margins and also market cap to GDP, and I’m not comfy with that thought, but if one is going to invest one has to accept certain undesirable possibilities
I think operating as well as net margins may stay elevated for the mega-cap, internet companies as their competitive moats are very strong, and may stay strong, if not get stronger, over time.
There is no one who can compete with Microsoft’s Windows and related ecosystem, no one else is building a cloud platform to compete with Azure or AWS, and no one can build a search platform to compete with Google’s.
There is no mean reversion here because of competition or business cycles.
Now if we go into depression, it is a different story.
… a policy pivot by the CBs is far away… It would be a mistake to think otherwise. There are US examples, not just the 1970s but if one studies 1917 to 1921 (last pandemic of similar size), inflation was persistent and unrelenting and CBs are not going to accept that outcome.
https://blogs.tslombard.com/the-nightmare-scenario-for-central-banks
” Higher and broader inflation is not necessarily “persistent”. But it does not matter what we believe – it is clear that the BIS message resonates with central banks. They believe monetary policy is what “anchors” the low-inflation regime and if the authorities lose control, the “costs of transitioning away from the high-inflation regime would be extreme”.
Rather ominously for financial markets, the BIS concludes: “Central banks fully understand that the long-term benefits [of safeguarding price stability] far outweigh any short-term costs – credibility is too precious an asset to be put at risk.” This suggests that a policy pivot is far away…”
We are in interesting times. I want to be positive. I want to nibble more. I’m just not feeling it. My bigger tech clients are all starting to slow purchases, same time the largest ones are all saying they are slowing hiring. Usually these guys are the canaries in the coal mine, and the next step is a freeze on spending. Maybe this is a bad news (spending slows) is good news (Fed slows tightening) time. Maybe we are in for a real pickle with stagflation. I just think it still pays to be conservative. Thank you all who comment here, it’s good to understand what other informed investors are thinking.
I am definitely nibbling here. Have made 4 trades for the investment accounts. I am buying things like AMZN, GOOGL, KKR. Buy partial positions which can be added to as the market goes up and down. But that’s just me, to each their own. Just to give you another perspective.
Kudos to anyone able to day trade this market. I can’t do it. Just letting my positions ride the bucking bronco 😉
One of the lowest volume day so far since January 03, 2022 right before the bear market started in earnest. Three gap up days in a row with a sharp sell off in between does not do the bullish thesis any service as it is usually a sign of desperation.
A lot of misleading and confusing comments on Twitter about volume and low volume rallies, even from veterans such as Bespoke. The simple truth is all they have to do is define volume because it is something that can signify both buying and selling depending on the time frame. All one has to do is stand back and look at the $INDU daily chart for example with a slow 90 day moving average on its volume. One will see clearly trends in volume and one can plot trend lines (TL) on the volume and TL breaks. One could see it right now, an uptrend line since 02/22 in the 90 DMA of volume breaking down here. In the bear market of 2008, 2009 those TL breaks always lead to sell offs, the last one from a bear market rally that topped in 11/08 and sold off for 82 trading days and a drop of 32% to the Mar 2009 bottom.
Nothing is for certain of course as the 90 DMA is a slow moving average and market could turn and lots of volume could come back, but given the primary trend, it is unlikely.
SPX at a one-month high.
It is official then, Jason Goepfert declared bear market over with his $UVOL data >87% 2 of 3 days within 30 days of 52 week low. This seems like pretty old recycled material:
https://twitter.com/jasongoepfert/status/1549483829357727745
The only problem(s) is that for example he would have bought around 11/28/08 which was 100 days (67 trading days) from the 3/6/09 bottom with a drawdown of 24.7%.
Another thing with volume, if Goepfert had bought on 11/28/08, at least he’d have had a good company of volume at 7.24 million. If Goepfert bought today, the volume would be 2.34 million. If you study volume around market bottoms, you would find that volume doesn’t matter to rallies outside of recessions, but falling volume kills rallies within recessions.
There is always skepticism at major turning points. I would be concerned if there wasn’t. Not necessarily saying that June/July 2022 will in retrospect be seen as one (how would I know), but the high degree of skepticism bolsters the case for one.