Preface: Explaining our market timing models
We maintain several market timing models, each with differing time horizons. The “Ultimate Market Timing Model” is a long-term market timing model based on the research outlined in our post, Building the ultimate market timing model. This model tends to generate only a handful of signals each decade.
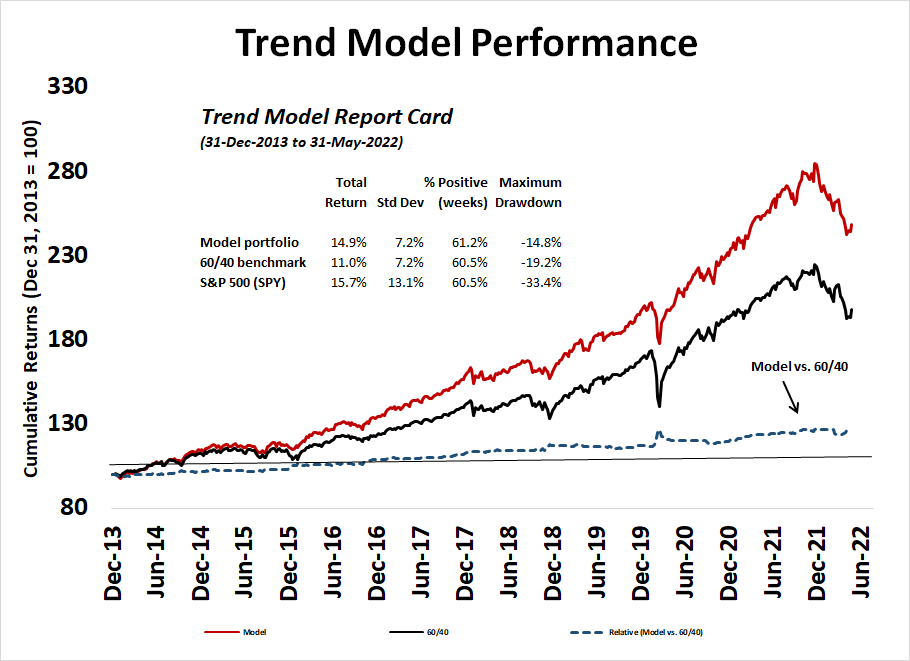
The Trend Asset Allocation Model is an asset allocation model that applies trend following principles based on the inputs of global stock and commodity prices. This model has a shorter time horizon and tends to turn over about 4-6 times a year. The performance and full details of a model portfolio based on the out-of-sample signals of the Trend Model can be found here.
My inner trader uses a trading model, which is a blend of price momentum (is the Trend Model becoming more bullish, or bearish?) and overbought/oversold extremes (don’t buy if the trend is overbought, and vice versa). Subscribers receive real-time alerts of model changes, and a hypothetical trading record of the email alerts is updated weekly here. The hypothetical trading record of the trading model of the real-time alerts that began in March 2016 is shown below.

The latest signals of each model are as follows:
- Ultimate market timing model: Sell equities
- Trend Model signal: Bearish
- Trading model: Neutral
Update schedule: I generally update model readings on my site on weekends and tweet mid-week observations at @humblestudent. Subscribers receive real-time alerts of trading model changes, and a hypothetical trading record of those email alerts is shown here.
Subscribers can access the latest signal in real-time here.
Nagging doubts
Despite my constructive views on the direction of the stock market, some nagging doubts remain. Even as top-down strategist reduce their S&P 500 EPS estimates, bottom-up estimates, as measured by forward 12-month EPS, have been rising steadily for both large and small caps.

As we approach Q2 earnings season, the risk of a flood of negative guidance that pushes down consensus estimates is high, which would spark a risk-off episode.
Still a crowded short
Sentiment models are supportive of higher prices. I recognize that there are problems with the AAII weekly sentiment survey, such as low sample size and differing survey respondents that vary from week to week. Nevertheless, the latest AAII weekly survey shows that the bull-bear spread has only been exceeded twice in its history, the 1990 bear market and the GFC Crash. The percentage of bears also shows a similar result. These levels are astonishing when you consider the Crash of 1987 is part of the historical period.

The NAAIM Exposure Index, which measures the sentiment of RIAs who manage individual investor funds, is also highly negative. This index has flashed an almost sure-fire buy signal whenever it fell below its 26-week Bollinger Band. While the latest readings weren’t below the 26-week BB, they did equal the level five weeks ago when this index produced a buy signal.

The correlation of stocks within the S&P 500 has spiked. This is another contrarian bullish signal which indicates herding and excessive fear.

Technically bullish
From an intermediate-term basis, the weekly S&P 500 exhibited a positive RSI divergence when it fell to fresh lows two weeks ago on high volume, which should lead to higher prices.
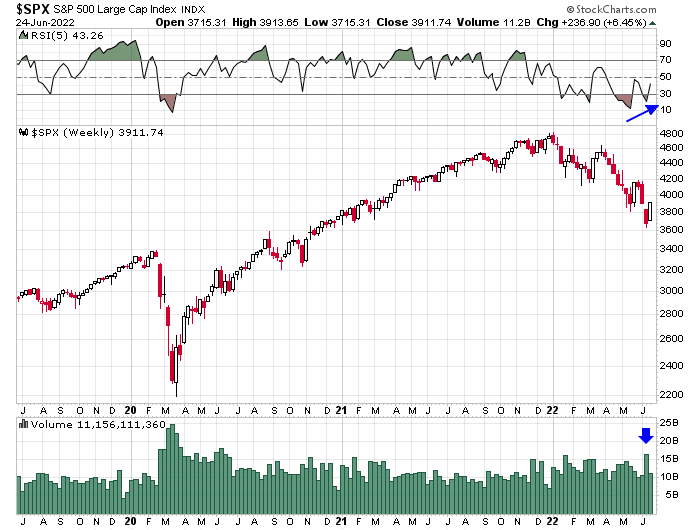
Market breadth is also constructive. NYSE 52-week highs-lows failed to make a new low when the S&P 500 made a low for the year, while NASDAQ 52-week highs-lows exhibited a positive divergence.

The S&P 500 Intermediate Term Breadth Oscillator saw its 14-day RSI recycle from an oversold condition. This has been a fairly reliable tactical buy signal in the past.

Price leads fundamentals
Jurrien Timmer of Fidelity offered a highly insightful chart that put the risk of negative EPS revisions into context. The chart compares the percentage of S&P 500 stocks above their 200 dma (blue line, bottom panel) to EPS revisions (gold line, bottom panel). The history of major market downdrafts shows that declines in market breadth almost always led changes in fundamentals. The only exception occurred in 2015 (red box), when the decline in earnings was attributable to falling oil prices. (Annotations are mine).

In conclusion, the intermediate-term bull case remains intact. Both sentiment and technical conditions are still supportive of high stock prices. While investors may face the risk of earnings downgrades as we approach Q2 earnings season, much of the fundamental weakness may already have been discounted.
Jurrien Timmer’s graph is interesting. Would the correct interpretation be a 26% decline in earnings estimates, by comparison to previous peak?
Cam, why is your trend model still bearish??
One of the characteristics of trend models is they spot trends and hop on them. By their very nature they are slow and they are not designed to find exact tops or bottom.
It’s a feature, not a bug.
https://www.marketwatch.com/story/oaktrees-howard-marks-is-finding-bargains-i-am-starting-to-behave-aggressively-he-says-11656414153?mod=home-page
Howard Marks:
‘Marks is best known for his lengthy investment letters, and warnings. In early May he cautioned over bull-market excess, which seems as prescient as his similar year-earlier warning.
‘“Today I am starting to behave aggressively,” he told the Financial Times in an interview. “Everything we deal in is significantly cheaper than it was six or 12 months ago.”
‘The manager said now seems like a “reasonable time to start buying,” noting lower prices for such assets as high-yield bonds, mortgage-backed securities and leveraged loans. Oaktree specializes in alternative investment strategies.’
Max pain. A selloff today feels about right. We need fewer bulls on board in order to rally further.