The recent price surge in late May off the bottom produced a flurry of excitement among technical analysts. Extreme price momentum is known as a breadth thrust in chartist circles. Depending on the magnitude of the breadth thrust, they are often signals of new bull markets.
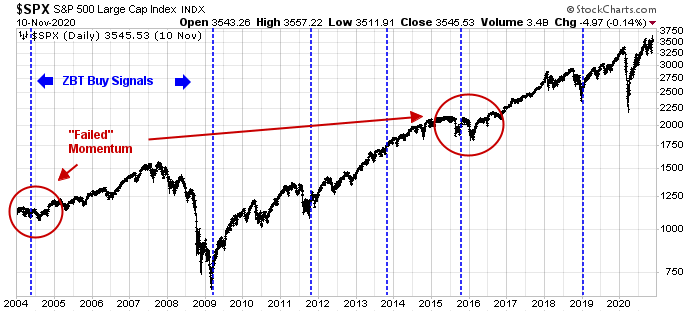
Marty Zweig detailed what became known as the Zweig Breadth Thrust buy signal in his book, Winning on Wall Street, which was first published in 1986. A ZBT buy signal is generated when NYSE breadth moves from an oversold extreme to an overbought extreme within 10 trading days. ZBT signals are very rare. The book described 14 signals since 1945. The average gain following these 14 Thrusts was 24.6% within 11 months.
The market surge in late May just missed generating a ZBT. The market achieved the breadth thrust in 11 days, not 10. Since then, a number of chartists have analyzed these “just missed” signals and concluded that they are nearly just as good as the classic ZBT buy signal. As an example,
Recession Alert observed:
All but 2 of the 13 signals in the above chart provided positive gains averaging 8.4% some 6 month out, which is equivalent to a 84.6% accuracy. If you relaxed the positive outcome holding period from 6 months to 12 months, then only the 2001 signal provided a negative outcome, increasing the accuracy to 92%. In fact, an examination of an actuarial table of the SP-500 gains for various holding periods after each ZBT-A signal yields some more interesting results.
Does that mean it’s time to sound the all-clear and buy stocks?
Meet the Fed
Not so fast. An out-of-sample analysis of the classic ZBT shows that these signals are indeed very rare. There have been only six signals since the publication of Zweig’s book in 1986. In all cases, the S&P 500 was higher a year later, but there were two cases of failed momentum – when the market chopped sideways and retested the old lows before rising.
While the sample size is extremely small (n=2), the cases of momentum failures coincided with the Fed tightening policy. The successful ZBT signals occurred during periods when the Fed Funds rates was either stable, falling, or the Fed was about to embark on an easing cycle.
Breadth thrust bulls, meet the Fed.
Clear and convincing
Global central banks are undergoing a tightening cycle. The market expectations of the Fed Funds rate indicate a virtual certainty of half-point rate hikes at the next two FOMC meetings, with a split decision between a quarter-point or half-point hike at the September meeting.
What’s the criteria for the Fed to pause its breakneck pace of half-point rate hikes? At the
WSJ Future of Everything Festival, Fed Chair Jerome Powell stated, “What we need to see is inflation coming down in a clear and convincing way, and we’re going to keep pushing until we see that.” He went on to use the “clear and convincing” language three times in the interview.
What does “clear and convincing” mean? Powell was originally trained as a lawyer, and “clear and convincing” is a legal standard of proof that it requires that the evidence be substantially more probable to be true, It rests between the “preponderance of evidence” standard, which requires only “more likely than not” and the strict “beyond a reasonable doubt” standard.
Core PCE, which is the Fed’s preferred inflation metric, has been moderating. We have seen three consecutive months of core PCE prints at the 0.3% level, which is consistent with the Fed’s year-end projection of 4.1%/ Average hourly earnings have also moderated. Does that constitute “clear and convincing” evidence? Here is how Powell responded:
We all read—of course, everyone reads—the inflation reports very carefully and looks for details that look positive and that kind of thing. But truthfully, this is not a time for tremendously nuanced readings of inflation. We need to see inflation coming down in a convincing way. That’s what we need to see. And until we see that, we’re going to keep going. We’re not going to assume that we’ve made it until we see that. And we’re not seeing that right now.
In other words, don’t expect a dovish pause in the near future. Fed governor Christopher Waller echoed Powell’s view with an even more hawkish tone in a recent speech delivered at the Institute for Monetary and Financial Stability in Frankfurt:
I support tightening policy by another 50 basis points for several meetings. In particular, I am not taking 50 basis-point hikes off the table until I see inflation coming down closer to our 2 percent target. And, by the end of this year, I support having the policy rate at a level above neutral so that it is reducing demand for products and labor, bringing it more in line with supply and thus helping rein in inflation.
A lot of data will be coming in between now and the September FOMC meeting. While a dovish pivot is possible, don’t expect a pause in rate hikes at the September meeting. At best, the Fed will moderate its pace to a quarter-point increase.
A counterproductive rally
While many technical analysts have viewed the recent breadth thrust in a bullish light, the recent risk-on tone is acting to encourage the Fed to be even more hawkish. That’s because monetary policy works through tightening financial conditions. While the Chicago Fed’s National Financial Conditions Index has tightened, it is not extreme by historical standards.
The recent risk-on tone of the markets, of which the near ZBT is a symptom, acted to ease financial conditions. As an example, the iShares Interest Rate Hedged High Yield ETF (HYGH), which measures the relative performance of junk bonds compared to Treasuries, rallied so hard in late May that it left two price gaps. The strength in HYGH and the S&P 500 effectively unwound some of the Fed’s tightening policy. All else being equal, the market reaction will encourage an even more aggressive monetary policy.
In all likelihood, global central banks will keep raising rates until something breaks. Nouriel Roubini is calling for a hard landing in a
Project Syndicate essay:
Because stagflationary shocks both reduce growth and increase inflation, they confront central banks with a dilemma. If their highest priority is to fight inflation and prevent a dangerous de-anchoring of inflation expectations (a wage-price spiral), they must phase out their unconventional expansionary policies and raise policy rates at a pace that would likely cause a hard landing. But if their top priority is to sustain growth and employment, they would need to normalize policy more slowly and risk unhinging inflation expectations, setting the stage for persistent above-target inflation.
A soft-landing scenario therefore looks like wishful thinking. By now, the increase in inflation is persistent enough that only a serious policy tightening can bring it back within the target range. Taking previous high-inflation episodes as the baseline, I put the probability of a hard landing within two years at more than 60%.
Well-known emerging markets investor Jay Newman wrote in an
FT Op-Ed that global central bank tightening will spark a series of EM crises:
We are on the brink of an epidemic of emerging market defaults, the scale and scope of which will rival the debt crisis of the 1980s. Rate increases by Western central banks, fallout from the COVID pandemic, surging food and fuel prices resulting from the economic fallout of the war between Russia and Ukraine, mismanagement, and outright corruption all are contributing factors.
Cracks are already appearing. Sri Lanka’s economy is teetering and Pakistan’s foreign exchange reserves have fallen below $10 billion, which has prompted the government to seek help from the IMF.
Investment implications
In conclusion, traders should fade the recent episode of positive equity price momentum. While breadth thrust signals are bullish over a one-year time horizon, past signals have fizzled and the market has retested the old lows when the Fed is undergoing a hiking cycle.
Long-term investors can begin to accumulate positions at current levels with the awareness that they may see some lower prices over the next few months. The recent cluster of insider buying at the May lows is a constructive sign that downside risk may be limited (see
A bull’s view of the rebound). Focus on high-quality stocks in equity portfolios during the current period of economic uncertainty.
The quality factor can be measured in a number of ways. S&P has a stricter profitability index inclusion criteria than FTSE/Russell, and S&P’s large and small-cap indices have beaten their Russell counterparts. As well, Pacer has a series of cash cow ETFs consisting of companies with strong cash-generative qualities (COWZ and GCOW). Both have outperformed their benchmarks in 2022.


While it might be premature to get overly bullish I am finally seeing some stability in the market. Some of the stocks I watch for “tells” are not going down on bad news. MSFT and NVDA both had bad earnings or guidance and opened down sharply and then closed up for the day. We now might be seeing backing and filling in the market i.e. a trading range.
From a trading perspective breakouts in a bear market seldom work. The strategy that makes sense is to buy the sharp breaks and sell when the market reaches a trend line or resistance.
Thanks for the Fed angle on the ZBT.
Also thanks for GCOW and COWZ. They are now on my ranking list. 50% of US stocks have no earnings. This stocks are getting crushed. The cash cows will be in big demand as portfolio managers wake up.
When Volcker raised rates the federal debt was much lower. The debt has been rising and rates are falling since then. I just don’t see how rates can really go up and stay up? The credit markets can bear what kind of rates? Remember that in the 30s the US was the world’s creditor, not debtor, and money was backed by gold…so in 1933 they boosted the amount of $ by changing the gold price…after taking the gold away from citizens (not everyone listened of course), but now is very different. The USA is the greatest debtor, runs a huge trade deficit. What will happen with higher rates?
So they can focus on inflation, but when the credit crunch really happens, what will they do?
Believe it or not, in Weimar Germany while the mark tanked, the German stock market zoomed, even when in US dollars, so this was where the money went.
Will the Fed let all those zombie companies fail? We will get a big scare, how low will the markets go? Then there will be a Fed response….it’s not our money, it’s not backed with our gold or anything. Maybe this is why the response of $$HYIOAS and SPY:JNK is the way it is this time around.
We are in for crazy times.
But things like COWZ makes me think of how the Bank of England way back when was prepared to lend to solvent borrowers. Money may be shifting to solvent companies. ARKK:COWZ peaked at 4.40 in feb 2021 and is now at .86! Yes, COWZ and GCOW have held up well this year, on massively increased volumes. What is interesting is that they did not hold up as well in the dec 2018 and mar 2020 crashes. So what is different this time other than the volumes? Volumes of COWZ were seldom more than 500k a week prior to 2022 and now are over 5 million a week, so we are talking 10 fold sustained increases. So is it a rush to safety or an anticipation of Japanese types of yields coming down the road?
I heard that in Japan they are asking people to watch only one TV to conserve electric power. No inflation huh? How come such a basic commodity has to be used so frugally?
Do you think that after having tossed helicopter money in 2020 that they will never do it again? It will become normal procedure at some point, just like budget deficits after the Eisenhower administration have become normal. How long this will take and what kind of dumpster the USD will end up in is anyone’s guess. Put your money into stuff that people really need.
a large component of COWZ is energy companies, maybe this is why the large volumes. The volumes for energy stocks eg XOM is over 100 million a day, and ofc the price of XOM and EOG etc is up strongly.