I know that Friday’s CPI print was ugly, but it seems to have sparked a “correlations converging to 1” liquidation panic where everything is getting sold today. The good news is such panics usually don’t last long.
Several readers highlighted analysis from Rob Hanna of Quantifiable Edges of a rare Inverse Zweig Breadth Thrust. Although the sample size is small (n=10 since 1926), the bearish implications of the study are clear.


Take a deep breath. Notwithstanding the fact that negative ZBTs were not part of Marty Zweig’s work as detailed in Winning on Wall Street, this study is nearing “torturing the data until it talks” territory. While positive ZBTs are rare buy signals, there have been six instances since the publication of Zweig’s book in 1986. Can you really trust the results of a study when the last instance of a negative ZBT was in 1943?
Panic in the air
Two weekend (unscientific) Twitter polls are testament to the sense of panic. Callum Thomas has been conducting a weekly poll since 2016, and readings are at an all-time low. The weekly reading of equity bearishness has exceeded the levels seen during the COVID Crash, though the four-week average is not.

Helene Meisler conducts a similar weekend poll and the results are net bearish by -20%. In the limited time she has conducted this poll, there were only a few instances when readings reach these levels:
3/11/22
7/16/21
1/15/21
6/26/20
5/15/20

While the sample size is small (n=5), four of the five samples saw the S&P 500 immediately rebound the following week. In the single exception where the market showed a red candle, investors saw a Turnaround Tuesday rally that led to higher prices for the remainder of the week.
Purely as an anecdotal observation, the respondents in Meisler’s poll seem to have a shorter time horizon than in Thomas’ poll.
Some silver linings
I don’t want to imply that this is “the bottom”, as the US equity market still faces some valuation challenges (see In search of the bullish catalyst). but some silver linings are starting to appear in a series of dark clouds.
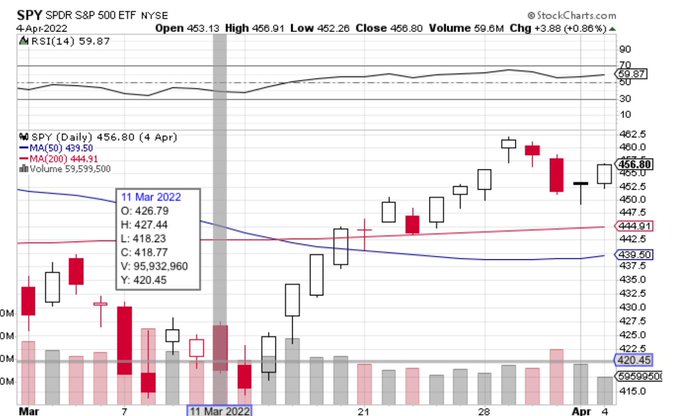
Let’s begin with the long-term technical perspective. I have highlighted the point that the % above the 200 dma reached over 90% as the market recovered from the COVID Crash in 2020, which created a “good overbought” advance (top panel). The “good overbought” condition petered out in Q2 2021. In the past, the market has bottomed this indicator reached 15%. It’s now about 20%. It’s getting close. Such pullbacks have also ended when the % above their 50 dma (bottom panel) fell below 20% and this indicator has fallen as far as a sub-5% reading in the past. It’s now there.
In short, technical conditions are consistent with long-term bottoms, though the market still lacks valuation support.

In the short run, the crypto space tanked on the weekend when Celsius halted redemptions and transfers. Not only did the episode spark fears that this was another instance of fraud or Ponzi scheme implosion, but it also had real liquidity implications. Some crypto investors who had their holdings at Celsius faced with margin calls had the choice of either liquidating their positions or adding USDs into an institution that was not allowing withdrawals. The silver lining is the performance of cryptocurrencies has been highly correlated with the relative performance of speculative growth stocks, as proxied by ARKK. But is that a positive divergence I see?

Waiting for the Fed
One development that investors are watching is the FOMC announcement on Wednesday, and the event may provide some relief for risky assets. In the wake of the hot CPI print, the market is now discounting a 30% chance of a 75 bps hike on Wednesday. As well, it’s discounting a series of rate hikes with the terminal rate at 3.75% to 4.00% in early 2023.

I believe those expectations are far too hawkish. On the question of what the Fed will do this month, just remember the Fed is a bureaucracy and an institution. It’s not some trader sitting in front of several screens trading the market and it doesn’t pivot policy based on a single data point. A 50 bps increase is far more likely, though 75 bps hikes are plausible this year.
On the other hand, the terminal rate of nearly 4% may be overly aggressive with the level of the 2-year Treasury yield at 3.3%. In the past, the 2-year yield has served for another estimate for the terminal Fed Funds rate. In effect, the market is discounting a 3.75% to 4.00% Fed Funds rate next year and a 3.3% in 2024, indicating Fed easing and therefore a recession.
Thank you, Cam, for a very timely post.
One of the things that worries me about a lot of these indicators like % above 50 day moving average is that they have only been around during the era of the Fed Put and falling interest rates. Or maybe it’s just what I can find, but the data goes back to 2002, so we have no idea what it would have been like in the 70s for example.
But one thing about indicators, something can be way overbought or oversold and stay that way longer than usual.
I may buy a small position in a leveraged ETF, but I don’t use leverage/margin to take a position, that is a recipe for disaster.
Pension and endowment funds can’t be happy.
I do hope that we stop the plunge, it’s nerve wracking.
Pension and endowment funds think in quarters, not days. This drawdown is a blip.
True, the pension and endowments comment was intended for a longer time frame…consider the Nikkei and what it has done since 1989, or what the nasdaq did after 2000….so if we get a drop in the markets that stays low for a decade or more, they won’t be happy. I think that they prefer if the S&P does not stay sub 1500 for the next 10 years, in other words back to the 2000 to 2010 range, which if you look at a chart from 1980 is a decent pullback even if it sounds insane, but the $SPX was 100 in 1980, so 1500 is still a good gain compared to 1980! Just on nominal prices at 6%, it takes about 12 years to double which would mean 1600 after 48 years (not including dividends). Of course the value of the $ has declined, but that was true before 1980. It just shows how grossly overvalued the market is. If profit margins shrink and P/Es get lower, there is a lot of downside.
I remember how the Dow/Gold ratio can hit around 1…does that mean gold at 10,000 or the Dow at 3000 with gold at 3000….nobody knows.
There is a nice channel on the daily ES mini chart through the lows from dec 1 2021 to present. We just hit it. There also is a case for a falling wedge which if we break out of that says we go a lot higher, one can see a potential head and shoulders in that wedge, but it is downsloping, so who knows we could go up, or we just keep crashing down.
I remember hearing about a “Plunge Protection Team” was that disbanded? I feel that the present administration does not care about the market, retirement plans, and main street. It is the owner’s of stocks who are getting hurt and that is a great way to reduce liquidity. This all seems to fit in with the “Great Reset” and “build back better”; let the economy crash.
I don’t think there was is any thought by the current administration to drive the market down, that is all partisan rhetoric. Why would any politician or political party want stock market problems before an election?
At this point the Fed is playing catch up and that will hurt the market. But letting inflation run would be worse.
Or, a H&S top with 2 heads, first shoulder sept 1 2021, 2nd shoulder early June and we are breaking the neckline now…target would be 3000 or so on the S&P.
That one is more credible. In which case if we break the neckline, get a pullback to it, I will either buy some SPY puts, or just get some SPXS…small positions
The neckline of the H&S pattern – what is the level on the charts?
It is seriously downsloping, so it is less reliable.But it is a line connecting the low oct 5 at approx 4250 to the low on may 19 at approx 3800…so nowhere near horizontal.
Of course the Elliott wave guys would call it wave 3 when it breaks the trend line, with wave 1 the move from the ATH down to 4100 on feb 24, a flat correction for wave 2 ending at 4625 on mar 28 and then wave 3 down is in progress.
But you know, consider how the USA can grow it’s own food, and natural gas is really so much cheaper than in Europe or Japan, as is electricity. There is I think a huge advantage, and maybe this is why in spite of sentiment the market is not lower. We could go higher believe it or not. But I am really nervous lol
Thanks!!
I am generally optimistic but am very nervous post last inflation report. I now think there is more downside.
Correction: 2 year yield is 3.3%, not 2.3%. That has been corrected in the text.
About 4 weeks ago on May 20, 2022, there was this chart posted showing what an analogous correction as the ‘Kennedy Slide’ of 1962 would look like in the current market. At the time, it seemed fanciful, but now it looks more probable than possible. Bottom SPX near 3385 around July 22, 2022?
https://ibi.sandisk.com/action/share/70379900-b3ab-4b20-a507-ad721f681921
S&P 500 worst performance through 112 Trading days – see number 3 and number 4. This 2022 bear market could go down in history as the ‘Biden Slide’, right in front of number 4 the Kennedy slide of 1962. Also notice the top 5 known example on that list ended +7.6% to +43.6% from day 113 to year end. Notice also number 13 which is the year 2008 that started -9% and kept sliding another -33% the rest of the year.
https://twitter.com/charliebilello/status/1536441962928250880
Fear is good. As of today I am up to 70% invested in the markets (heavily skewed toward equities this time) and not too concerned about my positioning.
Bonds sold off almost as hard as the indexes. Gold miners sold off harder.
The 60/40 and the 40/60 portfolios are likely having their worst starts to the year in my lifetime.
I’ve probably recounted this story before. In the Eighties I asked my dentist for a referral to an oral surgeon. I had a name in mind – Dalbert Fear, who’s probably retired by now. I came home to a what must have been a cryptic message on the answering machine – ‘Fear is good.’
Dear Cam, do you still think that FED will raise the rates only by 50 pts?
https://twitter.com/SethCL/status/1536639223087915009
Thank you for reaction.
What we don’t need is another ‘V’ rally, which would simply set up another sell-the-rally reaction. I would prefer to see an extended period of consolidation/basing.
Do you think we are in some consolidation – shorterm or medium term?
That’s my take. Capitulation can take many forms. For all intents and purposes, the current bull market ended in early 2021 with the blow-off moves in speculative stocks and SPACs. So it’s been a bear market for over a year. Many of the stocks I recall day trading (NET/ PLTR/ NIO) are well off their 52-wk highs. It’s different this time in the sense that bonds have declined as well – so even 60/40 investors are experiencing the psychological impact of a serious drawdown. Can we sell off further? Sure. But I think we’re in the process of bottoming.
https://www.marketwatch.com/story/those-who-buy-stocks-the-day-after-the-s-p-500-enters-a-bear-market-have-made-an-average-of-22-7-in-12-months-11655224023?mod=mark-hulbert
Cam-
As you recently suggested, investors should be looking outside the US for opportunities. What is your sense of the reports on improvements in the Chinese tech sector, i.e., lifting of some Covid restrictions, the Didi investigation, etc.
Cam- Congratulations on the publication of this post in today’s Marketwatch Opinion page.
https://www.marketwatch.com/story/liquidation-panic-has-taken-over-the-stock-bond-and-crypto-markets-and-this-may-be-the-beginning-of-the-end-11655151026?mod=home-page
Cam or anyone else,
How do you measure liquidity? Is there a source for this information?
Thanks!
There is no clearly defined liquidity numbers. The inputs to the measurement can be very large or some number to your own choose. But I believe most firms have at least these inputs in common:
bid-ask spread, turnover ratio, trading volume, and firms’ own liquidity ratio. And then you can add your own other indicators. You will form your own weightings of these inputs depending on what area of biz you are in. And you track the time series and note the trend changes. In essence you are looking for anything that might contribute to measurement numbers out of normal range and try to figure out why.
So liquidity numbers are symptoms, like biomarkers, and tell you something is not right (not as liquid as normal markets). And you examine the inputs and try to locate the dislocations.
For example the three trading days before today have a definite liquidity problem. That comes from bond markets and crypto space. We all know bond market is not as liquid as before Sab-Ox act was passed. The dealer roll is a lot shorter so that during stress period the bid-ask would increase substantially and not enough dealers to absorb the volume, resulting in big price movement. In this example, big down movements. Remember you don’t have enough capacitors in your power supply network back in college? Same situation in cryptos, redemptions and withdrawals are halted, so self-explanatory.
If you review the charts, say spx, there are two gap downs greater than 1% on Fri and Mon respectively. It had never happened before. So liquidity measurement numbers very much out of whack. Symptoms are very serious.
Hope everyone here keep calm and soldier on. Many variables and no clear picture.
I think liquidity is an illusion…it’s there until it isn’t, that’s why there are those terrible drops like the Lehman moment. Wasn’t there great liquidity with NFLX?
So IMHO liquidity is good in good times, so if you want to unload 100k shares of AAPL in normal times, no problem, but at some points in the GFC you could sell at market lol.
Awesome responses! Thank you both.
The lack of coordination between central banks is worrisome, the ECB holding an emergency meeting today already to discuss peripheral bond yield spreads is either wildly bullish or tells us we are in deep deep trouble.