Mid-week market update: Can the stock market follow the script for past FOMC meetings in 2022? In each of the cases this year, the market weakened ahead of the meeting and rallied afterwards. The only deviation from the script occurred at the May FOMC meeting, when stock prices fell to new lows after a post-meeting reflex rally.

Fast forward to the June meeting. The S&P 500 skidded in accordance to the script and stocks rallied today, though there are two unfilled gaps above.
The setup
Here is how market conditions were setting up coming into the FOMC announcement.
The consensus last week was the Fed would raise rates by 50 bps in June and July, and wait for more data before making a decision at the September meeting. In the wake of a hot CPI report, expectations shifted to a virtual certainty of a 75 bps rate hike in June, followed by another 75 bps in July and consecutive 50 bps hikes for the next three meetings. The expected terminal rate is 4.00% to 4.25%, which would be reached in February.

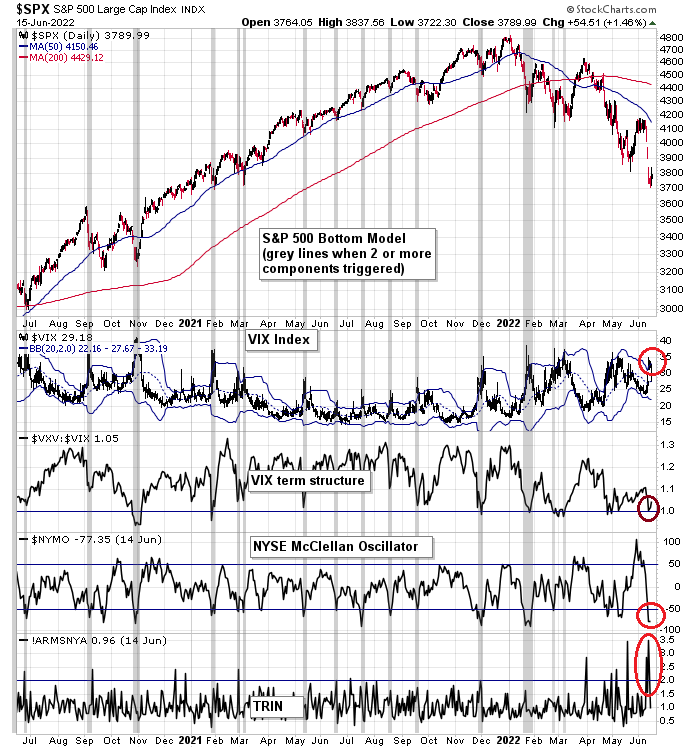
Over at the stock market, three of the four components of my Bottom Spotting Model flashed buy signals on Monday. The only exception was the shape of the VIX curve, which came within a hair of inversion. Most notably, TRIN spike to an off-the-charts reading, indicating price-insensitive selling that’s indicative of a margin clerk driven liquidation event (see A liquidation panic).
The evolution of inflation
Lost in all of the inflation hysteria was a tamer than expected PPI report. In the wake of the better than expected PPI print, WSJ reporter Nick Timiraos observed that JPMorgan estimates that core PCE will decelerate to 4.7% in May.

This puts core PCE, which is the Fed’s preferred inflation metric, on a decelerating path.

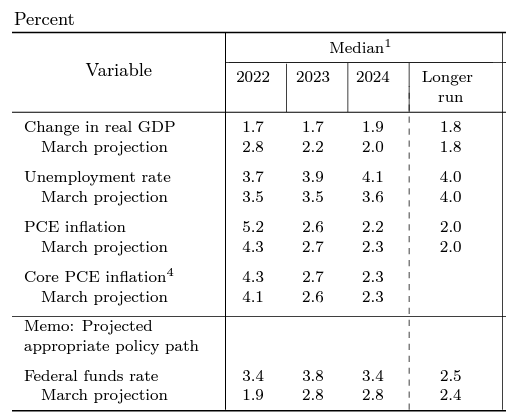
Here is the all-important revised Summary of Economic Projections, which is more dovish than market expectations. Key highlights:
- All growth projections were revised down and inflation projections were revised up.
- The median projected Fed Funds rate at year-end is 3.4%, compared to market expectations of 3.75% to 4.00% coming into the meeting.
- The median long-run neutral rate edged up from 2.4% to 2.5%. The Fed expects the Fed Funds rate to be above the neutral rate for the next two years.
- The projected median core PCE at year-end is 4.3%, compared to the JPM May forecast of 4.7%. If the pace of inflation deceleration continues, core PCE should reach easily the 4.3%.
If the SEP projections are to be believed, the Fed is setting itself a low bar to pivot to a more dovish policy.
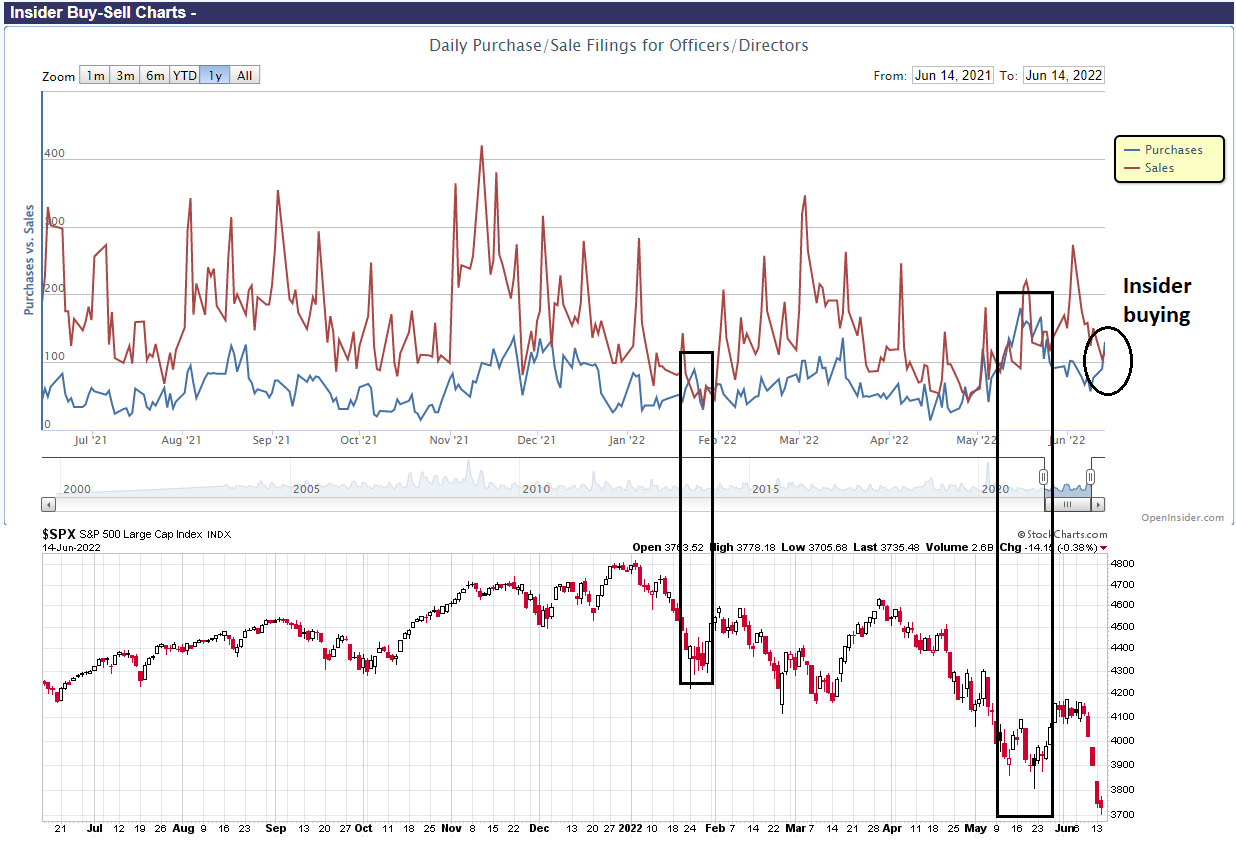
Insiders are buying
I recently wrote that investors should monitor insider activity as the S&P 500 tests its May lows (see The bears gain the upper hand). Though it’s only one data point, insider buying exceeded selling as the market panicked this week.
The market reaction
The market reacted to the FOMC statement and Powell’s press conference by adopting a risk-on tone. Treasuries exhibited a bull steepener. The 2-year Treasury yield fell by 20 bps. The 2s10s yield curve, which was nearly flat at the height of the panic early this week, steepened to 13 bps. The USD fell. Stock prices rebounded.
Tomorrow is another day and the market may pivot to a different take, but I interpret the Fed’s statement, SEP, and Powell’s remarks as slightly more dovish than market expectations.
Fed Funds futures reacted dovishly:
- A 75 bp move in July was unchanged.
- Expectations of three consecutive 50 bps hikes had changed to two, followed by two consecutive 25 bp hikes.
- The terminal rate has fallen by a quarter-point from 4.00% to 4.25% to 3.75% to 4.00%.

Tactically, this looks like a bullish outcome for risky assets. The stock market is an an oversold extreme and a relief rally would not be unusual reaction.
As alwasy, I remain data dependent.
Beyond a relief rally, the Fed is expected to tighten aggressively in the face of a slowing economy. Fed hasn’t been right about inflation, economic growth and rates needed to kill the inflation.
I am of the view that equities have more room to the downside. Longer duration bonds can be the ballast going forward or at least not go down as much.
Dollar weakened. Oil took a big hit. Somewhat confusing.
Oil has remained in negative territory after the latest inventory report from the EIA showed a build against expectations for a draw. A strong USD makes oil even more dear in the rest of the world. Possibility of a global economic malaise may also be weighing on oil and other commodities.
USD weakened, I guess, as the Fed was less hawkish than expected. The yields also dropped that must have put pressure on USD.
Thanks!!
The lower dollar should be supportive of oil and commodity prices. But inventory data probably overwhelmed the dollar’s affect.
With China reopening slowly but surely and summer travel demand, I expect the oil to stay firm.
Futures down 2% after the 06/15/22 FOMC yesterday, the bulls couldn’t even keep up the pretense for more than a few hours. Looks like a replay from 5/4/22 FOMC 2:30 PM spike, afterwards, SPX dropped about 6 trading days in a row, losing -10.35% from the index spike high of 5/4/22.
Update on the $CPCE, the CBOE Equity Put/Call Ratio. It has risen sharply and doing something not seen since 2/27/20 which was the beginning of the pandemic free fall. If you remember, that episode started with a daily gap (2/24/20) then two more daily gap downs on Thursday (2/27/20) and then 2/28/20 before recovering sharply and two gap-filled the next week but only for 3 days. We may not see many gap fills this time, but recovery to the 9 period daily moving average may be possible.
We are likely to see more of these actions (testing 9 period daily MA) in the coming weeks until a bottom can be reached. Seasonality does not favor the bulls near the end of June, but July fourth is seasonally bullish.
Alex_tm
Thanks for your heads up regarding short term.
Appreciate your finding analogs in short term and recent data, and pointing them out. Helps make decisions.
Buying some AMZN here.
Another update on this high $CPCE signal (Hi-C). Every major correction with CBOE data available has one or more of these Hi-C signals. They are clearly not bullish signals but they do suggest the end in in sight (with some exceptional cases such as 2015-2016 which dragged on). The following shows first appearance in relation to the bottoming process:
12/18/18 8 days to bottom -7.87%
5/16/19 18 days to bottom -5.03%
2/27/20 25 days to bottom -26.4%
I’m hearing more and more US officials hinting at negotiated settlement in the Ukraine-Russia war. Blinked said something to that effect on PBS, and a US senator just now on Bloomberg.
Maybe the war will end in a few months.
Everyone on TV just agreed that central banks around the world are tightening, but we haven’t heard from the BoJ yet.
I wonder if this is true.
https://twitter.com/the_chart_life/status/1537545599163191296
Lots of lessons learned regarding divergences, breadth, thrusts, “capitulation”, etc. over the last few months. IMO, the same principles don’t apply now to what we have seen over the last decade plus. It’s not that your data sucks (some of it does), it’s a different environment.