Preface: Explaining our market timing models
We maintain several market timing models, each with differing time horizons. The “Ultimate Market Timing Model” is a long-term market timing model based on the research outlined in our post, Building the ultimate market timing model. This model tends to generate only a handful of signals each decade.
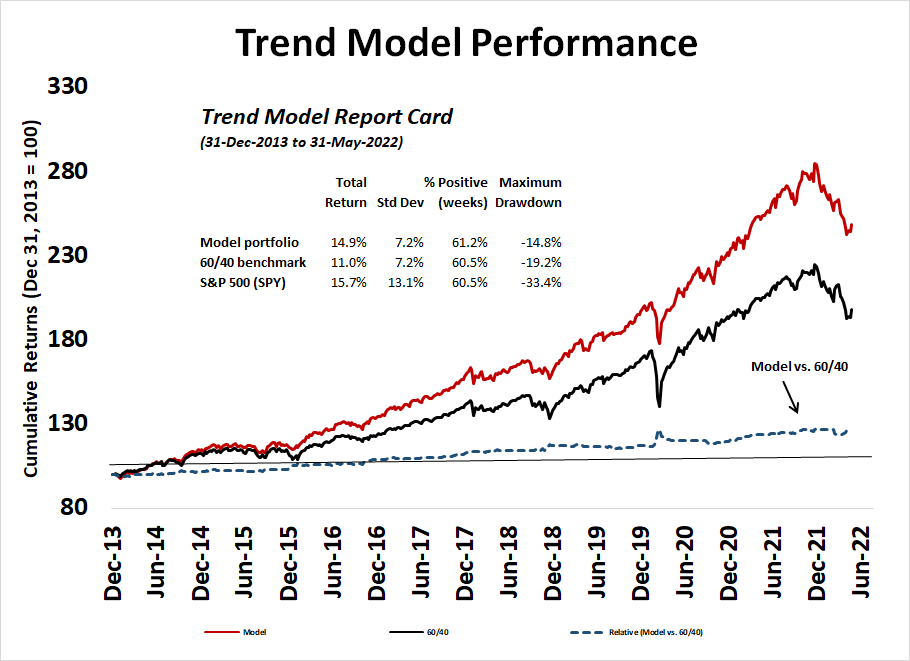
The Trend Asset Allocation Model is an asset allocation model that applies trend following principles based on the inputs of global stock and commodity prices. This model has a shorter time horizon and tends to turn over about 4-6 times a year. The performance and full details of a model portfolio based on the out-of-sample signals of the Trend Model can be found here.
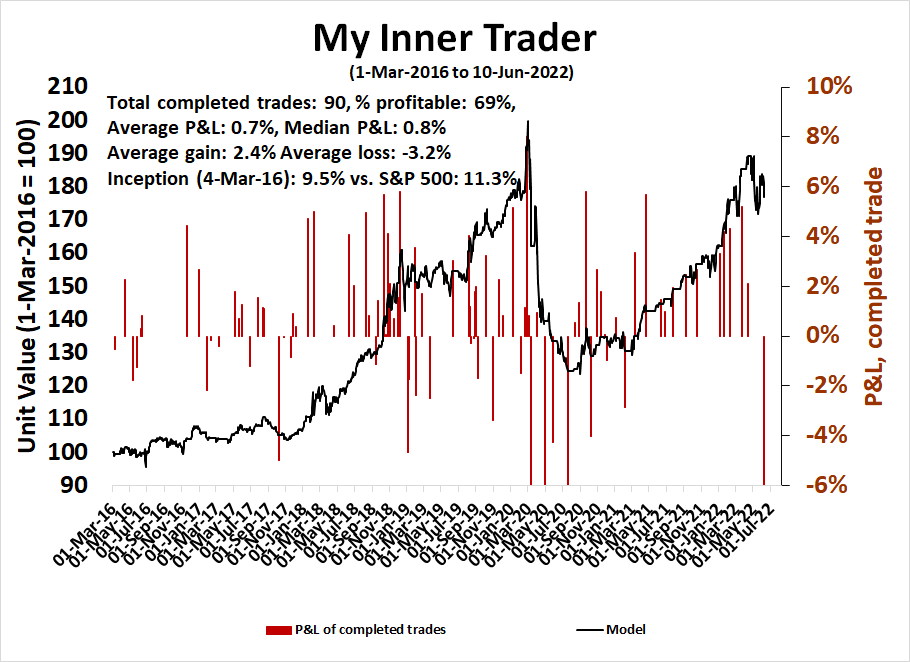
My inner trader uses a trading model, which is a blend of price momentum (is the Trend Model becoming more bullish, or bearish?) and overbought/oversold extremes (don’t buy if the trend is overbought, and vice versa). Subscribers receive real-time alerts of model changes, and a hypothetical trading record of the email alerts is updated weekly here. The hypothetical trading record of the trading model of the real-time alerts that began in March 2016 is shown below.
The latest signals of each model are as follows:
- Ultimate market timing model: Sell equities
- Trend Model signal: Bearish
- Trading model: Neutral
Update schedule: I generally update model readings on my site on weekends and tweet mid-week observations at @humblestudent. Subscribers receive real-time alerts of trading model changes, and a hypothetical trading record of those email alerts is shown here.
Subscribers can access the latest signal in real-time here.
Breaking support
So much for the breadth thrust. After surging off a test off the lows in late May after exhibiting strong price momentum known as breadth thrusts, the S&P 500 consolidated sideways for about a week. The index decisively broke down through a narrow trading range Thursday with a 93% downside volume day, which negated the bullish implications of the previous breadth thrust signal. The index is now testing support as defined by the May lows.

While it would be very easy to turn bearish, sentiment and market internals suggest relatively low downside risk.
Reasons to be bullish
Here are some reasons to be constructive about the stock market outlook. From a technical perspective, Mark Ungewitter pointed out that 90% downside volume following 90% upside volume doesn’t guarantee further drawdowns/

Sentiment models are showing signs of fear, which is contrarian bullish. The correlation of stocks with each other (yellow line) is rising, indicating herding behavior typically seen when the market panics.

Consumer sentiment has tanked. Historically, these readings have been a good long-term entry point for stocks.

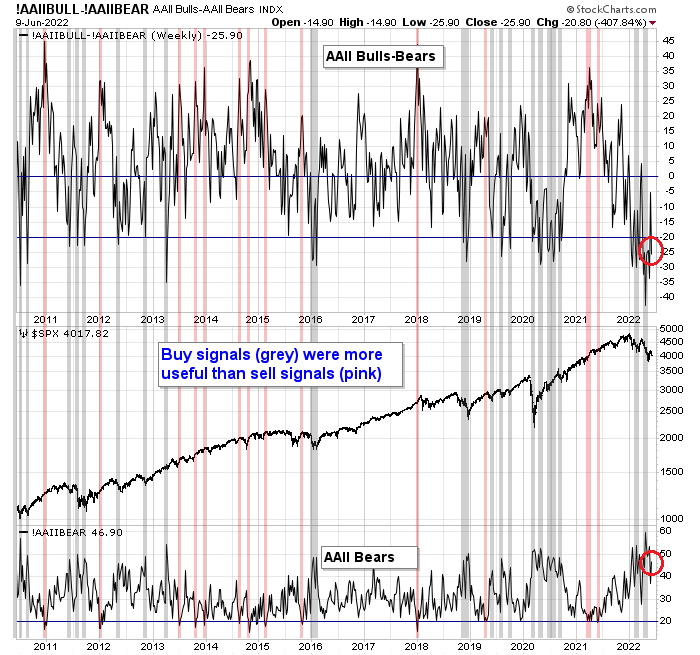
The weekly AAII bull-bear spread fell back to -25%, which is a contrarian buy signal.
Here’s another anomaly to ponder. There has been a lot of anxiety over the housing sector as mortgage rates rose. This is a cyclically sensitive sector that’s a recession bellwether. So why are homebuilding stocks outperforming?

Neutral indicators
A number of indicators are flashing mixed signals, such as market breadth. On one hand, net 52-week highs-lows turned positive when the market rallied but turned negative as the market weakened. On the other hand, the percentage of S&P 500 stocks above their 50 dma fell has reached a deeply oversold condition.

Another set of mixed signals can be found in credit market risk appetite. The relative price performance of junk bonds compared to their duration-equivalent Treasuries tanked and negated the minor positive divergence shown by this asset class. However, the relative performance of leveraged loans are still exhibiting a positive divergence from the S&P 500.

The term structure of the VIX is also showing some mixed signals. While the 1-month and 3-month term structure of the VIX is still upward sloping, indicating complacency, the 9-day to 1-month ratio inverted even as the S&P 500 consolidated sideways, indicating rising fear.

A reliable sell signal
To be sure, the S&P 500 intermediate breadth momentum oscillator (ITBM) has seen its 14-day RSI recycle from an overbought condition to neutral, which is a sell signal. This is a worrisome sign as this has been a very reliable trading model in the past.

Limited downside risk
In the short run, the market is very oversold. Readings are as oversold during the COVID Crash and subsequent recovery in 2020. In each of the cases, the S&P 500 staged a short-term rally even if the market went on to weaken further.

Rob Hanna at Quantifiable Edges found that whenever the S&P 500 fell -2.5% or more on a Friday, the subsequent return over the next two days were strong. Using that template, investors should see a recovery early in the week, followed by the uncertainty of the FOMC announcement on Wednesday.

In conclusion, my survey of sentiment and technical indicators show most are either bullish or neutral. I interpret this as crash risk is low and downside potential is limited. As the S&P 500 tests its May lows again, keep an eye on insider activity. Should insider buying rise above selling, it will be another signal that the support defined by the recent lows is likely to hold.

Economic statistics are accumulated and produced slowly. They fail us when things happen quickly. Elon and Jamie see daily data and are saying an economic hurricane is coming. The politics of high inflation are so bad that Biden and other world leaders have unleashed their Central Bankers to put two feet on the monetary brakes. That is overwhelming technical analysis that has a proven track record during most of history.
The extreme asset bubbles of housing and equities are early in their unwinding. Home prices haven’t fallen even though sales are down and inventories are shooting up. The S&P isn’t off very much given the collapse in bonds. Future earnings estimates are just slightly down as analysts don’t factor in the sharp recession obviously coming. Picture where we will be in six or even three months.
So microeconomic and Central Bank factors are overwhelming the scene.
Preliminary results for the UM Index of Consumer Sentiment for June is 50.2. That’s probably the lowest reading I’ve seen in my adult lifetime, and it correlates well with the anecdotal gloom from colleagues at work when talking about their 401(k)s.
May be a good time to look across the valley to the other side.
Great call on gold stocks last week Cam, thanks for pointing it out.
Cam, great analysis!
=> Using that template, investors should see a recovery early in the week, followed by the uncertainty of the FOMC announcement on Wednesday.
Do you expect investors to buy on Monday / Tuesday in advance of FOMC on Wed? I’d think otherwise. The markets remain soft early in the week and then possibly rally once the FOMC is out of the way.
The recent drop in market may dissuade Powell to make remarks to cause a crash. I think Powell wants a lower market to bring down inflation and for people to return to regular jobs.
That makes sense, but the risk of a hawkish suprise is very real. The initial wave of selling started with the ECB, Fed has lost credibility and wants to restore it – Powell said in hindsight they should have raised sooner – sending the message that they are serious about keeping inflation expectations anchored may be more important than the market being down another 10-20%
I’m torn but I do hear your viewpoint. Thanks for responding.
I think people will be nervous about buying before FOMC because there is so much noise around it. The exception might be if we go down hard on Mon and Tues then some may try to catch the knife.
I think people are expecting a delayed Fed Put. It’s coming, only when? Does anyone think that when we start getting stress with all the zombie companies, and Forex stress, and housing problems, and layoffs that a Put is never coming? That the government will have to pay higher interest indefinitely on it’s ballooning debt?
So when something breaks, the Put happens.
It’s just a matter of when….or so that may be what they think, only they are assuming that the Put will work.
In the past when the market really tanked, like in 2000 or 2008 the Fed dropped rates really hard, but the market kept going down because the problem was the economy.
In 2018 when there was the taper tantrum it was based on Fed rate manipulations, so when the Fed balked, things roared back.
There was real fear in 2020 from the unknown impact of Covid, but soooooooo much money got sprayed at the system it recovered, and of course there was the vaccine and the reality that Covid , bad as it was was not Ebola spreading like measles.
So once again we have a Fed induced market drop, so what will happen?
I think what may happen is at a certain point we get the Fed Put and we get a bounce, maybe a hard one, but this economy with all the debt, the zombie companies is not healthy and we may discover that after the bounce the underlying economic malaise causes the market to plunge, and then we get the real panic….printing money, bailing out banks or insolvent companies does not create wealth.
That’s my scary story ,but maybe the helicopter is warming up the engines at the Eccles Building. We’ll see.
It seems your roadmap of the economy and the Fed actions are similar to those of David Hunter.
https://twitter.com/DaveHcontrarian/with_replies
David is also expecting a Fed pause, and the market to anticipate that pause before the Fed actually pauses. That’ll trigger a melt-up to 6,000 on S&P500.
However, later this year will kick an economic bust and a massive drop of 80% driven by deleveraging and deflation as the Fed resumes raising interest rates to lower inflation.
Does that sort of capture your view as well?
Well, I’m in the Little Boy Who Cried Wolf mindset….how much of a bounce from the Fed Put is anyone’s guess. Will the break be too hard and the Fed panic and overstimulate? Will the hit to the economy be impressive and widespread enough that no politician will want to oppose gov’t stimulus? If something like that happens we could get a euphoric break higher.
Or maybe we get a Fed Put that fizzles, the s##t hits the fan and things unravel, because spraying money at insolvent companies is unacceptable, and unless we get another pandemic as an excuse to pay people to stay at home, the market gets flushed out the toilet.
So what kind of volatility of emotion are we in for? Do we go from this pessimism to euphoria to despair in less than a year?
What is known is that we are in a sovereign debt problem/crisis….federal budget will not be balanced, debt will increase, monetizing debt will continue, so eventually real assets have to go up in nominal terms, unless of course we get a total societal breakdown, but I think that before that happens the helicopter money will be sent out.
The way the market is today, will the Fed be more hawkish than expected. What is insane is that not so long ago they wanted more than 2% inflation to make up for the years where it was less than 2%, now they are going to push rates until things break.
I’m not sure these guys should be allowed to drive buses, never mind monetary policy.
I could go on, but it’s all speculation….try to identify mid term momentum.
Thank you for your response. Interesting times lie ahead for sure.
Echoing what Cam said above…
“What should concern investors is that while Wall Street analysts have lowered their EPS estimates for the June quarter in response to the negative guidance, the cuts have been by much less than historical averages. In addition, analysts have actually increased estimates for the second half of the year.”
“Boruchow said history suggests that the negative revision cycle is only in the early innings.”
https://www.marketwatch.com/story/profit-warnings-kicked-into-high-gear-and-theres-still-no-slowdown-in-sight-11654960520
It’s important to look under the hood of the earnings estimates. By one account (Michael Santoli’s of CNBC and ex-Barron’s), the energy sector is getting most of the upward revisions in the earnings estimates while the other sectors are flattish. I haven’t been able to find data for this observation.
If it’s largely correct, then the surprises could come more from the energy sector.
FWIW