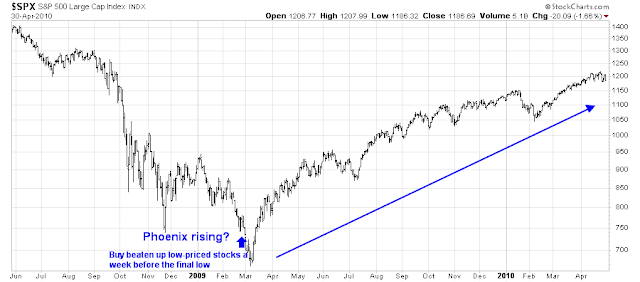
Mid-week market update: My last publication (see Why last week may have been THE BOTTOM) certainly caused some contraversy. Why I am making no promises the future, I turned cautiously bullish on February 25, 2008, just a week before the generational March 2009 bottom (see Phoenix rising?).
In that post, I postulated that the market was sufficiently washed out that it was time to dip your toe into the water with speculative Phoenix stocks, low-priced stocks that had fallen dramatically and saw significant insider buying. The good news is the timing of the call was nearly perfect, it came a week before the ultimate low. The bad news is the S&P 500 fell another -8% before the market finally bottomed.
Nobody’s perfect.
Still washed-out
You can tell a lot about market psychology by the way it responds to news. The WSJ reported what everyone already knew, that Fed Chair Jerome Powell Says Higher Interest Rates Could Cause a Recession:
Federal Reserve Chairman Jerome Powell said the central bank’s battle against inflation could lead it to raise interest rates high enough to cause an economic downturn.
“It’s certainly a possibility,” Mr. Powell said Wednesday during the first of two days of congressional hearings. “We are not trying to provoke and do not think we will need to provoke a recession, but we do think it’s absolutely essential” to bring down inflation, which is running at a 40-year high.
In response, the S&P 500 opened in the red early in the morning as overseas markets were weak overnight, but closed roughly flat on the day. That’s how wash-out markets behave.
Sentiment models are contrarian bullish and supportive of an advance. The bull-bear spread in Investor Intelligence sentiment printed another low this week, and readings were only exceeded by the levels seen during the GFC. II bears, however, were only comparable to the 2011 low.
Morgan Stanley’s prime brokerage arm reported that net leverage of long/short hedge funds fell to levels last seen during the GFC.
Is sentiment sufficiently panicked to signal a major market bottom?
Buy signal, or just a setup?
I honestly don’t know. Mark Ungewitter observed that past breadth wipeouts, as measured by the % of S&P 500 above their 50 dma, tend more to be buy signal setups than actual buy signals.
Bull and bear cases
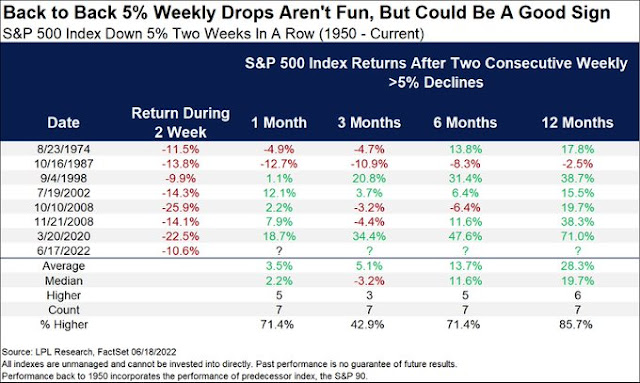
The bull case, as outlined by Ryan Detrick, is the S&P 500 has tended to perform well after two back-to-back -5% weeks.
As we approach Q2 earnings season, the bear case is while bottom-up EPS estimates are still rising, strategists are cutting their top-down estimates. This could be a key inflection point in the cycle where top-down analysts see an economic slowdown ahead, but bottom-up company analysts won’t revise their estimates downwards until they speak to company management. If Q2 earnings disappoint or if guidance is weak, watch for mass earnings downgrades.
Relief rally ahead
The odds favor a short-term rally. Rob Hanna at Quantifiable Edges reported that his Quantifiable Edges Capitulative Breadth Indicator (CBI) spiked to 11 on Friday. Readings above 10 have historically resolved in a bullish manner, at least in the short run.
It’s possible that last week marked the first market bottom that will be retested sometime in the coming weeks. History doesn’t repeat, but rhymes. We have not seen the positive divergences that characterize bear market bottoms yet. The March 2009 bottom was signaled by positive breadth divergences and sparked a rare Zweig Breadth Thrust buy signal. The market never looked back after that.
If the relief rally were to continue, initial resistance can be found at the first gap at 3830-3900, secondary resistance at the next gap at 3975-4010, and a strong resistance zone at 4080-4200. If the rally were to fail, watch for a test of support and possible positive technical divergences.
My inner investor is still cautiously positioned, but he dipped his toe into the water. My inner trader is standing aside until volatility calms and a trend begins to manifest itself.


re: cautiously bullish on February 25, 2008, just a week before the generational March 2009 bottom
That’s a typo on 2008, should be 2009
By some methodologies using the ITBM oscillator as spotting of market bottom, we are no where near a bottom because ITBM for 2022 has not sank below -100 where you will begin to see vertical light green bars below. All the other major corrections or bear market bottoms had this feature, at least using their ADV DECL data going back to 2004 which can be found free and live here, use the mouse scroll to compess and click and drag to the right to see the rest of the chart:
https://www.tradingview.com/chart/g6UTyQGu/
One thing which is impressive. Put up a weekly chart of the SPY or DIA or QQQ and compare the trading volumes around the GFC and at present. What’s going on? Trading volume now is maybe 25% of what it was for a couple of years around 2009. Isn’t this a case of rising on low volumes? On a chart of this scale, maybe we are just in a correction? If we are in a bear, how come the volumes are so light?
I have no idea where things are going, just that some things don’t fit. Like why TLT:JNK is low when in prior market dumps it went up a lot.
Confused and hiding mostly in cash.
Trading volumes may be light due to disbelief in the current rally. But that’s what we want to see at this stage of the reversal. Institutional fund managers are unlikely to stick their necks out until the reversal is well underway.
I don’t agree…in august of 2007 we still had not hit the ATH of Oct 10 and the weekly SPY volume was around 2.2 billion, in Nov 2007 was around 1.7 billion, which was a bit higher than the highest in 2020. The highest were around 3billion. In 2022 we have not even hit 1 billion, most weeks it is 500 to 600 million max, which is why I said around 25%.
Now maybe they were bailing out before Oct 2007, and before 2008. It just doesn’t fit. Just like why the price of GME is still over 100 bucks.
Considering HFT and how this could magnify trading volumes, how come we don’t have much higher volumes than in 2007? AAPL and others have split since then, do we compare apples with apples? Meaning if AAPL has split 6:1, if you trade 6 shares now which is 1 old one is the volume upped 6 fold?
Anyways, if you look at volumes over the last 25 years, the trend has been higher and higher…so, why aren’t we at much higher volumes?
This is a manifestation of passive investing dominant in retirement accounts, by and large buy-n-hold. Money in retirement accounts is huge and growing and is actually the backbone of the markets today.
Great example of how setbacks can inspire us to heights unachievable otherwise:
https://twitter.com/SCMPNews/status/1539733216029904896
Markets seems like it’s acting much faster in recent history and this year’s rapid negative developments (economic/geopolitics/etc.) not helping out either. Wondering if such speed has some non-negligible effects on sentiment and technical indicators.
Also, personally i’m still quite chill given the bear market maybe partly because of Cam’s guidance. But still it’s a far cry from the panic felt during Covid crash. Not sure if we can put much stock into indicators that suggest we’re experiencing same kind of panic as in 2020.
Stocks and bonds nicely correlated the past two days.
ARKK +7% today on above-average volume.
What are the odds that Cathie Wood ends up a big winner in the next bull market? I wouldn’t bet against it.
Sliced right through SPX 3800.
Damn. Might slice through 3900 as well.
Closing in on a 90% upside day. Apart from the low volumes, the action this week must qualify for some type of breadth thrust.
Good call on the relief rally by Cam. What we are seeing is really a replay of the May 20 options expiration with a good returns for the longs on a holiday shortened week. Notice price has broken to the upside through last week’s high just as it did on Friday May 27.
The real question is where is this going to go? Price never did rise above that Friday’s high on May 27 and it stay flat the whole week after that until it broke sharply to the downside on Thursday-Friday June 9.
In a bear rally, a signature of price action is that the rallies can’t really put two weeks back to back together in gains. It tried on 3/18 to 3/25 but stalled quickly and 3 months later, the weekly trend is still down. Seasonality favors the bulls in the coming 4th of July holiday and no doubt the bulls will try to extend this rally.
I am enjoying the rally fully aware that it might end anytime. Taking partial profit and raising the stops. It is rebuilding some emotional capital too.
Volume on the Nasdaq 1.74x the average.
I read that some technology stocks are now classified as value stocks. May be a contributing factor.