Preface: Explaining our market timing models
We maintain several market timing models, each with differing time horizons. The “Ultimate Market Timing Model” is a long-term market timing model based on the research outlined in our post, Building the ultimate market timing model. This model tends to generate only a handful of signals each decade.
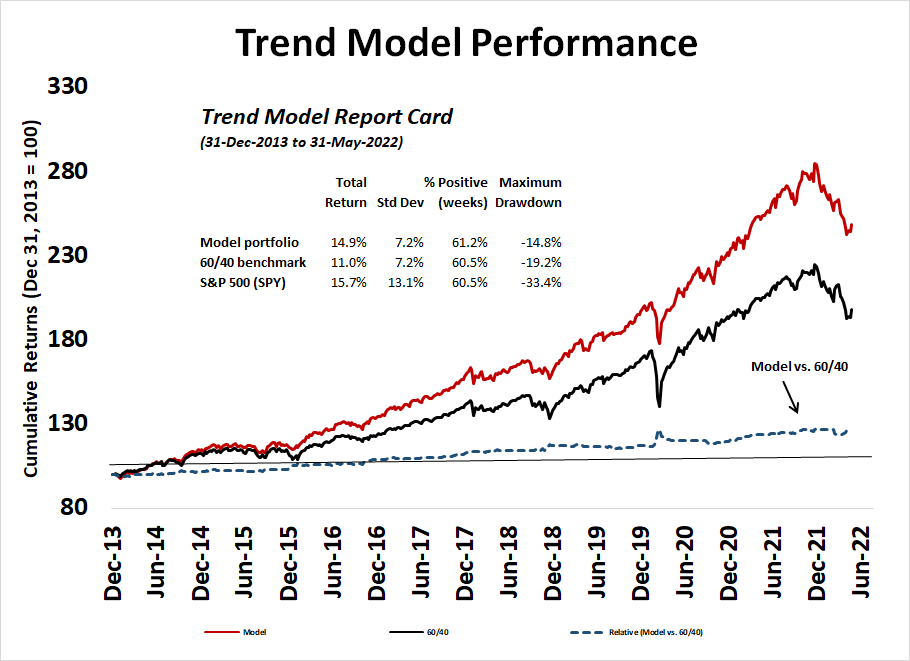
The Trend Asset Allocation Model is an asset allocation model that applies trend following principles based on the inputs of global stock and commodity prices. This model has a shorter time horizon and tends to turn over about 4-6 times a year. The performance and full details of a model portfolio based on the out-of-sample signals of the Trend Model can be found here.
My inner trader uses a trading model, which is a blend of price momentum (is the Trend Model becoming more bullish, or bearish?) and overbought/oversold extremes (don’t buy if the trend is overbought, and vice versa). Subscribers receive real-time alerts of model changes, and a hypothetical trading record of the email alerts is updated weekly here. The hypothetical trading record of the trading model of the real-time alerts that began in March 2016 is shown below.

The latest signals of each model are as follows:
- Ultimate market timing model: Sell equities
- Trend Model signal: Bearish
- Trading model: Neutral
Update schedule: I generally update model readings on my site on weekends and tweet mid-week observations at @humblestudent. Subscribers receive real-time alerts of trading model changes, and a hypothetical trading record of those email alerts is shown here.
Subscribers can access the latest signal in real-time here.
A disorderly unwind
Just when you thought it was safe to go back into the water after an FOMC meeting that turned out to be more dovish than expectations, the Swiss National Bank unexpectedly raise rates by a half-point after holding it at -0.75% for almost a decade and sent global asset prices reeling.

Here’s why the SNB’s actions mattered. The rate hike was a reversal of a long-held policy of the SNB, which had been trying to hold the CHFEUR exchange rate down in order to bolster Swiss competitiveness. CHFEUR spiked nearly 2% on the news. The daily move far exceeded anything in its seven years of Swiss interest rate stability.

The outsized move in the CHFEUR exchange rate made Value-at-Risk (VAR) models go haywire. For readers unfamiliar with these models, they estimate risk based on the past history of volatility. When actual volatility spiked, risk managers tapped traders on the shoulders and told them to reduce the size of their books. Almost instantly, global markets sold off in a price insensitive liquidation stampede.
It was a textbook example of non-linear dynamics. A metaphorical butterfly flapped its wings in Zurich and the global financial markets shuddered.
Capitulation watch
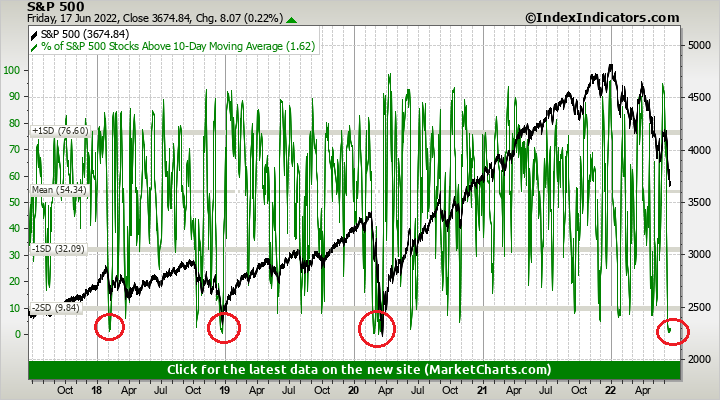
Price insensitive selling is a classic sign of capitulation. Here are some other ways of watching for an oversold extreme and washout.
The ratio of the percentage of S&P 500 above their dma to the percentage of S&P 500 above their 150 dma reached 20%. These are market crash levels last seen in 2002, 2008, 2011, and 2020. All saw short-term snapback rallies. Moreover, NYSE 52-week lows haven’t spike to these levels other than the 2008 crash in the last 20 years.

The AAII weekly bull-bear spread deteriorated to another crowded short extreme reading again. Other than a recent episode, bearish sentiment hasn’t been this high since 2011.

Other signs of washout and capitulation on Thursday include:
- Reports of the second biggest sell program in a year and the fourth biggest of all time.
- Reports of no-bid markets in high yield bonds.
- A 93% downside volume day on the NYSE.
- The S&P 500 saw over 90% of its issues decline on Thursday and that was the fifth episode in seven days. This has never happened in the history of the index since 1928, according to SentimenTrader.
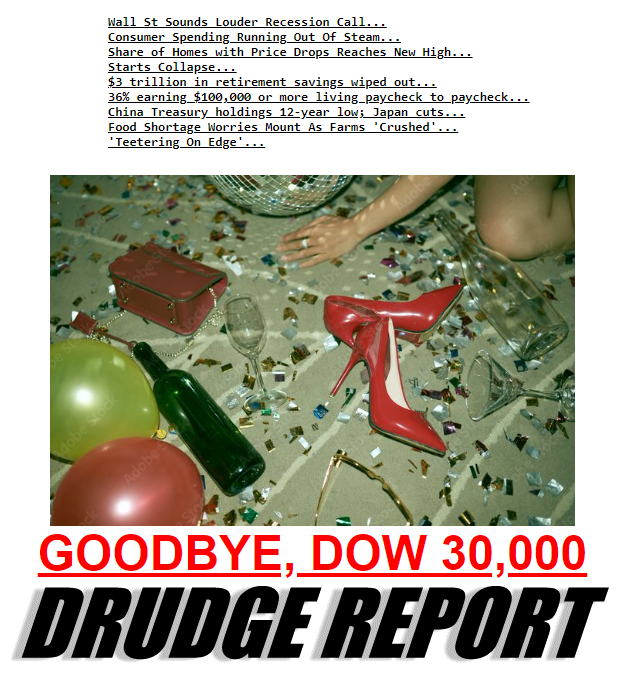
- A panicky Drudge Report headline on Thursday as a contrarian sentiment indicator.
Be patient
For investors who are willing to be patient, the rewards can be high. Mark Hulbert found that if you bought the S&P 500 after it first fell -20%, which occurred last Monday, the average one-year gain since World War II was 22.7%.

A more detailed analysis by Jonathan Harrier identified 11 similar events since 1950. While returns were strong, investors also endured significant drawdown risk.

For the last word, I leave you with Stan Druckenmiller, who recently spoke at the Sohn Conference:
This is my 45th consecutive year as a Chief Investment Officer. In 45 years I’ve never seen a constellation where there’s no historical analogue. I probably have more humility in terms of my views going forward than I’ve ever had.
In conclusion, this volatility too, shall pass. Hopefully, the markets can return to a more normal state next week.
Pay attention to 1973 with final return -28%. If this oil shock and high inflation of 2022 continues, the next few quarters could very well look like 1973-1974 which was pretty ugly. The Fed has an article on this:
https://www.federalreservehistory.org/essays/oil-shock-of-1973-74
‘In the words of an economist who presented to the Federal Open Market Committee in May of 1971, “the question is whether monetary policy could or should do anything to combat a persisting residual rate of inflation … The answer, I think, is negative. … It seems to me that we should regard continuing cost increases as a structural problem not amenable to macro-economic measures” (Romer and Romer 2012).’
Interesting. I wonder if Powell has read this article. So far, his stance seems to be quite hawkish. He will continue to raise rates and bring the global economy on its knees without achieving his long-term goal of 2% inflation.
We might see a change of heart but that may still be a few months away.
What this shows is that it all comes down to the cost of energy. If the cost is going up, then prices must eventually go up. We can be more efficient in our use of energy which would improve productivity based on units of energy but that takes time and innovation.
Emerging markets will compete with us for energy and other resources, it’s normal.
Barring some breakthrough in nuclear fusion technology making economically priced nearly limitless power, it seems to me that we are in an energy/commodity bull market that may dwarf everything we have seen before.
Just look at the grades of copper that are being mined. Getting a ton of copper from 3% ore has to cost less than from 1% ore, even if we have improved efficiency it isn’t 3 times as efficient.
Maybe robots on the sea bed, but that won’t be cheap.
So if they crash the markets and the economy and we use less oil, the price of oil will come down, but this will not create oil.
Global demilitarization would save huge amounts of resources, that ain’t gonna happen in the foreseeable future.
So odds are we will see some structural inflation because the resources are getting dearer and the Fed is powerless to increase supply.
Yup! Oil prices will go down substantially only if there is a significant recession in many parts of the world.
The Russian supply is expected to decline by 3Mbpd starting in July. No way KSA can offset that decline.
Btw, more than crude, it is the refining capacity that seems to be the gating factor in keeping the gasoline prices high.
“In conclusion, this volatility too, shall pass. Hopefully, the markets can return to a more normal state next week”.
and then what? For how long would such volatility remain subdued? Are those who are swimming naked, when the tide runs out truly been admonished or there are more naked swimmers out there? BTC below 19K this weekend suggests we have more naked swimmers out there?
Cam, the two studies you cite suggest positive returns but over a one-year period. But you are still a long-term bear.
Apart from the signs of wash out and capitulation, are there any other indicators of positive results in coming days and weeks?
The big drops after the 20% declines happened in the 1970’s with inflation like today and then in the last three bear markets in today’s Fed liquidity driven economy and hyped up asset values.
Looking across the valley is easy when the bull market is still fresh in our minds and we don’t know how deep the valley will be and the nasty surprises that will accompany it.
Well said. It looks dark and gloomy ahead. Not sure if we will get meaningful bounces. It’s better to preserve capital and buy when no one else would want to.
Nice discussion (but long) with Helene Meisler & Jim Chanos from Saturday Here:
https://www.youtube.com/watch?v=KMCVwY_tl3o
Looking across the valley is never easy, as it always entails the reality of making the journey. But as I always remind myself (and my kids) setbacks are part of the cycle of life and each one has its silver lining(s). We’re often given the strength to reach elevations otherwise unattainable afterwards.
We spent the better part of the week in Vancouver- first time back since 2017. A little less vibrant than I recall – partly the post-pandemic effect and partly the economy. Having passed up an opportunity to buy in 2004 we are now looking for a vacation condo – only to find a ban on foreign purchases for the time being.
After spending most of 2022 in the green or flat now unfortunately in the red by over -6%. Somewhat reminiscent of June 2020! I’m going to take things one step at a time and hopefully end the year green.
Interesting that there is a ban on purchase of condos in Vancouver for foreigners.
That market is destroyed by money from China and the accompanying shenanigans cooked up by local agents and civic servants. It eventually resulted in additional 15% tax form foreign buyers a few years ago, after local uproar. Now it is a ban. Driving around Vancouver and you will see Chinese Concessions in modern day Vancouver. Does Canada want Chinese money, or not? Ask Brits, do they realize that there is a Londongrad inside London?
From Bespoke Investment Group:
With CPI above 8% for months, gas prices above $5/gallon, interest rates spiking to levels not seen in a decade, consumer sentiment at all-time lows, GDP tracking for two straight negative quarters, and large-cap stock market indices down 20-30%, we’d be shocked if the US is not already six months into a recession that began in Q1 2022. The National Bureau of Economic Research (NBER) is the group that labels recessions. Remember, though, that by the time the NBER makes a recession “official,” it’s usually many months after the fact, and in many cases, the trough of the recession has already been reached! That’s why it’s important to remember that markets are forward looking and trade based on expectations for what’s going to happen, not based on what has just happened
It is helpful to understand the various outcomes that are possible from a no recession (low probability) to a mild recession to a deep recession and some are speculating a global depression (low probability). Assuming economy goes through a mild to severe recession, the market may go down another 15-20% from current levels. But not in a straight line.
How does one navigate through the period? How does one position for the next business cycle that will likely be driven by new imperatives of global supply chain reorganization, de carbonization and housing shortages in US.
It would be helpful if Cam and others can comment on their views.
Maybe if one takes a real long term view of things.
Where even bear markets like 1974 or 2000-2002 are just dips in an upward path….because the dollar has been losing purchasing power and is around 1% of what it was worth in 1929, so the DOW would be around 300, the ballpark of the 29 high.
Will the purchasing power of the dollar continue it’s decline? When you consider that it was backed by gold until 1971 and how the market exploded higher since 1982 and how we have all this debt and how there is no political will to be fiscally responsible because that is politically unacceptable. So the purchasing power will decline and markets will resume an upward path. But what kind of dips and potholes can we experience?
People believe what they want to believe, confirmation bias in other words. An example is that the $ will be world reserve currency for many years to come. I am reminded of 2 things…Alvin Toffler “Future Shock” in which he talks about change accelerating..prescient book from the 70s? maybe even 60s, I forget….2nd thing Hemingway on bankruptcy “gradually then all of a sudden” ( sorry if I massacred the quotes and dates).
So has the reaction to the Russians with sanctions accelerated the move away from the USD? Well it seems to give an incentive. Why is the ruble strengthening? Because it’s tied to stuff like oil and gas…you know, useful stuff.
I’m not a crypto fan…but blockchain yes…which would you prefer a digital central bank coin or a digital coin backed by a basket of commodities? It’s true that technology has lowered the cost of commodities and we are better off for that, and we would “like to believe” that this will continue, only will it? What if energy costs continue to rise?
So my thinking is that when this bear is over, allocate your money into companies making/mining real indispensable stuff. My bias is hard commodities.
The central banks may continue to print and exercise their power but a shift to something resource based may happen faster than on thinks. I think the cryptos show how so many people don’t trust fiat…there is greed and foolishness in the BTC Ponzi also in my opinion, but we are seeing an increase in physical trusts of precious metals, uranium….what’s next? When can these get linked into some kind of super trust which backs a blockchain coin? I don’t know, but look how fast the ruble recovered. What will happen when we get the recession Powell wants and all the grief that comes with it, and we get a massive pivot, because remember that letting the American majority suffer is politically unacceptable (applies to all the western world) and then we get a crash in the $ and of course more inflation.
Where will the money go?
I am mostly in cash, but I have been hiding in cash mostly for over 5 years…I’m a chicken and have been waiting for a reversion to the mean for ages…not that I want one, but I just don’t want to be all in if everything does a 1929 style crash.
Good luck to everyone
What caused the significant discrepancy between Harrier’s and Hulbert’s results?
One had an avg one-year return of 22.7% while the other only 13.57%?