Preface: Explaining our market timing models
We maintain several market timing models, each with differing time horizons. The “Ultimate Market Timing Model” is a long-term market timing model based on the research outlined in our post, Building the ultimate market timing model. This model tends to generate only a handful of signals each decade.
The Trend Asset Allocation Model is an asset allocation model that applies trend following principles based on the inputs of global stock and commodity prices. This model has a shorter time horizon and tends to turn over about 4-6 times a year. The performance and full details of a model portfolio based on the out-of-sample signals of the Trend Model can be found here.

My inner trader uses a trading model, which is a blend of price momentum (is the Trend Model becoming more bullish, or bearish?) and overbought/oversold extremes (don’t buy if the trend is overbought, and vice versa). Subscribers receive real-time alerts of model changes, and a hypothetical trading record of the email alerts is updated weekly here. The hypothetical trading record of the trading model of the real-time alerts that began in March 2016 is shown below.

The latest signals of each model are as follows:
- Ultimate market timing model: Sell equities
- Trend Model signal: Bearish
- Trading model: Bullish
Update schedule: I generally update model readings on my site on weekends and tweet mid-week observations at @humblestudent. Subscribers receive real-time alerts of trading model changes, and a hypothetical trading record of those email alerts is shown here.
Subscribers can access the latest signal in real-time here.
Different fears for different folks
Is the market sufficiently fearful yet? There is no single sentiment indicator. The market consists of different constituents and different types of investors can be bullish or bearish at any single point in time. While conventional surveys such as Investors Intelligence shows continued levels of extreme bearishness, other indicators can tell different stories.

The NAAIM Exposure Index, which measured the sentiment of RIAs investing individual investor funds, fell below its 26-week Bollinger Band for a second consecutive week, which has shown an uncanny accuracy as a buy signal during the history of the index since 2006.

Institutional sentiment, as measured by the latest BoA Global Fund Manager Survey, reveals positioning is at a defensive extreme that’s only exceeded at the height of the Great Financial Crisis.

The Financial Times reported that hedge funds have dramatically reduced their leverage and exposure in response to the recent equity market weakness.
The sharp pullback has prompted funds that trade with Goldman, Morgan Stanley and JPMorgan Chase, three of the largest prime brokers on Wall Street, to dial back their positions over the past week, according to client reports seen by the Financial Times…
Goldman on Thursday reported five consecutive days of declines in gross leverage — a measure of a fund’s overall exposure to stock-price moves — among its US long-short equity hedge fund clients, the largest reduction since it began tracking the figures in 2016.
At Morgan Stanley, the gross leverage of its US long-short hedge fund clients — which attempt to profit on stocks rising or falling — this week fell to its lowest level since April 2020 and was just 15 per cent above a low hit in March of that year, when the pandemic pushed the US into recession. It noted that those hedge funds were again selling stocks but had also added to their short trades, bets that could pay off if a stock or index falls in value.
Executives working in JPMorgan’s prime brokerage unit, which reported similar findings, said there were signs that the US stock market could be close to finding a bottom, but they warned that funds still had room to cut their exposure to the market.
While II sentiment, RIAs, institutions, and hedge funds have been cutting equity exposure, retail investors are still exhibiting a strong risk appetite. A snapshot of Fidelity’s customer trading activity shows that retail is actively buying the high-octane names in the market.

Four out of five ain’t bad.
Poised for a rally
I continue to believe the market is due for a relief rally even under a major bear market scenario. The market is very oversold on breadth indicators and it rallied in similar circumstances during the bear markets of 2000-02 and 2007-09.
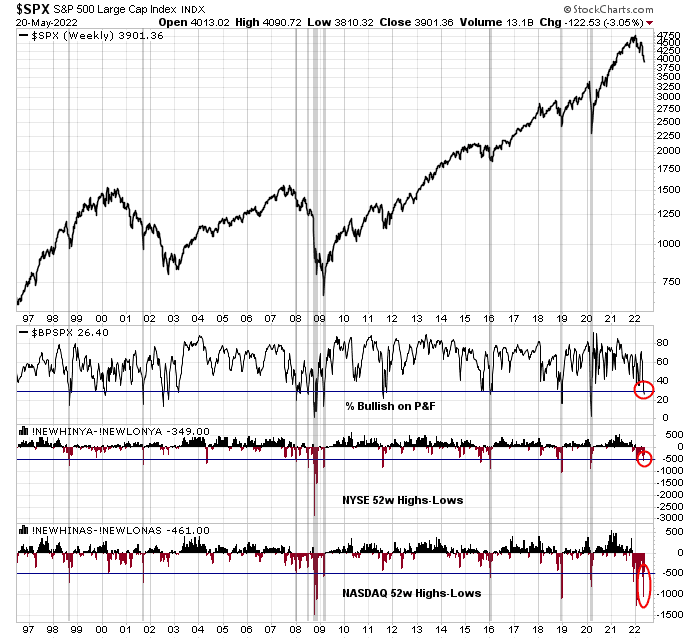
While breadth indicators appear very oversold from a long-term perspective, all versions of Advance-Decline Lines are exhibiting positive divergences, which is tactically constructive.

The S&P 500 intermediate-term breadth momentum oscillator just flashed a buy signal when its 14-day RSI recycled from an oversold condition to neutral. In the last five years, 20 buy signals have resolved bullishly (grey lines) and four were bearish.

Speculative growth stocks such as ARKK, which led the downdraft, are holding up remarkably well both on an absolute and relative basis. This is a sign of a renewed equity risk appetite.

An analysis of the top five sectors of the S&P 500, which comprise over three-quarters of index weight, shows a constructive picture. Technology and financial stocks have stabilized relative to the S&P 500, and communication services, which had been hard hit, has found a bid. It would be difficult for the index to either rise or fall without a majority of the top five sectors, and this technical assessment argues for stabilization.

For the final word, the latest issue of Barron’s has bear claws on the cover as the example of another possible contrarian magazine cover indicator.

In conclusion, a review of different sentiment metrics indicates an atmosphere of heightened fear. While the intermediate path of least resistance for equity prices is still down, I continue to believe the risk/reward is tilted to the upside in the short run.
Disclosure: Long SPXL
https://www.marketwatch.com/story/the-technician-who-called-the-2020-market-bottom-says-a-shocking-rally-is-in-store-11653043583?siteid=yhoof2
This is Tom De Mark, expecting a countertrend rally to 4400. He made an uncanny, accurate call in March 2020, to the day of the bottom as well, and is making the same now. He is now expecting a 62% retracement of the current pull back.
Thanks for sharing D.V. . Always good to know what DeMark is thinking. In a previous life I managed institutional money and had access to DeMark via Bloomberg and used it regularly. Like anything else it is not a panacea but can be uncanny at signalling market exhaustion points. Adds weight to the counter trend rally scenario.
Interesting. Thanks.
Contrary Indicator?
Headline in the Wall Street Journal today:
Stock Market Bottom Remains Elusive Despite Deepening Decline
History shows markets have long stumped strategists trying to predict when downturns would end. Many investors and analysts looking back at historic pullbacks believe that the current slump still has a way to go.
On the 25th of May NVDA reports its earning. This stock has been the darling of the Hedge Fund crowd. If on bad earnings the stock rallies I would be confident that the bottom is in for a short term rally.
The most accurate indicators may be the ones that arrive unbidden. As I recounted recently, people who normally don’t follow the markets are worried about their 401ks.
And members of the Fed don’t live in a vacuum – they hear the same kinds of comments from friends/ relatives/ acquaintances/ colleagues in their daily lives.
We haven’t seen real capitulation yet. Highest VIX reading so far is 39, need to see 50 plus. And while sentiment is bad actual exposure to equities hasn’t changed much. That needs to change for durable bottom.
i.e retail exposure to equities….
Does anyone think the non-retail crowd have been unusually quick to de-risk this time around and hence why the VIX is well-behaved? Or is this normally how it goes?
Perhaps the only thing going for a relief ralley now is seasonality which is $SPX positive for the very end of May and first 10 days of June. Seasonality is somewhat reflected in the current sell off and has put the brakes on the sharp drops. A larger positive effect is usually seen in the first week of July, usually seen close to the July 4th holiday.
Seasonality effect seen over the last 15 years of $SPX and projected for ’22
https://ibi.sandisk.com/action/share/497dc309-604c-4a1f-85ad-c6a8d4734f13
Correction, the link above is for the 5 years $SPX summation seasonal return. It turns out looking back over 15 years, there is good correlation not only for 2022 but also other years and offer a valid approach to timing the SPX. It now appears some of the relief ralleys in 01/26, 02/25, 03/16 and others including Friday close can be explained with basis in seasonality. The bulls may be jumping the gun though with Friday 05/20 close as positive SPX seasonality starts in earnest 05/27/22 and lasts about 10 days before falling off a cliff by the end of June.
That weekly NAAIM looking at when it hits the lower BB is a relatively uncommon signal, and when the SPX weekly RSI starts showing an uptrend is interesting. Too bad it did not exist before 2006
Not to be outdone by our fellow Students, I offer Jeremy Grantham. He is a celebrity again and is everywhere on all media.
Scott Ritter’s Switcheroo: “Why I Radically Changed My Overall Assessment”
https://www.unz.com/mwhitney/scott-ritters-switcheroo-why-i-radically-changed-my-overall-assessment/
Ritter: “The military aid the west is providing to Ukraine is changing the dynamic and if Russia doesn’t find a way to address this meaningfully… the conflict will never end.”
That’s quite a turnaround from a statement he made just weeks earlier that, “Russia is winning the war, and winning it decisively.”
Scott Ritter is gradually adjusting to the idea that the conflict in Ukraine is not a just regional skirmish between two quarrelsome neighbors, nor is it a proxy-war between NATO and Russia. No. Ukraine is the first phase of a broader plan for crushing Russia, collapsing its economy, removing its leaders, seizing its natural resources, splintering its territory, and projecting US power across Central Asia to the Pacific Rim. Ukraine is about hegemony, empire, and pure, unalloyed power. Most important, Ukraine is the first battle in a Third World War, a war that was concocted and launched by Washington to ensure another unchallenged century of American primacy.
Interesting but imho third world war sounds too farfetched. The only thing clear to me is that the speed, scale and scope of retaliation from the anti-Russian side is quite baffling and unprecedented. Like an extreme allergic reaction to a highly specific allergen.
China Insists Party Elites Shed Overseas Assets, Eyeing Western Sanctions on Russia
https://www.wsj.com/articles/china-insists-party-elites-shed-overseas-assets-eyeing-western-sanctions-on-russia-11652956787
Bullwhip Effect Ends With A Bang: Why Prices Are About To Fall Off A Cliff
https://www.zerohedge.com/markets/bullwhip-effect-ends-bang-why-prices-are-about-fall-cliff
“we have entered the terminal phase of the “bullwhip effect”, where plunging inventory-to-sales ratios reverse violently higher, where supply chains unclog suddenly and rapidly amid a sudden chill in the economy, and where prices for so-called “core” goods collapse almost overnight, even as non-core prices (food and energy) explode even higher.”
A good article. Worth exploring further.
CBOE Equity Put/Call Ratio $CPCE for example, large drop followed by a large increase in puts such as today 05/24/22 (+19.8%) is usually bearish. We last saw this on 4/5/22, 9/28/21 for example and there are several from March 2020 pandemic sell off. There are rare exception such as 10/30/20 where the day closed at 30 day low in SPX and 30 high in $CPCE, then it ended up very bullish.
Those who are bullish will not like to hear this. Two measures of volatility are likely to increase from here (and lead to lower SPX prices).
The $VIX / $VIXX ratio is increasing, the highest since 05/06/2020.
The up component of volatility of $CPCE is increasing and approaching recent highs quickly and when it does, the put call ratio can spike and SPX price drops. This up volatility has not reached anywhere near the March 2020 pandemic level and can easily go much higher even compared to 2018 correction levels.
So to answer the question of whether the markets are technically washed out enough, the answer is probably no.
https://ibi.sandisk.com/action/share/5782a35f-d812-498e-939e-9d119854c477
Another shake down. Now turning green for the day.
Looks like the market is consolidating before the Fed Minutes may give us a more significant directional move.
to Jan: I have the same feeling. But pay attention for the fake move after FED. If you are from Czechia / Slovakia – Zdravím Honzu!
Traders are likely to fade this morning’s rally. Which may be a mistake. Max pain would be a further gap up following the Fed minutes.
Pray for this outcome.