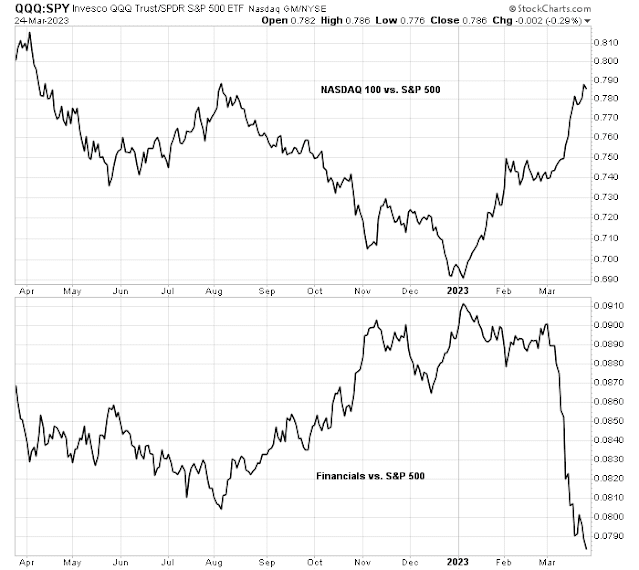
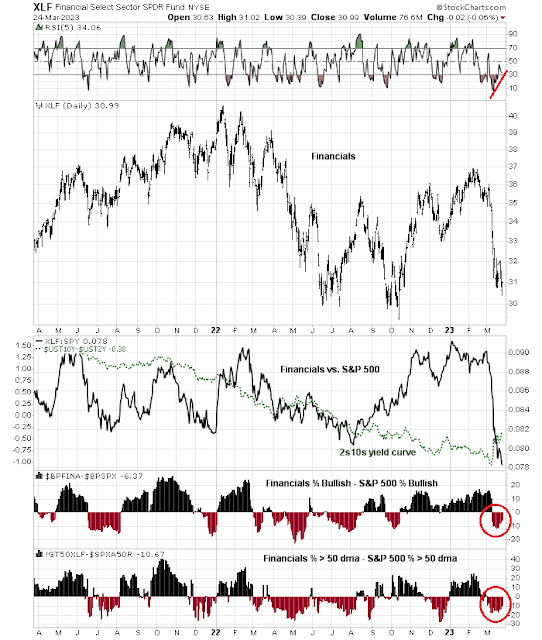
How far can this rally run?

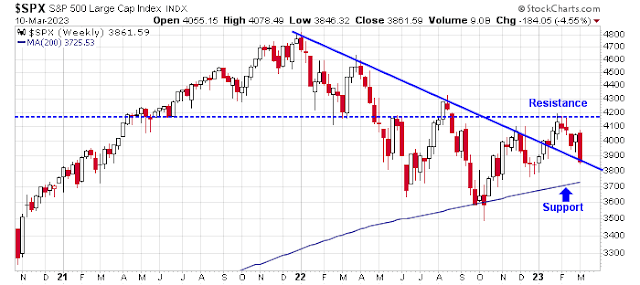
Mid-week market update: How far and long can this rally run? Here is one way of determining upside potential. The S&P 500 staged an upside breakout through an inverse head and shoulders pattern, with a measured objective of about 4120, which is the approximate level of the 200 dma.


The inverse head and shoulders breakout is even more evident using the Russell 2000, which staged an upside breakout through its 50 dma.


The bull case

Here are some reasons why that this rally has a lot further to run. The NYSE McClellan Summation Index (NYSI) just recycled from an extreme condition of below -1000, which has always sparked a relief rally in the past. As well, rallies usually haven’t stalled until returned to the zero neutral line. The only exception occurred in July 2008, when the rally petered out with NYSI at -200.


The S&P 500 has been inversely correlated to the USD for all of this year. The USD Index has been weakening and just violated a minor rising trend line, though the longer term uptrend remains intact. At a minimum, this argues for a period of consolidation for the USD and therefore stock prices instead of a stock market decline back to test the old lows.


What to watch

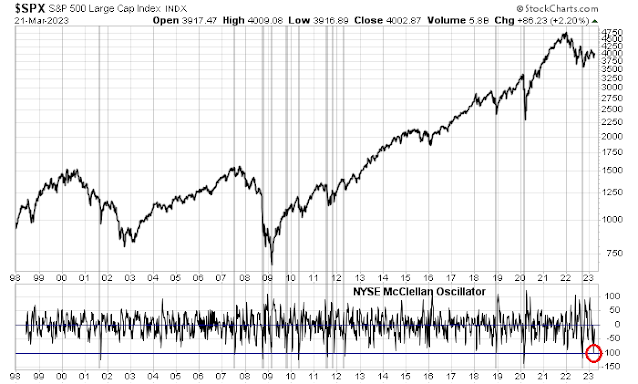
It’s always more difficult to call tops than bottoms, but here are some other signposts that I am watching from a short-term tactical viewpoint. The NYSE McClellan Oscillator (NYMO) reached an overbought condition yesterday. The last two bear market rallies of 2022 saw NYMO trace out negative divergences before finally topping, and tops were accompanied by either near-overbought or overbought conditions on the 14-day RSI. We’re quite there yet.


The three to one-month term structure of the VIX is upward-sloping, but the one-month to nine-day term structure is inverted. As more and more option players have migrated to short-term options, the shorter-term structure is still indicative of fear, which is contrarian bullish.


The two bear market rallies of 2022 saw the 10 dma of the equity put/call ratio fall below the 200 dma. While readings are close, the cautionary signal hasn’t been triggered yet.


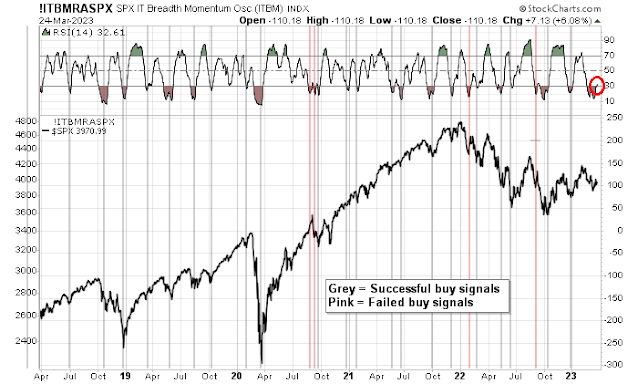
That said, ITBM flashed a well-time buy signal last week, by its 14-day is nearing an overbought condition, which would be a warning that the rally could stall at any time.


Stay tuned. In addition to the volatility induced by earnings season, investors will have to look forward to the uncertainty of the FOMC meeting next week.


Disclosure: Long SPXL


Five constructive signs of a short-term bottom

Preface: Explaining our market timing models 

We maintain several market timing models, each with differing time horizons. The “Ultimate Market Timing Model” is a long-term market timing model based on the research outlined in our post, Building the ultimate market timing model. This model tends to generate only a handful of signals each decade.


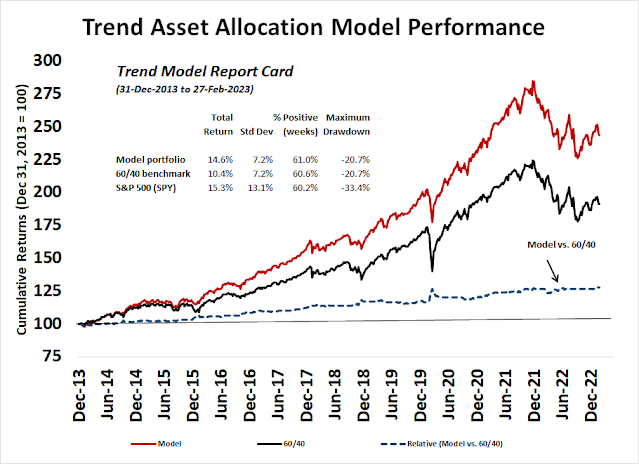
The Trend Asset Allocation Model is an asset allocation model that applies trend-following principles based on the inputs of global stock and commodity prices. This model has a shorter time horizon and tends to turn over about 4-6 times a year. The performance and full details of a model portfolio based on the out-of-sample signals of the Trend Model can be found here.


My inner trader uses a trading model, which is a blend of price momentum (is the Trend Model becoming more bullish, or bearish?) and overbought/oversold extremes (don’t buy if the trend is overbought, and vice versa). Subscribers receive real-time alerts of model changes, and a hypothetical trading record of the email alerts is updated weekly here. The hypothetical trading record of the trading model of the real-time alerts that began in March 2016 is shown below.


The latest signals of each model are as follows:
  • Ultimate market timing model: Sell equities
  • Trend Model signal: Neutral
  • Trading model: Bullish

Update schedule: I generally update model readings on my site on weekends and tweet mid-week observations at @humblestudent. Subscribers receive real-time alerts of trading model changes, and a hypothetical trading record of those email alerts is shown here.
 

Subscribers can access the latest signal in real-time here.


Testing support

As the S&P 500 tests a key support level just above its 200-week moving average and while exhibiting a series of positive RSI divergences, I am seeing five constructive signs that the market may be forming a short-term bottom.


Supportive breadth

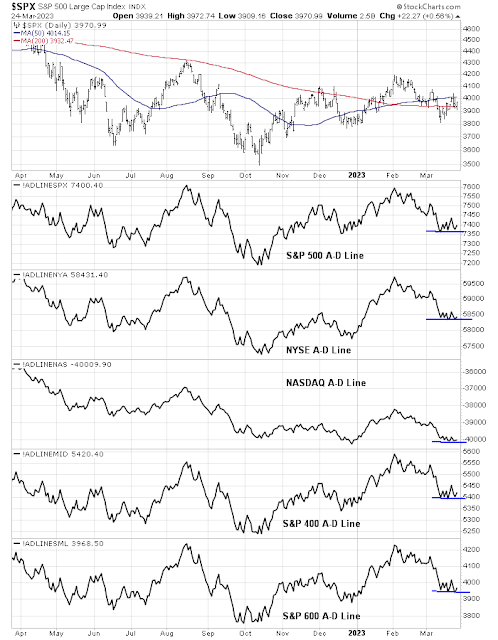
The first is better underlying breadth. Even when the S&P 500 struggled at a key support level, the mid- and small-cap S&P 400 and Russell 2000 held support in more solid manners.


A momentum rebound

Friday’s strong gains on high volume qualified as a Follow-Through Day, as specified by William O’Neil, which is a sign of strong price momentum.
A follow-through day occurs during a market correction when a major index closes significantly higher than the previous day, and in greater volume. It happens Day 4 or later of an attempted rally. Leading up to a follow-through day, an attempted rally takes place during a downtrend when a major index closes with a gain. The rally attempt continues intact as long as the index doesn’t make a new low.


Follow-through day variables include: an index closing sufficiently above 1% on increased volume, positive behavior of leading stocks, and improved market action regarding support vs. resistance levels. The most powerful follow-through days often happen Day 4 through Day 7 of an attempted rally.


From a longer term perspective, the 10 dma of the NYSE McClellan Oscillator recycled from an extreme oversold level, indicating price momentum turnarounds. There have been eight instances of this signal since 1998. All of them coincided with strong short-term market rebounds.


Signs of a cyclical bottom

As the global economy weakens, a recession call has become the consensus view. Ned Davis Research’s global recession model shows a 98% chance of a global recession. 


Similarly, the BoA Global Fund Manager Survey shows that economic weakness has become the overwhelming consensus.


In light of this bearish macro backdrop, expectations for Q3 earnings season have been diminished. While it’s still early, the EPS beat rate is below average while the sales beat rate is above average. In short, the preliminary verdict on Q3 earnings season is better than some of the dire expectations when the reporting period began.


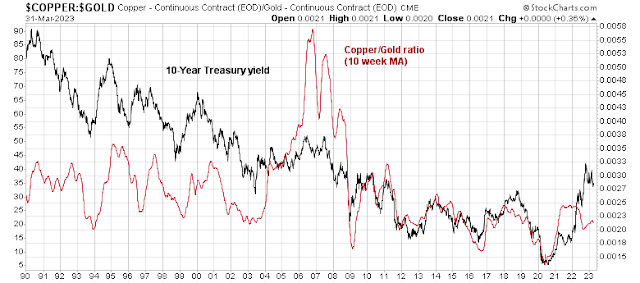
The cyclically sensitive copper/gold and base metals/gold ratios have been flat to up since July, which is also inconsistent with the expectation of global weakness.


Europe FIFO

I speculated in late August about the spillover effects of European weakness (see Will Europe drag us into a global recession?). At the time, the EU was beset by high energy prices because of the Russo-Ukraine war and fears of de-industrialization loomed. Even today, the BoA Global Fund Manager Survey shows that the Eurozone is the second lowest regional underweight behind the UK.


At the time, I set out two bullish tripwires based on the first-in-first-out principle. Europe was the first to enter a recession, and if signs emerged that it was beginning to emerge out of a slowdown, that would be a positive sign for risk appetite. Both of those tripwires have been triggered.


The first was the BASF and Dow Chemical pair trade. Both companies are giant chemical companies whose stock prices had historically tracked each other closely. BASF dramatically lagged against Dow when the war began, but now it has staged a relative breakout out of a base.


In addition, MSCI Poland has staged a relative breakout out of a downtrend against the MSCI All-Country World Index (ACWI), with both vehicles measured in USD terms. I interpret this to mean that geopolitical risk is fading in Europe.


First in, first out. These are the signs of green shoots of global risk appetite.


Sentiment still washed out

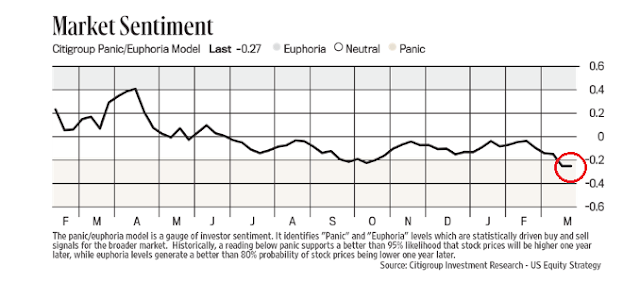
Lastly, sentiment models are still washed out, which is contrarian bullish. Investors Intelligence sentiment is showing more bears than bulls, which is an unusual and excessively bearish condition.


The latest AAII weekly survey still shows far too many bears. Both the bull-bear spread and bearish percentage are consistent with major market bottoms. While stock prices can weaken further from these sentiment levels, bearish investors would have to be betting on a major financial crisis like the Lehman Crisis in order to realize more downside.


In conclusion, a combination of factors, namely positive breadth, improving price momentum, signs of cyclical strength, European turnaround, and excessively bullish sentiment, are serving to signal a possible tactical bottom and put a floor on stock prices. 


However, investors should recognize that the current environment has been dominated by a single macro trade, the inverse correlation of the S&P 500 with the USD, which is a two-edged sword. Should interest rate expectations rise further to boost the dollar, it would represent a significant headwind for stock prices. On the other hand, now that Fed speakers are in a blackout period ahead of the November FOMC meeting and the last comments were less hawkish than expectations, the price momentum of that commentary has the potential to spark a risk-on stampede without interruption or contradiction from Fed officials.


Disclosure: Long SPXL


How inflation is a game changer for portfolios

In light of the dismal performance in the first nine months of a 60/40 portfolio in 2022, it’s time to ask, “What’s changed and what adjustments should investors make to their portfolios?”


The answer is inflation, and it’s a game changer. The correlation between stocks and bond increasingly rise as inflation rises. In a low-inflation environment, the correlation is slightly negative, indicating moderate diversification effects. In a high-inflation environment, stock and bond returns becomes correlated, which was demonstrated in the bear market of 2022.


The inflation picture

The global inflation picture looks dire. Inflation rates are surging all around the world/


In response, central banks around the world have raced to hike interest rates and raised the risk of a global recession.


While the current inflation acceleration is cyclical in nature, the long-term secular trend is worrisome. A BIS study found a link between age demographics and inflation: “A larger share of young and old in the population is associated with higher inflation.”


As the population of advanced economies ages, inflation pressures from demographics will present a challenge for policy makers in the coming decades.


The Fed’s response

Notwithstanding the long-term problems of inflation, the Fed has made it clear that bringing inflation back to its 2% target is its primary focus. The September Summary of Economic Projections (SEP) is a succinct outline of its economic projections and expected policy response.


The changes in projections from the June SEP to September SEP highlight the broad outline of the Fed’s thinking:
  • Recession ahead: 2022 GDP growth was dramatically downgraded from 1.7% to 0.2%, but it’s projected to bounce back to 1.2% in 2023. Reading between the lines, that projection doesn’t sound plausible at unemployment is projected to rise in 2023 and so are interest rates. In other words, the Fed is expecting a recession, but it’s published a soft landing scenario for political reasons.
  • Decelerating inflation: Core PCE inflation is projected to peak in 2022 at 4.5% and decelerate to 3.1% in 2023 and 2.3% in 2024, which is near the Fed’s 2% target.
  • A rates plateau: The median Fed Funds rate ends 2022 at 4.4%, plateaus in 2023 at 4.6%, and gradually falls afterward.


Reuters reported that the theme of frontloading rate hikes is consistent with what was voiced by St. Louis Fed President James Bullard:

A “hotter-than-expected” September inflation report doesn’t necessarily mean the Federal Reserve needs to raise interest rates higher than officials projected at their most recent policy meeting, St. Louis Fed President James Bullard said on Friday, though it does warrant continued “frontloading” through larger hikes of three-quarters of a percentage point…


After delivering a fourth straight 75-basis-point hike at its policy meeting next month, Bullard said “if it was today, I’d go ahead with” a hike of the same magnitude in December, though he added it was “too early to prejudge” what to do at that final meeting of the year.


If the Fed follows through with two more 75-basis-point hikes this year, its policy rate would end 2022 in a range of 4.50%-4.75%.
San Francisco Fed President Mary Daly said Friday, just ahead of the media blackout ahead of the FOMC meeting, that she wants to avoid putting the economy into an unforced downturn by overtightening, “I want to make sure we don’t overtighten just much as I want to make sure we don’t undertighten.” She added that the SEP Fed Funds rate forecast, which amounted to a 75 bps hike in November and followed by 50 bps in December, was a “good projection” and argued for rate hikes to slow to a 50 or 25 bps pace after the November meeting.


Current market expectations calls for a terminal rate of under 5% in 2023, with easing to begin late in the year. This is consistent with the Fed’s stated course that it will pause but not ease prematurely because of the fears of a policy error that ignites a 1970’s style inflationary spiral.


Good news on inflation

Despite all of the angst about broadening inflation dynamics, an analysis of the underlying trend indicates that inflation is peaking and will decelerate in the near future.


A disaggregation of PCE inflation trends shows that the inflation shock is mainly attributable to COVID-19 and the Russo-Ukraine War. Moreover, much of the supply-driven inflation is starting to diminish and roll over.


As for the hot September CPI report that came in ahead of expectations and rattled markets, the overshoot can be attributable to Owners’ Equivalent Rent (OER), which is a large weight in CPI. An analysis of core CPI ex-OER shows a clear trend of deceleration.


OER is a lagging indicator, which is a problem for Fed policy makers. Paul Krugman pointed out that an analysis from Goldman Sachs found that average alternative metrics of rental rates show that rents are rising at about 3% and decelerating, compared to the accelerating September BLS OER rate of 6.8%.


Jason Furman substituted Zillow’s new rent data into core CPI and found a similar trend of deceleration, though the alternative core CPI measure shows greater volatility.


As for the Fed’s fears of a 1970’s style wage-price spiral, relax. Wage increases are starting to top out. While job switchers are enjoying better raises than job stayers, which is an indication of a tight labor market, the rate of increase for both switchers and stayers is rolling over.


Moreover, an IMF study concluded that wage-price spirals are rare.


None of this means that the Fed should pivot from tightening to easing, but it does mean that inflationary pressures are starting to ease and an interest rate pause should be closer than the market expects. I would argue that the Fed is fighting the wrong war by targeting wage inflation. The main enemy during the inflationary 1970’s was the enormous power they wielded by unions and the Fed was correct in breaking the wage-price spiral then. The policy problem today should be the ability of companies to raise their prices in response to inflationary pressures. Pretax margins fell during the 1970’s when inflation rose. Today, margins are rising in lockstep with inflation as corporations have been able to pass through price increases.


It’s become all one trade

Here is what all this means for investors. The intense market focus on Fed policy has translated into a single one-factor Fed policy factor trade.


The Fed’s balance sheet (blue line) is inversely correlated to real 10-year Treasury yields (red line).


The Fed’s balance sheet (blue line) is also inversely correlated to the trade-weighted dollar (red line, inverted scale) as Fed tightening has driven up the USD and exported inflation abroad. 


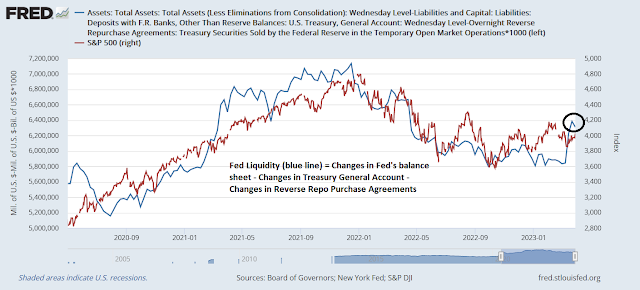
Finally, the S&P 500 (red line) is highly correlated to the Fed’s balance sheet (blue line). By extension, it has become all the same factor trade – liquidity, real yields, the USD, and stock prices.


Here is a chart of the USD Index since 1980 along with its 20-month Bollinger Band and the S&P 500. Past overbought episodes of the USD have occurred during periods of positive correlation with the S&P 500. The current period is highly unusual inasmuch as it is occurring during a period of S&P 500 weakness for the reasons already cited. The greenback is very extended and fault lines are appearing around the world. Japan and China have intervened to stabilize their currencies, and the UK has experienced funding stress. Either an inflation or crisis driven pivot should occur in the near future.


Investment implications

I began this publication by rhetorically asking the question of how investors should adjust their portfolios in response to high inflation. The analysis from JPM Asset Management outlines how asset classes perform in different inflation environments.


Jim Paulson at Leuthold Group further analyzed the S&P 500 during rising and falling inflation under high, medium, and low inflation regimes. If my analysis of decelerating inflation is correct, the S&P 500 is about to undergo a period of strong returns in the coming months.


In conclusion, rising inflation has played havoc with 60/40 portfolios as bond prices haven’t provided a counterweight to falling stock prices. A study reveals that underlying inflation trends are decelerating. which should be positive to risk appetite expectations. The inflation and market pivot is just around the corner and it may be closer than the market expects.


Liftoff?

Mid-week market update: Recent discussions with readers made me realize that many investors may have become so numb to the endless bearish stock market impulses that they don’t realize how oversold the stock market is. I have highlighted in the past the chart of the NYSE McClellan Summation Index (NYSI) to demonstrate that a reading of under -1000 is rare and historically led to tactical rebounds.


But that’s not the full story. Here is the NASI, which is the NASDAQ version of NYSI. Readings of -1000 are a bit more frequent, but they have led to tactical rebounds with the single exception of the episode in late 2000.


The S&P 500 weekly Williams %R, which is another overbought/oversold oscillator, recently recycled from a deeply oversold reading of -100. While this indicator has shown itself to be an inexact trading signal, it also signaled a deeply oversold condition that has usually resolved in tactical rebounds.


The 5 dma of the percentage of the S&P 500 with bullish patterns on point and figure charts recently fell below 15% before recovering. While historically these signals were slightly early, they have nevertheless indicated a positive risk/reward ratio for bullish positions in the past.


The percentage of NASDAQ stocks above their 200 dma fell below 10% and recovered. These are all signs of a deeply oversold market by any historical measure.


The percentage of S&P 500 stocks above their 50 dma experienced a breadth wipeout in June by falling below the 5% level but recovered to over 90% in a brief period. In the past, such breadth thrusts have always signaled the start of a fresh bull leg – except that the latest buy signal failed and the indicator retreated below 5%. The closest template of current conditions may be the 2008-2009 period. While this indicator did not fail by flashing a buy signal and weaken during that period, it did flash a positive divergence by exhibiting a higher low. So did the percentage of the S&P 500 above their 20 dma. I interpret this to be a constructive sign for the bulls.


Bearish sentiment

Sentiment models have also been very bearish, which is contrarian bullish. The latest BoA Global Fund Manager Survey shows that respondents are extremely overweight cash and underweight equities. Fund managers have built the highest cash levels since April 2001.


The New York Post featured the losses in the average 401k account this year as a contrarian newspaper cover indicator.


Futures positioning is very short financial assets.


The lack of risk appetite is confirmed by Goldman Sachs prime brokerage, which reported net equity positioning at fresh lows.


The bullish catalyst

The market just needed a catalyst for a risk-on liftoff. From a technical perspective, the usually reliable S&P 500 Intermediate-Term Breadth Momentum Oscillator (ITBM) just flashed a buy signal when its 14-day RSI recycled from an oversold condition to neutral. There have been 26 such signals in the last five years and 22 have resolved bullishly. The current buy signal is reminiscent of the September 2021 period when the RSI indicator weakened from neutral back to oversold soon after the buy signal. The final buy signal eventually succeeded and the index rallied about 10% on a trough-to-peak basis, which would come to about 3940 on the S&P 500.


From a fundamental and macro perspective, the bullish catalyst could be attributable to two possible factors. The most obvious is the British government’s about-face on its fiscal plan, which sparked a relief rally in the gilt market and Sterling. 


Less noticed but equally important is the prospect of better liquidity in the Treasury market. In the wake of concerns expressed by Treasury Secretary Janet Yellen about diminished Treasury market liquidity, Reuters reported that the US Treasury asked banks if it should buy back Treasuries to improve UST market liquidity. Joseph Wang, otherwise known as the Fed Guy, explains:
Treasury buybacks would be a powerful tool that could ease potential disruptions arising from quantitative tightening. The Treasury hinted in their latest refunding minutes of potential buybacks, which is when Treasury issues new debt to repurchase old debt. Buybacks can be used to boost Treasury market liquidity, but more importantly also allow Treasury to rapidly modify its debt profile. By issuing bills to purchase coupons, Treasury could strengthen the market in the face of rising issuance and potentially structural inflation. An increase in bill issuance would also facilitate a smooth QT by moving liquidity out of the RRP and into the banking sector.
Better UST liquidity would be a step to offset the bearish factors posed by the Fed’s QT program.


Key risks

Investors face a number of key risks to any risk-on rally.
  • Fed hawkishness: Jenna Smialek of the NY Times report that a pause is not on the Fed’s current trajectory and a 75 bps hike is baked-in at the November meeting. However, this degree of hawkishness has already been discounted by the market. The real question, which no one can answer, is the terminal rate and how long the Fed intends to hold rates at that level.
Federal Reserve officials have coalesced around a plan to raise interest rates by three-quarters of a point next month as policymakers grow alarmed by the staying power of rapid price increases — and increasingly worried that inflation is now feeding on itself.


Such concerns could also prompt the Fed to raise rates at least slightly higher next year than previously forecast as officials face two huge choices at their coming meetings: when to slow rapid rate increases and when to stop them altogether.
  • The uncertainties posed by Q3 earnings season: Despite widespread concerns about earnings deterioration, earnings report risks are symmetrical. Indeed, Bianco Research’s corporate guidance index, which measures the rate of positive to negative earnings guidance, is positive for Q3.


  • Financial instability in Japan: The USD wrecking ball is wreaking havoc in Japan. The 10-year JGB is edging above the BOJ’s 25 bps yield curve control mark, and the JPY is weakening to new post-1990 lows. 


  • Geopolitical risk: China recently advised its citizens to leave Ukraine. Other countries that recently either closed their embassies or urged their citizens to evacuate from Ukraine include Belarus, Kazakhstan, Kyrgyzstan, Serbia, Tajikistan, Turkmenistan, and Uzbekistan. All these countries are either Russian allies, or closely aligned with Russia. Do these countries know something the rest of the world don’t know?
  • Chinese retaliation in the semiconductor war: The Biden White House recently imposed a set of semiconductor export controls on China that are expected to hobble China’s science and technology ambitions. For a detailed explanation, listen to this podcast with Kevin Wolf, former Assistant Secretary of Commerce for Export Administration. While the announcement has cratered semiconductor stocks, Beijing hasn’t announced retaliation measures and it’s unclear how wide-ranging or the magnitude of the retaliation will be.


In conclusion, these violent market swings tend to be bear market characteristics and my base case scenario for this latest advance is a bear market rally. 


How far can the rally run? Assuming that this is a sustained bear market rally and not a two-day wonder, a 10% rebound would take the S&P 500 to about 3940, while the first Fibonacci retracement level is about 3990. The rally will encounter strong resistance at about 4140, which is the intersection of the falling trend line and the 50% retracement level.


Disclosure: Long SPXL


How bears turn into bulls

Preface: Explaining our market timing models 

We maintain several market timing models, each with differing time horizons. The “Ultimate Market Timing Model” is a long-term market timing model based on the research outlined in our post, Building the ultimate market timing model. This model tends to generate only a handful of signals each decade.


The Trend Asset Allocation Model is an asset allocation model that applies trend-following principles based on the inputs of global stock and commodity prices. This model has a shorter time horizon and tends to turn over about 4-6 times a year. The performance and full details of a model portfolio based on the out-of-sample signals of the Trend Model can be found here.


My inner trader uses a trading model, which is a blend of price momentum (is the Trend Model becoming more bullish, or bearish?) and overbought/oversold extremes (don’t buy if the trend is overbought, and vice versa). Subscribers receive real-time alerts of model changes, and a hypothetical trading record of the email alerts is updated weekly here. The hypothetical trading record of the trading model of the real-time alerts that began in March 2016 is shown below.


The latest signals of each model are as follows:
  • Ultimate market timing model: Sell equities
  • Trend Model signal: Neutral
  • Trading model: Bullish

Update schedule: I generally update model readings on my site on weekends and tweet mid-week observations at @humblestudent. Subscribers receive real-time alerts of trading model changes, and a hypothetical trading record of those email alerts is shown here.
 

Subscribers can access the latest signal in real-time here.


A failed reversal

Last week, I highlighted a possible bullish reversal candlestick on the weekly chart, but warned that the reversal needs to be confirmed by the next candle. This week, the S&P 500 weakened and failed to confirm the reversal candle, though the market is still exhibiting a positive 5-week RSI divergence and it is still testing support at the 200 week moving average. 


Regardless, I am seeing helpful signs of leadership rotation. During bear markets, the old market leaders fade and new leadership emerges to lead the new bull cycle. The change in leadership is a constructive market internal that is indicative of a bottoming process.


Ready to rally

Sentiment readings indicate that the market is washed out and poised to rally. The Investors Intelligence bull-bear spread had fallen to levels last seen during the GFC.


The TD-Ameritrade Investors Movement Index, which measures the positioning of that firm’s customers, fell to historically low levels, which is contrarian bullish.


The NDR Crowd Sentiment Poll has fallen to levels last seen at the 2008 low, which should put a floor on stock prices. The market just needs a catalyst to begin an advance.


A change in leadership

The US equity market has seen a definite shift in leadership. Changes in market leadership can be a sign that a bear market is turning into a fresh bull. As the old bull and old leaders falter, new blood and new leaders take up the baton. Large-cap growth FANG+ names, which had been the leaders since before the onset of the COVID pandemic, have seen their relative strength completely roll over.


A more detailed analysis of the relative performance of the three major growth sectors shows that they are all struggling.


Tactically, FANG+ prices may be experiencing headwinds because of SNB selling. Detailed disclosures of changes in the SNB balance sheet shows that most of the equity sales are concentrated in large-cap US growth stocks.


By contrast, the relative performance of cyclical value sectors are more positive.


A detailed relative performance analysis of selected cyclical industries shows:
  • A relative breakout by infrastructure stocks;
  • Broker-dealers have been in a relative uptrend since early July, though the group hasn’t achieved a relative breakout yet;
  • Homebuilding stocks, which should be in the gutter with the tanking housing market, is in a relative uptrend;
  • Retailers are forming a saucer-shaped relative bottom;
  • The laggards are transportation and semiconductor stocks.


Valuation support

It’s possible that the market has seen the lows for the cycle. The S&P 500 is trading at a forward P/E of 15.4, but the forward P/E is about 12 on an ex-FAAMG basis, which is arguably cheap by historical standards.


An ex-FAAMG forward P/E of 12 is in the vicinity of mid- and small-cap P/E ratios.


Indeed, the small-cap Russell 2000 and S&P 600 have been strengthening against the S&P 500 since May in an uneven manner and attempting a relative breakout.


Bear market rally ahead

My base case scenario calls for a bear market rally for several reasons. The market has been extremely oversold, as measured by the NYSE McClellan Summation Index. Past readings of under -1000 have seen stock prices rally, even in the bear markets of 2002 and 2008.


However, the rotation from growth to value isn’t entirely convincing. While large-cap value has turned up against large-cap growth, mid- and small-cap value and growth aren’t confirming the rebound.


In conclusion, the stock market is poised to undergo a bear market rally.  Sentiment and technical conditions continue to be supportive of a short-term bottom. Beneath the hood, the market is undergoing a change in market leadership, which can be indicative of a long-term bottom process as the old leaders falter and the new leaders take up the baton.


Disclosure: Long SPXL


Why the pivot may be closer than you think

Richard Nixon’s Treasury Secretary John Connally famously said in 1971, “The dollar is our currency, but it is your problem”. Nixon’s actions at the time closed the gold window, imposed a number of tariffs, and drove the USD down in the aftermath of the collapse of the Bretton Woods Agreement of fixed exchange rates.
 

Fast forward to 2022, and the situation is different. The Federal Reserve is one of the most hawkish of advanced economy central banks, and its interest rate policy. The Fed’s actions are exporting disinflation abroad and forcing major trading partners to engage in a series of competitive tightening to defend their own currencies. 


While US financial conditions are still relatively stable, financial cracks are appearing abroad and USD strength has become a wrecking ball wreaking havoc around the world. In spite of the hot September CPI print, the Fed’s pivot may be closer than the market expects.


A global wrecking ball

Let’s begin with the good news. A strong USD (orange line, inverted scale) is disinflationary. Historically, USD strength leads global inflation by eight months.


Here is the bad news, financial stress has been correlated with USD strength. The Chicago Fed National Financial Conditions Index (black line) is just under zero today. In the past, strength in this index, which indicates stress, has preceded recessions. While most recessions have seen this index turn positive, it did peak at just below zero during the late 1990s.


The Chicago Fed National Financial Conditions Index just covers the US, whose conditions are relatively tame. The IMF’s newly published Global Financial Stability Report found higher stress levels in the Euro area and emerging market countries ex-China.


Offshore USD liquidity is drying up, which can be seen in the cross-currency swap market. While levels are elevated, they are not at crisis levels yet. Liquidity problems are particularly concerning as Treasury Secretary Janet Yellen stated, “We are worried about a loss of adequate liquidity in the [Treasury] market”.


Self-inflicted wounds

Europeans central bankers appear to have a propensity for self-inflicted wounds. The BoE apparent indecision on whether to support the gilt market confused markets. Last Tuesday, BoE Governor Andrew Bailey told pension fund managers to finish rebalancing their positions by Friday when it will end its emergency support program to support the gilt market: “And my message to the funds involved and all the firms involved managing those funds: You’ve got three days left now. You’ve got to get this done.”


The gilt market was instantly thrown into turmoil until on Wednesday, the FT reported:
The Bank of England has signalled privately to bankers that it could extend its emergency bond-buying programme past Friday’s deadline, according to people briefed on the discussions, even as governor Andrew Bailey warned pension funds that they “have three days left” before the support ends.
A few hours later, the story changed to:
A sell-off in UK government bonds accelerated on Wednesday, sending long-term borrowing costs higher after the Bank of England reiterated its plans to halt its emergency gilt-buying scheme as scheduled on Friday. The central bank said on Wednesday morning that it “has made clear from the outset, its temporary and targeted purchases of gilts will end on 14 October”.
In addition, there is an accounting quirk at the BoE that makes its intervention vulnerable to a pro-cyclical factors. There are two sources of losses. The first will be losses on its asset purchases holdings (AFP) as the interest rate on bank reserves exceeds the coupon yield on the asset purchases. As well, the BoE will realize losses on its balance sheet in light of the Bank’s intention to sell gilts as part of its QT program. Unlike other central banks such as the Federal Reserve, which can record losses as deferred assets and amortize them over many years from the Fed’s monetary income and lower transfers to Treasury, the BoE directly bills HM Treasury for these losses immediately. These losses will force the UK government to sell gilts to finance these losses at a time when the budget is under severe pressure and raise political pressure on BoE leadership. 


An analysis by Chris Marsh estimates that this fiscal indemnity under differing scenarios will cost £20 to £30 billion per year for the next few years, which is an enormous burden for the government.
To put this indemnity in context, the abolition in the top rate of tax (of 45p) was projected to have an impact of about GBP2bn per year in the steady state. The BOE indemnity will be GBP20-30bn per year for the next two years and potentially much more later.


The primary deficit from the March 2022 OBR forecast was projected for 2022/23 at GBP27bn and for 2023/24 at GBP13bn.


The ECB tried to top the BoE for a self-inflicted wound on Thursday when Reuters reported that it is considering a change to its TLTRO program because it has become overly generous to banks.
European Central Bank policymakers are closing in on a deal to change rules governing trillions of euros worth of loans to banks in a move that will shave tens of billions of euros off in potential banking profits, sources close to the discussion said.


Euro zone banks sit on 2.1 trillion euros ($2.04 trillion) of cash handed out by the ECB at ultra-low, sometimes even negative interest rates, in the hopes that doing so would help kick-start the economy.


But after a string of unexpectedly quick and big rate hikes banks can now simply park this cash back at the ECB, earning a risk-free profit, irking policymakers who see it as gaming the system.

The intention of the policy change is to “hurt banks”.

“We are very close and a decision is going to come soon,” one of the sources, who asked not to be named, said on the sidelines of the International Monetary Fund and World Bank annual meetings in Washington. “The ultimate design is going to hurt banks, and that is very much our intention.”
Wait, what? Hurt a fragile banking system in an economy that’s in a recession? Instead, a desire to “hurt banks” will have the pro-cyclical effect of exacerbating the banking system’s downside risk. On the scale of policy errors, this has the potential to rival the BoE’s on-again, off-again statements of support for the gilt market.


In short, enormous stresses are appearing in European central banking. Rate hike cycles end abruptly when something breaks, and something may break soon in Europe.


Earnings stress

Back on Wall Street, the dollar wrecking ball could wreak havoc on earnings growth. Historically, a strong USD has been correlated with negative earnings growth. While the very early results from Q3 earnings season have been encouraging, earnings growth will face macro headwinds longer term. Watch for earnings calls that include the phrase “but on a constant currency basis, we…”.


The party line on Fed policy

Current Fed policy is hawkish and it will remain especially hawkish in light of the hot September CPI report. The September FOMC minutes reveals the key points of the Fed’s thinking.


Inflation is stubbornly high.

Participants observed that inflation remained unacceptably high and well above the Committee’s longer-run goal of 2 percent. Participants commented that recent inflation data generally had come in above expectations and that, correspondingly, inflation was declining more slowly than they had previously been anticipating.

Inflation risks are skewed to the upside.
Participants agreed that the uncertainty associated with their economic outlooks was high and that risks to their inflation outlook were weighted to the upside. Some participants noted rising labor tensions, a new round of global energy price increases, further disruptions in supply chains, and a larger-than-expected pass-through of wage increases into price increases as potential shocks that, if they materialized, could compound an already challenging inflation problem. A number of participants commented that a wage–price spiral had not yet developed but cited its possible emergence as a risk.
The good news is inflation expectations are well anchored, but the Fed is concerned that elevated inflation rates will boost inflation expectations.
In assessing inflation expectations, participants noted that longer-term expectations appeared to remain well anchored, as reflected in a broad range of surveys of households, businesses, and forecasters as well as measures obtained from financial markets. Participants remarked that the Committee’s affirmation of its strong commitment to its price-stability objective, together with its forceful policy actions, had likely helped keep longer-run inflation expectations anchored. Some stressed that a more prolonged period of elevated inflation would increase the risk of inflation expectations becoming unanchored, making it much more costly to bring inflation down.
Saying the quiet part out loud, monetary policy needs to deflate the jobs market to fight inflation.
Participants judged that a softening in the labor market would be needed to ease upward pressures on wages and prices. Participants expected that the transition toward a softer labor market would be accompanied by an increase in the unemployment rate. Several commented that they considered it likely that the transition would occur primarily through reduced job vacancies and slower job creation.


A Brainard pivot?

By contrast, Fed Vice Chair Lael Brainard may on leading the charge for caution in raising rates. Brainard is part of the powerful triumvirate at the Fed consisting of the Chair, Jerome Powell, the Vice Chair, and the President of the New York Fed, John Williams. Brainard had been on the Fed Board since 2014, and much of her work focused on global linkages and their effects on financial stability. In a speech she made entitled “Global Financial Stability Considerations for Monetary Policy in a High-Inflation Environment” on September 30, 2022, she focused on the international linkages of monetary policy and referred to the word “spillovers” nine different times.
We meet regularly not only with monetary policy officials from different countries, but also with fiscal and financial stability officials in a variety of international settings, which helps us to take into account cross-border spillovers and financial vulnerabilities in our respective forecasts, risk scenarios, and policy deliberations.
While the Fed’s north star is still its price stability mandate and bringing inflation back to its 2% target, she acknowledged that monetary policy works with a lag. At some point, it will be appropriate to proceed “deliberately and in a data-dependent manner”, otherwise known as a pause.
We also recognize that risks may become more two sided at some point. Uncertainty is currently high, and there are a range of estimates around the appropriate destination of the target range for the cycle. Proceeding deliberately and in a data-dependent manner will enable us to learn how economic activity and inflation are adjusting to the cumulative tightening and to update our assessments of the level of the policy rate that will need to be maintained for some time to bring inflation back to 2 percent.
Brainard made a separate speech, “Restoring Price Stability in an Uncertain Economic Environment”, on October 10, 2022 that was full of references to reasons why inflation is moderating but warned that monetary policy operates with lags.
We are starting to see the effects [of monetary tightening] in some areas, but it will take some time for the cumulative tightening to transmit throughout the economy and to bring inflation down.
She once again referred to the “combined effect of concurrent global tightening”, “spillovers”, and called for “moving forward deliberately and in a data-dependent manner” as a way of warning against over-tightening. In particular, she did not include the Fed party line about the risks of prematurely pulling back on tightening.


In the wake of the higher than expected CPI report, Fed Funds expectations have changed dramatically.
  • A 75 bps hike in November has become a virtual certainty.
  • The market now expects a 75 bps hike in December instead of 50 bps.
  • The terminal rate rose to 475-500 bps, up 25 bps.


Those expectations may be overly hawkish in light of Brainard’s remarks. In particular, there has been a lot of hand-wringing over the shelter component of CPI, which comprises 32% of headline CPI weight and 40% of core CPI. A BLS research paper found that the CPI rent index lags a full year behind rents paid by new tenants. Redfin reported that rent increases are decelerating rapidly, supporting concerns about the Fed’s focus on a lagging indicator which will lead it to over-tighten.


Further analysis of core CPI ex-Owners Equivalent Rent shows a clear trend of deceleration in this “core+ CPI”.


In conclusion, the Fed’s tight monetary policy is creating spillover effects all over the world by boosting the USD. The recent cover of Barron’s may be the contrarian magazine cover signal that the era of the USD wrecking ball is over. 


Market conditions may be on the verge of triggering a pause in the global hiking cycle. Possible contagions from uncertainties in the gilt market and euro area bonds, lack of liquidity in the onshore and offshore USD market will increase financial stability concerns for central bankers. A monetary policy pivot may be far closer than the market expects. 


Do divergences matter anymore?

Mid-week market update: The stock market has been exhibiting a series of positive breadth and momentum divergences as the S&P 500 weakened, but the recent main driver of risk appetite has been the fixed income and currency markets.
 

Do divergences matter anymore?


External drivers

The divergences matter less inasmuch as the stocks in the S&P 500 are all moving together, indicating that equities are being driven by either extreme emotion and external macro forces. In this case, the external drivers are mainly the bond and currency markets.


You’ve got three days

The market was thrown into turmoil yesterday when BoE Governor Andrew Bailey told pension fund managers to finish rebalancing their positions by Friday when the Banks ends its emergency support program for the country’s fragile bond market, “And my message to the funds involved and all the firms involved managing those funds: You’ve got three days left now. You’ve got to get this done.” The market was instantly thrown into turmoil, though the FT reported that the Bank walked back the sudden stop in BoE support, but left participants confused. The yield on the 10-year gilt surged to levels last seen during the GFC.


The MOVE Index, which measures the volatility of the Treasury market, has also surged to GFC levels, though the anxiety can largely be attributable to the Fed’s tightening trajectory.


Cross-asset signals

Even then, I am seeing a number of cross-asset signals that may be conducive to a better risk appetite. 


I have heard from some readers expressing concern about the breach of support by TLT, the long bond Treasury ETF, other ETFs representing the shorter end of the Treasury yield curve held support during the latest bond market downdraft, which may be a constructive sign for risk appetite.


The S&P 500 has been inversely correlated to oil prices and the USD. Oil prices have been flat even as stock prices fell, and the USD Index is exhibiting a slight positive divergence against the S&P 500, which is another positive sign for risk appetite.


Poised for a bear market rally

I interpret these conditions as the stock market is washed out and poised for a rally. The NYSE McClellan Summation Index (NYSI) has fallen below -1000. Stock prices have historically rebounded when NYSI reached these levels. Even during the bear markets of 2002 and 2008, the market rebounded before weakening again.


The VIX Index is nearing or reaching the minimum level of 34, which has signaled near-term bottoms in the past year.


As well, the term structure of the VIX is inverted, indicating widespread fear.


Analysis from SentimenTrader shows that the Fear & Greed Index exhibited a positive divergence. The last time this happened was the Christmas Eve Panic of 2018, and the market rallied hard afterwards.


You can tell a lot about market psychology by the way it responds to news. PPI came in hot this morning, and stock prices have been roughly flat on the day instead of tanking as they did after the NFP report, indicating that risk appetite is becoming numb to bad news. Much will depend on the CPI report tomorrow morning. 


The Cleveland Fed’s inflation nowcast is calling for a monthly headline CPI of 0.3% and core CPI of 0.5%, compared to consensus expectations of a headline of 0.2% and a core of 0.5%. 


Ahead of the CPI report, SPY option open interest is skewed very bearish, which may mean that we need a very hot CPI print for stock prices to tank. If the report comes in at or below expectations, it could spark a strong risk-on bounce tomorrow.


Disclosure: Long SPXL


Buy now, pain later

Preface: Explaining our market timing models 

We maintain several market timing models, each with differing time horizons. The “Ultimate Market Timing Model” is a long-term market timing model based on the research outlined in our post, Building the ultimate market timing model. This model tends to generate only a handful of signals each decade.


The Trend Asset Allocation Model is an asset allocation model that applies trend-following principles based on the inputs of global stock and commodity prices. This model has a shorter time horizon and tends to turn over about 4-6 times a year. The performance and full details of a model portfolio based on the out-of-sample signals of the Trend Model can be found here.


My inner trader uses a trading model, which is a blend of price momentum (is the Trend Model becoming more bullish, or bearish?) and overbought/oversold extremes (don’t buy if the trend is overbought, and vice versa). Subscribers receive real-time alerts of model changes, and a hypothetical trading record of the email alerts is updated weekly here. The hypothetical trading record of the trading model of the real-time alerts that began in March 2016 is shown below.


The latest signals of each model are as follows:
  • Ultimate market timing model: Sell equities
  • Trend Model signal: Neutral
  • Trading model: Bullish

Update schedule: I generally update model readings on my site on weekends and tweet mid-week observations at @humblestudent. Subscribers receive real-time alerts of trading model changes, and a hypothetical trading record of those email alerts is shown here.
 

Subscribers can access the latest signal in real-time here.


Still constructive

Last week, I outlined seven reasons why traders should grit their teeth and buy. I reiterate my short-term bullish and intermediate-term cautious view of the stock market. Traders should continue to buy now, but be prepared for pain later.


The S&P 500 rallied strongly early in the week but gave up most of its gains as time passed. Friday’s hot NFP report cratered stock prices and the index traced out a bearish island reversal, which is clearly visible on the hourly chart. The good news is the S&P 500 has nearly reached the measured downside target of its reversal pattern. In addition, the last hour was characterized by a morning star doji candle, which is a possible reversal pattern that needs to be confirmed by market strength Monday morning.


Reversal signals

Possible inverted hammer reversal candlestick patterns can also be seen in the NASDAQ Composite weekly chart and the S&P 500 weekly chart. The bullish backdrops are enhanced by the presence of positive RSI divergences. Both reversal setups will need to be confirmed by market strength next week.


The bullish rewards of a reversal could be considerable. Portfolio manager Steve Deppe found that the stock prices surged the following week when the S&P 500 closed over -4% off its weekly high each of the last four weeks (caution, n=3).


Reasons to buy

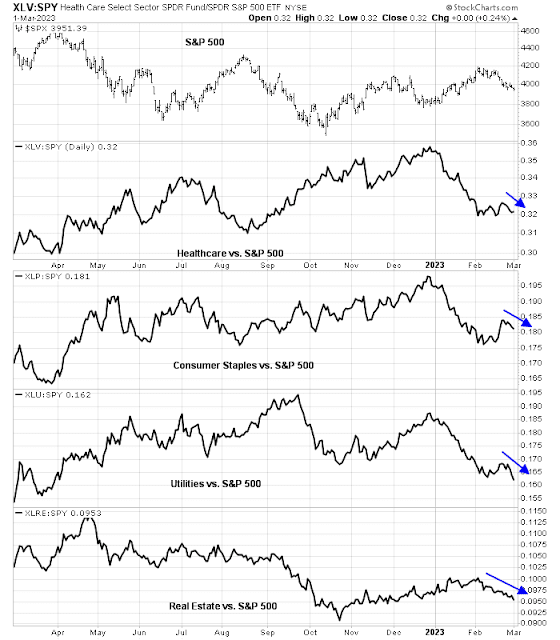
Notwithstanding the bullish results from silly small sample studies, technical conditions are supportive of the bull case. First, the relative performance of defensive sectors look dismal, except for Healthcare. Two out of four sectors are testing relative support and one, real estate, is breaking down relative to the S&P 500. It should also be noted that weak relative strength in defensive sectors began even before the stock market staged its rally.


Another positive signal comes from cross-asset analysis. Credit market risk appetite is perking up. Both the relative price performance of high-yield and leveraged loans compared to their duration-equivalent Treasuries is exhibiting positive divergences against the S&P 500.


Equity risk appetite indicators are bullish to neutral. The relative ratio of high beta to low volatility is showing a minor positive divergence, while the equal-weighted consumer discretionary to staples ratio is tracking the performance of the S&P 500.


Despite the surge in stock prices early in the week, the NYSE Summation Index (NYSI) oversold and very near an extreme condition. The market simply doesn’t crash with NYSI readings at these levels. At a minimum, this should put a floor on stock prices should the market weaken.


Bearish positioning

Positioning is at an extreme and supportive of high prices. Bloomberg reported that fund flows into the short ETF is a record, indicating that retail investors have piled in. A separate Bloomberg article revealed that fund flow reports show investors poured the most money into cash in the past week since April 2020.


Tactically, hedge funds are short and poised to cover. Charlie McElligott at Nomura observed that CTAs have begun to cover their equity shorts from a crowded short condition. Any catalyst that sparks gains in the market could start a melt-up stampede.


In addition, the 10 dma of the equity put/call ratio is at or near levels where the market has bottomed out in the last 10 years. Fear levels are nearing a crescendo.


Upbeat earnings season

As we approach Q3 earnings season, FactSet reported that the pace of positive guidance has improved sequentially from last quarter and negative guidance declined. Moreover, the number of companies giving positive guidance is above its 5-year average. The game of guiding lower to beat results for Q3 is done. We should see a decent series of positive earnings surprises in the coming weeks.


The theme of an upbeat Q3 is confirmed on a top-down basis by the Atlanta Fed’s GDPNow nowcast, which soared to 2.9% and shows no immediate signs of a recession.


Pain later

Despite the sunny near-term outlook, investors can expect some storm clouds on the horizon. Using the official definition of -20% from their highs as the definition of a bear market, about 40% of global markets are in bear markets. As Europe is almost certainly in recession, China is teetering on one, and the US is almost certainly going to see one in 2023, these readings are inconsistent with a durable bottom. Stocks have more work to do on the downside.


The recent risk appetite environment has mainly been driven by the bond market, as the stock market has really gone along for the ride. The MOVE Index, which measures the volatility of bonds, is exhibiting a significant divergence from the VIX Index. This bear market is unlikely to end until the two converge. Watch for the VIX to rise in the coming months.


In conclusion, I am constructive on the stock market for the next few weeks, perhaps as far as to year-end. These conditions are consistent with the pattern of positive seasonality that begins about now. However, investors need to be prepared for turbulence once any short-term rally peters out. This is a bear market, and don’t mistake a bear market rally for the start of a fresh bull.


Disclosure: Long SPXL


Why you should financial model the Yom Kippur War

The recent OPEC+ decision to cut oil output by 2 million barrels per day is giving me a case of PTSD from a Yom Kippur long ago. In October 1973, the stock market was just getting over a case of Nifty Fifty growth stock mania. Arab armies, led by Egypt and Syria, made a surprise attack on Israel on Yom Kippur and overwhelmed the surprised defenders. The Israelis eventually prevailed in the conflict with US help. Arab oil-exporting countries responded with an oil embargo that spiked energy prices and caused a deep recession. The stock market fell roughly -50% on a peak-to-trough basis before recovering.


Fast forward to 2022. Instead of the Nifty Fifty, we have the FANG+ mania, which may be show signs of fading. Instead of a Middle East war, we have the Russo-Ukraine war. Instead of an Arab Oil Embargo, Russia has weaponized energy, mostly against the EU. Despite much lobbying by Washington, this year’s Yom Kippur brought an OPEC+ surprise. The organization made a decision to cut oil output by 2 mbpd. While the cut isn’t as bad as it sounds because a number of OPEC members aren’t producing at capacity, the decision nevertheless shows that the US and Europe have no allies within OPEC. As a consequence, Street analysts are scrambling to raise their oil price forecasts, and higher energy prices are likely to put pressure on the Fed to stay hawkish.
 

Will investors see a repeat of the 1973-1974 bear market in 2022-2023?


Recession ahead?

James Hamilton has conducted extensive research on oil price spikes and concluded that they have historically preceded recessions (see Historical Oil Shocks). A separate 1997 paper by Ben Bernanke et al concluded that it wasn’t rising oil prices that caused recessions, but the central bank’s response to rising energy costs (see Systematic Monetary Policy and the Effects of Oil Price Shocks). 


Notwithstanding the pressure from higher energy prices, the cyclically sensitive housing sector is tanking and signaling a slowdown. As mortgage rates (red line, inverted scale) rise, it’s difficult to see how the US economy can avoid a recession, especially against a tight monetary policy backdrop.


The Lehman Crisis loophole

Once central banks undergo a hiking cycle, they usually don’t stop until they judge that inflation is under control. The only loophole to that rule is a threat to financial stability, in the manner of a Lehman Crisis.


Rumblings began a week ago out of a report from ABC Australia that a credible source indicated that an unnamed large investment bank was on the brink of failure. Speculation turned to Credit Suisse, whose credit default swap rates had spiked, but the CDS rates of other European financials were also under considerable stress. 


These circumstances turned to hope of a dovish pivot from the Fed. Already, three major central banks, the BOJ, the PBOC, and the BOE, have found it necessary to intervene in their bond markets. Hopes rose further when the RBA raised rates by 25 bps, which was less than the expected 50 bps, but dashed a day later when the RBNZ hiked by 50 bps and said it was considering raising rates even higher. Nevertheless, markets went risk-on last week in hopes that Credit Suisse could be the European Lehman Moment and force the Fed to pivot to a less hawkish policy?


There have been a flood of Fed speakers last week, and the message was clear. Don’t expect a dovish pivot. Fed Vice Chair Lael Brainard addressed the question of financial stability in a timely speech. She acknowledged how the Fed’s tight monetary policy may be affecting America’s trading partners [emphasis added]:
Tightening in financial conditions similarly spills over to financial conditions elsewhere, which amplifies the tightening effects. These spillovers across jurisdictions are present for decreases in the size of the central bank balance sheet as well as for increases in the policy rate. Some estimates suggest that the spillovers of monetary policy surprises between more tightly linked advanced economies such as the United States and Europe could be about half the size of the own-country effect when measured in terms of relative changes in local currency bond yields.
The Fed is “attentive to financial vulnerabilities” of other countries:
We are attentive to financial vulnerabilities that could be exacerbated by the advent of additional adverse shocks. For instance, in countries where sovereign or corporate debt levels are high, higher interest rates could increase debt-servicing burdens and concerns about debt sustainability, which could be exacerbated by currency depreciation. An increase in risk premiums could kick off deleveraging dynamics as financial intermediaries de-risk. And shallow liquidity in some markets could become an amplification channel in the event of further adverse shocks.
In the end, however, she pushed back against expectations of a dovish pivot by the Fed [emphasis added]:
In the modal outlook, monetary policy tightening to temper demand, in combination with improvements in supply, is expected to reduce demand–supply imbalances and reduce inflation over time…It will take time for the full effect of tighter financial conditions to work through different sectors and to bring inflation down. Monetary policy will need to be restrictive for some time to have confidence that inflation is moving back to target. For these reasons, we are committed to avoiding pulling back prematurely. We also recognize that risks may become more two sided at some point…Proceeding deliberately and in a data-dependent manner will enable us to learn how economic activity and inflation are adjusting to the cumulative tightening and to update our assessments of the level of the policy rate that will need to be maintained for some time to bring inflation back to 2 percent.
The WSJ reported that New York Fed President John Williams compared today’s inflation dynamics to an onion:
Mr. Williams compared inflation to an onion, with the prices of globally traded commodities such as lumber, steel, and oil, serving as the outer layer, and durable goods such as appliances, cars, and furniture serving as a middle layer. Declining commodities prices and improving supply chains should slow inflation for many goods, Mr. Williams said..


Underlying inflation pressures, or what Mr. Williams referred to as the innermost layer of the onion, have risen briskly and are unlikely to weaken without the Fed taking action to slow the economy with higher interest rates.


“Therein lies our biggest challenge…Inflation pressures have become broad based across a wide range of goods and services,” Mr. Williams said. “Demand for labor and services is far outstripping available supply. This is resulting in broad-based inflation, which will take longer to bring down.”
Fed Governor Christopher Waller repeated the mantra of staying on the hawkish path and pushing back on expectations of a dovish pivot.
So, as of today, I believe the stance of monetary policy is slightly restrictive, and we are starting to see some adjustment to excess demand in interest-sensitive sectors like housing. But more needs to be done to bring inflation down meaningfully and persistently. I anticipate additional rate hikes into early next year, and I will be watching the data carefully to decide the appropriate pace of tightening as we continue to move into more restrictive territory.


In considering what might happen to alter my expectations about the path of policy, I’ve read some speculation recently that financial stability concerns could possibly lead the FOMC to slow rate increases or halt them earlier than expected. Let me be clear that this is not something I’m considering or believe to be a very likely development.
Fed Governor Lisa Cook also stayed with the party line, “Inflation is too high, it must come down, and we will keep at it until the job is done.”


The September Jobs Report solidified market expectations of the Fed’s continued hawkish path. Headline NFP slightly beat expectations at 263,000 (250,000 expected). The unemployment rate unexpected fell from 3.7% to 3.5%, mainly because of a decline in the participation rate. However, average hourly earnings decelerated from 5.2% to 5.0%, indicating that wage pressures are under control. Market expectations of the trajectory of the Fed Funds rate were largely unchanged: A 75 bps hike at the November meeting, 50 bps hike at the December meeting, and a plateau of 450-475 bps in the Fed Funds rate in 2023.


In summary, the Fed’s is determined to “keep at it until the job is done”. That determination is evidenced by the unusual divergence between the nominal 5-year Treasury yield and 5-year breakeven rates.


There will be pain

What does this mean for equity investors? The stock market fell about -50% on a peak-to-trough basis during the 1972-1974 bear market. The combination of rising energy prices and a determined and hawkish Fed has the potential to spark a deep recession. I pointed out that an estimate of downside potential for the S&P 500 was a peak-to-trough drawdown of 30% to 50% (see The anatomy of a failed breadth thrust). This scenario would imply the lower end of the range, with S&P 500 downside potential in the 2500 zone, which is about the bottom of the 2018 Christmas Eve panic bottom and the bottom of the 2020 COVID Crash.


Despite the dire outlook, investors have to be aware of two potential bullish pivots on the horizon. The Fed’s hawkish policy is pushing up the value of the USD, which is wreaking havoc with other countries. Eventually, there will be sufficient pressure to weaken the greenback. At a minimum, a strong dollar weakens America’s terms of trade and becomes a headwind for US competitiveness, growth, and employment. The Plaza Accord experience is instructive for equity returns. Stock prices had been languishing for nearly two years until the Plaza Accord to weaken the USD and served as a catalyst for equity market strength.


The other possible pivot is a resolution of the Russo-Ukraine war, which would bring down energy prices. Such a development could be enormously bullish for operating margins as the price of energy inputs drop and serve to light a fire under the stock market. In light of the progress of Ukrainian forces on the battlefield, such an event may not be that farfetched or very far away.


In conclusion, there will be pain for investors. The combination of high energy prices and a determined hawkish Fed is equity bearish, but it may not be as bearish as the 1974 bear market. Investors have to be prepared for a sudden policy decision to weaken the USD, which would be bullish for stocks. As well, the possibility of an end to the Russo-Ukraine war could spark a rip-your-face-off stock market rally.


Managing fear and greed in a time of volatility

Mid-week market update: I received a number of questions from readers who were positioned for the monster rally that began on Monday, “What’s your upside target?”
 

The answer is, “It depends.” Make no mistake, the market was washed out and oversold when the rally began, but it was sparked by a rebound in bond prices. Much will depend on the interest rate outlook going forward.


Initial targets, by the numbers

Nevertheless, we can see an initial resistance zone on the S&P 500 hourly chart in the 3870-3900 area. After two sizable surges, it’s no surprise that the market took a breather today.


A point and figure analysis, using 30 minute S&P 500 data, 0.5% box size, and differing box reversals yields an upside target range of 3982 (2 box reversal) to 4166 (3 box reversal).


From a short-term technical perspective, I can conclude that the S&P 500 will encounter initial resistance at 3900, with further resistance at 4000-4100.


From a trading perspective, here are a couple of “take profit” tripwires to watch. Bounces off bottoms often fizzle out when the VIX Index recycles from above its Bollinger Band to the middle of the band, which hasn’t happened yet. As well, bear market rallies this year have all reached a minimum of a neutral reading on the % of S&P 500 stocks above their 20 dma, which was nearly achieved yesterday, but not yet.


Does this rally have legs?

Arguably, this relief rally has more legs beyond any initial resistance target. The usually reliable ITBM model is on the verge of flashing a buy signal.


An analysis of hourly returns shows that they reached +/- 2.5% levels in the latest downdraft. This is a condition that has signaled significant bounces in the past.


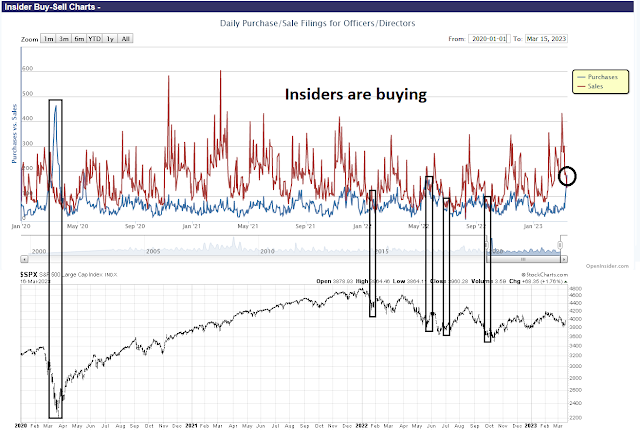
Jay Kaeppel at SentimenTrader pointed out a smart and dumb money frenzy. Retail option traders are piling into put options for downside protection, while insider selling has virtually evaporated. Who would you bet on?


Nautilus Research identified a 50-day cycle in the VIX Index, and it’s projecting a bottom in the VIX in late October. Since the VIX is inversely correlated with stock prices, that implies a late October tactical top.


Other signals from the option market also argue for further upside potential. The 10 dma of the CBOE put/call ratio is elevated. While the market rally may temporarily stall, it’s hard to see how it could crash with the put/call ratio at these levels.


And make no mistake, this is a bear market rally and not the start of a fresh bull. Mark Hulbert found that large market spikes such as the ones we experienced on Monday and Tuesday tend to occur during bear markets.


Volatility ahead

To be sure, investors have to brace for volatility. Half of all equity options now expire in less than a week, the cheapest and most-levered bets. This is likely to enhance volatility in the near term.


As I pointed out at the start of this post, the stock market rally was sparked by a bond market rally. Bond prices are highly dependent on economic data – and there are two big announcements on the horizon. First up is the September Employment Report on Friday. In all likelihood, the headline number will beat expectations. The high-frequency initial jobless claims reports have been trending down, which is a sign of a strong labor market. The more important questions are whether average hourly earnings are showing signs of acceleration or deceleration and whether the labor force participation rate is rising, which would be a sign of people returning to the post-COVID jobs market, which would alleviate the Fed’s concerns of labor market tightness.


Longer term, leading indicators from the August JOLTS report show signs of labor market weakness. Not only did job openings plummet, the quits/layoffs rate, which has led NFP, is nose-diving. As this ratio is a leading indicator of the jobs market, labor market weakness is unlikely to show up for several more months.


Investors will see the all-important CPI next Thursday. Market expectations call for a core CPI of 0.5% on a monthly basis, and 6.5% on an annual basis. These figures are roughly in line with the Cleveland Fed’s inflation nowcast, indicating little or no surprise. However, such a report would be a signal for the Fed to stay on its hawkish path and the odds of a dovish pivot would diminish.


As well, Q3 earnings season begins in earnest on October 14 when the banks begin their reports. While top-down macro expectations are calling for an earnings deceleration, the bottom-up picture tells a different story. FactSet pointed out that Q3 positive guidance has risen and negative guidance has fallen compared to Q2, which is a potential positive surprise.


Stay tuned. I have outlined the risk and potential rewards. If you are bullishly positioned, the degree of greed and risk you take is up to you. In all cases, prepare for volatility.


Disclosure: Long SPXL


Seven reasons why traders should grit their teeth and buy

Preface: Explaining our market timing models 

We maintain several market timing models, each with differing time horizons. The “Ultimate Market Timing Model” is a long-term market timing model based on the research outlined in our post, Building the ultimate market timing model. This model tends to generate only a handful of signals each decade.


The Trend Asset Allocation Model is an asset allocation model that applies trend-following principles based on the inputs of global stock and commodity prices. This model has a shorter time horizon and tends to turn over about 4-6 times a year. The performance and full details of a model portfolio based on the out-of-sample signals of the Trend Model can be found here.


My inner trader uses a trading model, which is a blend of price momentum (is the Trend Model becoming more bullish, or bearish?) and overbought/oversold extremes (don’t buy if the trend is overbought, and vice versa). Subscribers receive real-time alerts of model changes, and a hypothetical trading record of the email alerts is updated weekly here. The hypothetical trading record of the trading model of the real-time alerts that began in March 2016 is shown below.


The latest signals of each model are as follows:
  • Ultimate market timing model: Sell equities
  • Trend Model signal: Neutral
  • Trading model: Bullish

Update schedule: I generally update model readings on my site on weekends and tweet mid-week observations at @humblestudent. Subscribers receive real-time alerts of trading model changes, and a hypothetical trading record of those email alerts is shown here.


So much for the BoE

The market took a risk-off to begin last week until the BoE announced a surprise intervention to buy gilts with maturities of 20 years or more “on whatever scale is necessary” in order to stabilize markets. Global markets rallied for all of one day and the S&P 500 weakened for the rest of the week. So much for BoE intervention.


As the S&P 500 violated support on Friday, the midcap S&P 400 and the smallcap Russell 2000 did not confirm by holding their respective support levels. Should you believe the breakdown?


Here are seven reasons why traders should grit their teeths and buy stocks.


Buy signals everywhere

I am seeing short-term buy signals everywhere. Investors Intelligence bull-bear spread has turned negative again, which have tended to signal good long entry points. Bullish sentiment has fallen to lows not seen since 2016. 


The AAII bull-bear remained roughly unchanged at an extreme bearish reading for a second consecutive week.


Bloomberg reported that four out of five components of Sanford Bernstein’s Composite Sentiment Indicator, volatility, put/call ratio, investor survey and equity fund flow data, have reached negative extremes. 


The Zweig Breadth Thrust Indicator reached an extreme oversold level comparable to the levels last seen during the COVID Crash. Readings recycled to neutral on the day of the BoE intervention but returned to oversold the next day. While there is no guarantee that oversold markets can become more oversold, the odds indicate a favorable risk/reward for bullish positions.


Rob Hanna of Quantifiable Edges reported that his Capitulative Breadth Indicator (CBI) reached 13 last Tuesday. Historically, readings above 10 have been strong buy signals.


As the S&P 500 probed its lows last week, improvements in breadth appeared beneath the surface. Net NYSE and NASDAQ highs-lows turned up even as the market weakened, which is a constructive sign for equities.


Best of all, insiders are buying as the market fell. 


Bullish, but beware of tail-risk

In conclusion, market omens are lining up for a strong relief rally. While the intermediate-term trend is still down after a bounce, traders should be prepared for a rip-your-face-off rally that could happen at any time. The Trend Asset Allocation Model has finally turned risk-off. In light of the likely relief rally and the poor performance of the bond market which has not been diversifying for equity holdings this year, I am putting the signal change on hold. I will re-evaluate market conditions in two weeks and make a decision on the model signal.


To be sure, tail-risk is still present. The Guardian reported that Ukrainian intelligence believes the threat of Russian use of tactical nukes are “very high”.
 

In an interview, Ukraine’s military intelligence put the threat of Russia using tactical weapons against Ukraine at “very high”. A nuclear weapon is about 100 times more powerful than the type of rockets Russia has used against Ukraine so far, said Vadym Skibitsky, Ukraine’s deputy intelligence chief.


“They will likely target places along the frontlines with lots of [army] personal and equipment, key command centres and critical infrastructure,” said Skibitsky, about Russia’s use of tactical nuclear weapons. “In order to stop them we need not just more anti-aircraft systems, but anti-rocket systems.


“But everything will depend on how the situation develops on the battlefield.”
In that case, the 1962 Kennedy Slide and Cuban Missile Crisis market template could come into play. As a reminder, the market tanked in early 1962, rallied, and fell again into a second low that coincided with the Cuban Missile Crisis. But the Cuban Missile Crisis low did not undercut the initial low.


Disclosure: Long SPXL


The anatomy of a failed breadth thrust

Many technical analysts turned excited in late August when the percentage of S&P 500 stocks above their 50 dma surged from below 5% to over 90%. Historically, such breadth and momentum thrusts have signaled a fresh bull market with a track record of 100% accuracy.


Since then, the percentage of stocks above their 50 dma retreated all the way back down to 5%. The breadth thrust fizzled. Here’s why.


Don’t ignore the Fed

The historical record of another breadth thrust model, the Zweig Breadth Thrust, tells the story. ZBT buy signals are extremely rare. There have been six out-of-sample ZBT buy signals since Marty Zweig outlined this signal in 1985. The stock market was higher 12-months later in all cases. In two of the cases, the market didn’t immediately surge after the buy signal. These periods coincided with periods of a rising Fed Funds rate, just as we have today.


Today, Fed policy is extremely tight. Here is what we know from the last FOMC meeting:
  • The Fed is anticipating “ongoing increases” in the Fed Funds rate, and expects higher for longer: “Restoring price stability will likely require maintaining a restrictive policy stance for quite some time”.
  • Median expectations for the Fed Funds rate is 4.4% by year-end and 4.6% by the end of 2023.
  • The Fed will keep at it “until the job is done”.
Ignore the Fed at your own peril.


Better news on inflation

That said, inflation pressures are moderating all around the world, as measured by the Inflation Surprise Indexes, notwithstanding the hotter than expected August PCE print.


Remember the supply chain bottlenecks? Global shipping rates are all collapsing, which should be good news for inflation.


The problem is the jobs market is still strong, as evidenced by falling initial jobless claims after topping out in late July. The Fed has made it clear that unemployment has to rise for inflation to fall.


Will something break?

I’ve pointed out before that the other hope for a central bank pivot is a financial crisis (see Why a financial crisis could be the bulls’ best hope). Last week’s BoE intervention in the gilt market was a stark example that the UK had come very close to a consequential financial accident with likely domestic and international spillover effects. 


In very simple terms, here is what happened. The WSJ reported that liability-driven investment funds (LDI) are leveraged, and that’s when trouble began.


The LDI strategy is meant to help pensions more efficiently manage their assets to ensure they can pay future retirees. Pensions use an LDI manager, who buys interest-rate swaps and other financial instruments to hedge against the risk that falling interest rates and rising inflation will increase their future obligations. 


The LDI strategies also widely use leverage to try to close the gap between what they own and their future pension promises. “A LDI manager might buy £100 of interest rate exposure using £30 to £40 of the fund’s assets,” said Jon Hatchett, a partner at consulting firm Hymans Robertson. 


That freed up assets to try to close pension-fund deficits but it increased the strain on the funds during the market turmoil, Mr. Hatchett said. “Those moves decimated the value of the assets backing the LDI portfolio,” he said. 


The strategy was encouraged by U.K. regulators to help funds manage interest-rate risks. A guide from the pensions regulator said the strategy typically offers “an improved balance between investment risk and return but it does introduce additional risks.”
The LDI strategy is very popular in the UK and employs leverage as much as seven to one.
The widespread adoption of LDI has been accompanied by higher levels of risk taking, according to the U.K. pensions regulator. Its 2019 survey of 137 big U.K. pension schemes found 45%, or almost half, had increased their use of leverage in the last five years. The maximum leverage allowed by the pensions ranged up to seven times, the survey found.
Pension funds hold gilts, but they repo the gilts out. They hedge with interest rate swaps by receiving fixed and paying variable rates. When the market reacted badly to the new government’s mini-budget, the gilt market fell and a doom loop began. As the value of gilts, or collateral, fell the pension received margin calls. What’s more, as rates move higher, they had to post variable margin on their interest rate swaps. A significant number of UK pension funds were at risk of becoming insolvent  In response, the BoE said it would purchase gilts on “whatever scale is necessary” for a limited time to prevent an “unwarranted tightening of financing conditions and a reduction of the flow of credit to the real economy”.


The problem doesn’t stop there. European banks have extensive exposure to the UK. It’s unclear the degree of contagion risk exposure had the BoE not stepped in on an emergency basis. The European Systemic Risk Board (ESRB) just issued a general warning about tail-risk in the Eurozone, “Risks to financial stability may materialise simultaneously, thereby interacting with each other and amplifying each other’s impact”. It identified three issues:
  • Rising debt levels and recession risk: The deterioration in the macroeconomic outlook combined with the tightening of financing conditions implies a renewed rise in balance sheet stress for non-financial corporations (NFCs) and households, especially in sectors and Member States that are most affected by rapidly increasing energy prices. These developments weigh on the debt-servicing capacity of NFCs and households.
  • Systemic financial risk: Risks to financial stability stemming from a sharp fall in asset prices remain severe. This has the potential to trigger large mark-to-market losses, which, in turn, may amplify market volatility and cause liquidity strains.
  • Rising credit risk: The deterioration in macroeconomic prospects weighs on asset quality and the profitability outlook of credit institutions
European credit risk is rising. High yield spreads have widened to levels seen during the COVID Crash.


King Dollar = Godzilla

The accumulated problems presented by Fed hawkishness are also present in Asia. In the movies, Godzilla emerges from the sea and wreaks havoc on Tokyo. Godzilla’s real name today is King Dollar. The Fed’s tight monetary policy has forced up the USD. By contrast, the BoJ has chosen to swim against the global monetary tide by staying dovish, which has cratered the JPY and effectively imported inflation from America. The Yen is back to levels not seen since the 90’s.


Over in China, it was the story of another day, another intervention by global central bank authorities. The strong USD pushed the onshore Chinese yuan to the psychologically 7.25 level before retreating, a level last seen during the GFC. The PBOC warned against speculative trading against the yuan and asked state-owned banks to be prepared to sell dollars in order to stabilize the currency. The yuan depreciation raises the risk of capital outflows. As a reminder, when China faced a balance of payment pressures in 2015, the PBOC sold U.S. assets to support the exchange rate and U.S. stock and bond prices came under pressure. 


FT Alphaville reported that Barclays analysts warned about the systemic risks posed by CNY depreciation:
While this is not a ‘systemic crisis’ moment, it is a worrying sign for the global macro outlook. After all, China is the single most important trading economy in the world. If the CNY is on a path to sustained depreciation, that is big news for every other exporter; most other countries will have to follow to keep themselves competitive. And yet, many of these countries are already facing high inflation and the need to defend their currencies from further depreciation. As important, the overnight move might be a sign that the PBoC is now comfortable with further weakness. A few days ago, it seemed like the Chinese central bank was planning to push back against further USD strength. If China is now changing tack, there is considerable room to go. In some ways, the recent CNY weakness is just the currency playing catchup to the weakness in every other currency against the dollar. We estimate that if the CNY were to go back to Q1 2021 levels on the CFETs basket, it would need to depreciate to 7.5 against the USD.


In short, an RMB depreciation would be catastrophic for Asia and create systemic problems for the region and for the global trading system. Other Asian central banks are also feeling the heat. As the sign of another pivot, the Bank of Korea took bids in the bond market as it became the latest central bank to intervene and resume bond buying to curb rising yields.


Something is going to break soon, we just don’t know what, but it will likely be outside US borders. For the moment, the level of US financial stress is low. Historically, recessions haven’t ended without the St. Louis Fed Financial Stress Index rising above zero.


Investment implications

Based on this analysis, I can think of two possible scenarios for US equities. The first is a multiple bottom scenario like 2002-2003. The S&P 500 first bottomed by experiencing a breadth wipeout, as measured by the percentage of stocks above their 50 dma, in July rallies and suffered a second breadth wipeout in October. The market then recovers but chops around but doesn’t really get the all-clear signal until the following May. The timing of this pattern is consistent with a recession in 2023 that ends late in the year. Since markets look forward by 6-12 months, a market bottom by next spring or summer is to be expected. 


While history doesn’t repeat itself but rhymes, this scenario doesn’t preclude the market from going lower before it makes a final bottom (see How to estimate S&P 500 downside risk). The S&P 500 is currently trading at a forward P/E of 15.3. History shows that there were two periods when the 10-year Treasury was trading at similar yield levels. The first was 2002-2003 when the market bottomed, and 2007-2011, which was the period just before and after the GFC. There are some key differences. The 2002-2003 episode was during a period when yields were falling, while the GFC episode featured yield volatility. Yields are rising today. Nevertheless, we can see that the S&P 500 forward P/E ratio traded in a range of 15-17 during the 2002-2003 period and 13-15 during GFC, if we exclude the panicked valuation during the 2008-2009 bottom. Assuming a 20% cut to forward earnings estimates and a 13-17 range as a target P/E multiple, this translates to a peak-to-trough drawdown of 30-50%, which is a typical loss experienced in recessionary bear markets.


The second scenario is that something breaks and the world experiences a financial crisis with sufficient contagion risk that global central bankers are forced to pivot monetary and save the system. In that case, the seasonal mid-term election year pattern might be a better template for the path going forward.


Take your pick, but don’t forget to practice prudent risk management in the process.


The BOE rescues the markets

Mid-week market update: Before going to bed last night, I check the overnight market and saw that S&P 500 futures were down as much as -1% and thought, “Here we go again!” I woke to see that the BOE had committed to buying Gilts “on whatever scale is necessary” which sparked a risk-on stampede.

The market was ready to be rescued, it just needed the bullish catalyst. One of the signs of an oversold stock market is the VIX Index rising above its upper Bollinger Band, and the VIX had gone on an upper BB ride for nearly a week. Tactically, the bullish impulse has historically petered out when the VIX reaches its 20 dma.

Ready to rally

The market was washed out and it was ready to rally. All four of my bottom spotting indicators had flashed buy singals in the past week.

  • The VIX above its upper BB, indicating an oversold market;
  • An inverted VIX structure, indicating fear;
  • The NYSE McClellan Oscillator was wildly oversold; and
  • TRIN spiked above 2, indicating panic-driven selling.

For some context on how badly price momentum got wiped out in the last downdraft, the % of S&P 500 stocks above their 200 dma fell to 10%, which is rare and has occurred four times in the last 20 years and marked major bear markets.

As well, the VIX Index had reached the bottom of its target zone yesterday, which was a sufficient condition for a short-term bottom.

When markets panic like this, it’s difficult to trade the bottom as markets can be volatile and extremely headline sensitive. Trading guru Brett Steenbarger recently discussed wildly oversold stock markets and came to the following conclusion:

Positive average returns don’t mitigate the need for sound risk management.  If central banks need to see significantly weaker economies to crush inflation, then stock markets can be expected to anticipate that weakness.  The average individual investor is long stocks and long bonds.  Both positions are getting crushed and could see real disaster if central banks need to continue to administer harsh medicine.

In all likelihood, the BOE decision was the catalyst for a relief rally. As well, CNBC reported that San Francisco Fed President Mary Daly struck a less hawkish tone in a speech today. My inner trader is long the market and he will exit his position once the VIX reaches its 20 dma, but as Steenbarger pointed out, sound risk management is a key to trading these volatile markets.

Disclosure: Long SPXL

How to estimate S&P 500 downside risk

As we approach Q3 earnings season, the Street cut the bottom-up S&P 500 forward 12-month EPS estimates by an estimated -0.41% as recession anxiety begins to rise. The good news is the market is trading at a forward P/E of 15.8, which is below its 5- and 10-year averages.


In light of the heightened recession risk, what’s an appropriate valuation for the S&P 500? What’s the downside risk from here?


What’s the “right” valuation?

Forward P/E ratios don’t exist in a vacuum. Stocks have to compete with other asset classes, such as risk-free Treasuries, for investment funds. With that in mind, I went back to 1995 and looked at the last time the 10-year Treasury yield traded at the current levels.


There were two periods when the 10-year Treasury was trading at similar yield levels. The first was 2002-2003 when the market bottomed, and 2007-2011, which was the period just before and after the GFC. There are some key differences. The 2002-2003 episode was during a period when yields were falling, while the GFC episode featured yield volatility. Yields are rising today.


Nevertheless, we can see that the S&P 500 forward P/E ratio traded in a range of 15-17 during the 2002-2003 period and 13-15 during GFC, if we exclude the panicked valuation during the 2008-2009 bottom.


Here is where we stand today. FactSet reported that the S&P 500 forward P/E as of last Thursday’s close was 15.8, or a forward 12-month EPS of 237.85. Negative earnings growth varies considerably during recessions. The average decline since 2001 is -22%, which is a slightly optimistic estimate since the sample includes 2007, which was just the start of the recession, and 2015, which was a growth recession.


If we pencil in a -20% decline in forward EPS estimates and apply the 15-17 2002-2003 multiple range to the S&P 500, we get a downside potential of 12% to 22% from Friday night’s closing prices. Applying the 13-15 multiple range of the GFC experience, the downside potential is 22% to 33%.


What if there is no recession? Assuming that earnings estimates don’t change, the range is a downside potential of -16% and upside potential of 10%.


In conclusion, rising yields are putting pressure on S&P 500 valuations. If investors were to assume an average recession, the downside potential could be as high as 33% from current levels and a peak-to-trough range of -33% to -48%, which would take the S&P 500 to either the top of the pre-pandemic peak or the levels of the 2018 Christmas Eve panic. On the other hand, the market is roughly fairly valued if the economy were to sidestep a downturn.


The right and wrong way to throw in the towel

Preface: Explaining our market timing models 

We maintain several market timing models, each with differing time horizons. The “Ultimate Market Timing Model” is a long-term market timing model based on the research outlined in our post, Building the ultimate market timing model. This model tends to generate only a handful of signals each decade.


The Trend Asset Allocation Model is an asset allocation model that applies trend-following principles based on the inputs of global stock and commodity prices. This model has a shorter time horizon and tends to turn over about 4-6 times a year. The performance and full details of a model portfolio based on the out-of-sample signals of the Trend Model can be found here.


My inner trader uses a trading model, which is a blend of price momentum (is the Trend Model becoming more bullish, or bearish?) and overbought/oversold extremes (don’t buy if the trend is overbought, and vice versa). Subscribers receive real-time alerts of model changes, and a hypothetical trading record of the email alerts is updated weekly here. The hypothetical trading record of the trading model of the real-time alerts that began in March 2016 is shown below.


The latest signals of each model are as follows:
  • Ultimate market timing model: Sell equities
  • Trend Model signal: Neutral
  • Trading model: Bullish

Update schedule: I generally update model readings on my site on weekends and tweet mid-week observations at @humblestudent. Subscribers receive real-time alerts of trading model changes, and a hypothetical trading record of those email alerts is shown here.
 

Subscribers can access the latest signal in real-time here.


A crowded short

In the wake of the post-FOMC meeting downdraft, three of the four components of my bottom spotting models flashed buy signals. 
  • The VIX Index has spiked above its upper Bollinger Band, which is an oversold condition for the market, 
  • Yhe NYSE McClellan Oscillator had become wildly oversold, and 
  • TRIN spiked above 2, indicating price insensitive panic selling. 

In the past, buy signal counts above two have indicated bullish risk/reward conditions for stock prices.


Other sentiment models are also pointing to crowded short conditions. In many ways, traders had already thrown in the towel even before the FOMC meeting, which is likely to put a floor on stock prices. But there is a right way and a wrong way to throw in the towel.


Too many bears

Numerous signs have appeared of a sentiment washout. The BoA Global Fund Manager Survey, which was conducted September 2-8, 2022, showed equity positioning at a record low.


The AAII weekly sentiment survey showed that the bull-bear spread and bearish sentiment readings were only exceeded at the 1990 and 2008 market lows. Bearishness today is even worse when compared to the aftermath of the 1987 market crash.


I recognize that the AAII survey is flawed because of a small sample size and a varying composition of respondents, but Ryan Detrick compiled the historical returns of the S&P 500 after AAII bears exceeded 60%. The instances were rare (n=4), but subsequent returns were strong across all time horizons.


In addition, S&P 500 futures net positioning is very bearish and has reached levels only seen during the downturns of 2008, 2011, 2015, and 2020.


In a report published on September 20, 2022, which was before the FOMC meeting, Mark Hulbert observed that his Hulbert Nasdaq Newsletter Sentiment Index dipped in the bottom decile of sentiment readings.


The wrong way to throw in the towel

Despite the apparent signs of excessive bearishness, Hulbert had a warning for investors.
A new bear-market low is likely still in the cards for U.S. stocks, for two contrarian-related reasons:


First, at no point in the current bear market has there been the deep pessimism and despair that frequently accompanies major bottoms — what many refer to as capitulation, or throwing in the towel.


Second, whenever even moderate pessimism has emerged, it has been short-lived; investors instead have been eager to jump on the bullish bandwagon at the mere whiff of a possible rally.
Jurrien Timmer at Fidelity pointed out that for all the talk about excessive bearishness, fund flows aren’t showing signs of capitulation. That said, the latest fund flow reports indicate that investors pulled money from all asset classes and money market fund assets swelled, but that may be only a blip and not evidence of protracted panic.


Equally disturbing is the lack of insider buying. A monitor of insider activity shows that insider buying (blue line) hasn’t exceeded insider selling (red line) as it did during incidents of market weakness this year.


Option sentiment presents a mixed picture. On one hand, the VIX Index remains below the target zone of 33-36 where the market has bottomed in the past. On the other hand, put/call ratios have spiked to fresh highs and the 10 dma of both the CBOE put/call ratio and equity-only put/call ratio are consistent with levels reached at the June bottom.


Sell the rips

I interpret these readings in two ways. The signs of excessive bearishness are short-term in nature, which is likely to put a floor on stock prices as they weaken. In other words, the market is poised for a relief rally.


On the other hand, the bearish factors are more intermediate-term in nature. Barring a bullish macro or fundamental catalyst, the path of least resistance is still down after any counter-trend bounce (see yesterday’s publication What the Fed and FedEx are telling the markets).


Technical analysts virtually all turned universally bullish after the strong momentum thrust off the June low when the percentage of S&P 500 stocks above their 50 dma surged from below 5% to over 90%. Since then, price momentum has fizzled and readings have returned to oversold again, indicating a failed breadth thrust.


Willie Delwiche also pointed out that global breadth, as measured by the percentage of individual markets above their 200 dma, is low at 17%. The moral of this story is not to over-rely on sentiment or any single model. Wait for confirmation from other uncorrelated models before making an investment decision.


In conclusion, sentiment readings and technical conditions are sufficiently washed out that a relief equity rally can happen at any time. However, the intermediate-term direction is still down. Prepare for the bounce, but don’t forget to sell the rips.


Disclosure: Long SPXL


What the Fed and FedEx are telling the markets

Both the Fed and FedEx had messages of recession for the markets. Fed Chair Jerome Powell said that the Fed would raise rates until there was clear and convincing signs that inflation was headed toward its 2% target, and its projections amounted to a recession that begins either late this year or early next year. FedEx warned about a slowdown in global shipping volumes and recessionary conditions.
 

As we approach Q3 earnings season, an interesting divergence is appearing in the derivative markets. While the SKEW, which measures the price of option tail-risk, is low for the S&P 500, the SKEW for individual stocks has been elevated. This reflects rising anxiety about possible blow-ups in individual stocks as earnings season approaches.


Still, a review of the risks shows that not all is at it seems below the surface.


The Fed’s hawkish message

The latest Summary of Economy Projections (SEP) was highly revealing of Fed policy. The Fed had sharply reduced its GDP growth projection for 2022 and raised its Fed Funds projections for 2022 and 2023. The median expected Fed Funds rate is now 4.4% for December 2022 and 4.6% for December 2023, which was ahead of market expectations. In other words, the message is “higher for longer”.


Even though the Fed can’t be seen to call for a recession, a recession is implicit in the Fed’s forecast. How can GDP growth slow to 0.2% by December 2022 and rise to 1.2% by December 2023 when the Fed is raising rates and keeping them elevated for all of next year? Moreover, former Obama CEA Chair Jason Furman pointed out that the Fed’s unemployment forecast would trigger the Sahm Rule recession tripwire.


The market reflexively went risk-off in the wake of the FOMC meeting as it began to discount a recession. New Deal democrat, who maintains a discipline of using coincident, short-leading, and long-leading indicators to forecast economic growth, isn’t now pondering whether there will be a recession, but how deep it will be.

Suddenly there are a lot of things for me to write about; including not just if there will be a recession, but also how deep and how long it might be. The longer the Fed goes on raising rates, the more I think it may turn into a bad, deep recession.

Alfonso Peccatiello, who writes as Macro Alf, went back 100 years and looked at all 16 U.S. recessions during that time. In all 11 episodes when we entered a recession with inflation above 3%, the resulting sharp economic slowdown did bring inflation down.  On average it took 16.2 months to slow CPI from peak back to 2%. The peak-to-trough reduction in CPI was -6.8%. Based on his projections, this recession should end in late 2023.


The FedEx warning

In addition, FedEx CEO Raj Subramaniam recently issued a warning about a global slowdown:
Global volumes declined as macroeconomic trends significantly worsened later in the quarter, both internationally and in the U.S — We’re seeing that volume declined in every segment around the world, and so you know, we’ve just started our second quarter. The weekly numbers are not looking so good, so we just assume at this point that the economic conditions are not really good. We are a reflection of everybody else’s business, especially the high-value economy in the world.
The slowdown is especially evident in China, but global container shipping rates have been falling since late 2021 and the collapse began to accelerate at the end of Q1 2022.


However, not all is gloom and doom. Demand has shifted from goods, which affects shipping companies like FedEx, to services. Bank of America CEO Brian Moynihan revealed in an earnings call that the American consumer is still spending.

In the month of August 2022, consumers spent 10% more than they spent in August 2021 — customers are spending more. They have – the amount of money and accounts is not going down. It’s been relatively flat — They’re spending it at a good clip. Their capacity to borrow. All credit cards are still enough to where they were in the pandemic. Our home equity loans are still down and you look across the industry capacity to borrow. So the consumer is in very good shape. And you sort of say, why is that true in the discussions with various people, it’s pretty simple. They’re getting employed.

VISA President Ryan McInerney agrees with that assessment:
So I think the best way to describe consumer spending right now is stable, and that’s what we see in our numbers. There’s been some shifts in the way consumers are spending, what they’re buying, and where they’re spending. But, overall spending has been remarkably stable, both in the United States here and for the most part around the world.
VISA CFO Vasant Prabhu explained that the weakness in FedEx results can be explained by a shift in demand from goods to services:
If you look across categories, as you might expect, people have switched from, as they say, buying things to doing things. And sort of buying goods, people are into experiences. Travel is booming as you might know from having flown yesterday. Hotels, airlines, and entertainment is doing well, restaurants are doing well. There’s no obvious difference between high-end consumers and lower-end consumers. They may be buying different things, but nominal levels of spending have stayed quite stable, and that’s largely true around the world.
We can see the shifts in demand in different categories of PCE. While Services PCE (blue line) has been remarkably stable, durables goods PCE (red line) has been extremely volatile during the pandemic and post-pandemic period, and nondurable goods PCE (green line) less volatile. The FedEx warning is reflective of the sudden downdraft observed in durable goods PCE, or the “transitory inflation” effect. The disaggregation of PCE components also shows the Fed’s dilemma. PCE inflation rates remain stubbornly elevated, which may prompt Fed officials to over-tighten and send the economy into a deep recession.


A dismal earnings outlook

This analysis indicates that investors will need to be prepared for volatility from different parts of the market. While services companies are more likely to meet or beat Street expectations, companies involved in goods production and their transportation are prone to disappointment.


The outlook for long-term corporate profitability is even worse. Fed research Michael Smolyansky published a note which concluded that much of the increase in net margins can be explained by falling interest expenses and lower tax rates, which are unlikely to continue. 
Over the past two decades, the corporate profits of stock market listed firms have been substantially boosted by declining interest rate expenses and lower corporate tax rates. This note’s key finding is that the reduction in interest and tax expenses is responsible for a full one-third of all profit growth for S&P 500 nonfinancial firms over the prior two-decade period. I argue that the boost to corporate profits from lower interest and tax expenses is unlikely to continue, indicating notably lower profit growth, and thus stock returns, in the future.


In the short-term, the latest update from FactSet shows weekly EPS revisions falling across all time frames, which is bearish sign for equity fundamentals.


Investment implications

Putting this all together, these developments have ominous implications for equity market returns. The Fed is tightening policy, which is negative for equity valuation. A recession is on the horizon, which is bearish for the earnings outlook. Q3 earnings season could see some bifurcation as the goods-producing sector faces challenging conditions while services remain strong.


A non-linear thinker may conclude that while the equity market outlook may be bearish short-term, market history shows that the Fed always pivots in the face of a financial crisis. While US corporate and household balance sheets are strong, the same can’t be said overseas. Europe is already in recession, and China is probably in a recession. I am monitoring the stock market performance of regional markets for signs of a bottom and turnaround. In particular, Europe is extremely vulnerable to a financial crisis that would prompt global central bankers to ride to the rescue and ease policy.


Higher for longer

Mid-week market update: The Fed has spoken. As expected, it hike interest rates 75 bps. In its Summary of Economy Projections (SEP), it sharply lowered GDP growth for this year and it raised the Fed Funds projection to 4.4% for this year and 4.6% next year, which are both ahead of market expectations. In other words, higher for longer (though it did signal rate cuts in 2024).


Fed Funds futures reacted by extending the already elevated Funds Funds rates for next year, but it did show some skepticism of the Fed’s SEP by expecting rate cuts by September 2023.


The FOMC pattern broken?

The 2022 S&P 500 FOMC pattern of weakening into an FOMC meeting and rallying afterward appears to be broken. However, the market may be oversold enough to bounce. the 5-day RSI was already oversold coming into the meeting, indicating limited downside potential.


II sentiment shows more bears than bulls, which is conducive to market strength.


Two of the four components of my market bottoming model are already flashing a buy signal. The NYSE McClellan Oscillator was oversold coming into the meeting. Today’s estimated TRIN reading spike above 2 to 2.3, indicating panic selling and another buy signal.


The other two components are also very close to buy signals. The VIX Index briefly spiked above its upper Bollinger Band today and the term structure of the VIX also briefly inverted. In the past, two out of four components flashing buy signals have been indicators of positive risk/reward for long positions.


Subscribers received an alert yesterday that my trading account had tactically bought S&P 500 exposure. My inner trader is maintaining the long position in light of these buy signals in anticipation of a turnaround in the next two days.


Putin’s gambit

The other development to be aware of is the news of Russia’s partial mobilization. Putin appeared on Russian television and announced a partial mobilization of 300,000 reservists. While the measure was short of a full draft, it was also designed to keep soldiers with contracts that expire in the Russian Army. Moreover, he announced annexation referendums in the Russian occupied parts of Donetsk, Luhansk, Kherson, and Zaporizhzhia regions of Ukraine, which would make attacks in these regions an attack on Russia. It was a way of rattling the nuclear saber.


Take a deep breath. The risk of nuclear war remains low. The Ukrainians had already attacked parts of Crimea, which was considered Russian soil, and crossed Putin’s red line with no reaction. The market agrees. The relative performance of MSCI Poland edged down on the news and it remains in relative downtrends against the Euro STOXX 50 and ACWI. However, there is no sign of panic.


I interpret these developments as signs of Russian recognition that it needs to bolster the ranks of the Army for a fight over the winter. While the nuclear threat is always present, the risk of crossing that threshold is still low.


Disclosure: Long SPXL


A flock of hawks circle Wall Street

Preface: Explaining our market timing models 

We maintain several market timing models, each with differing time horizons. The “Ultimate Market Timing Model” is a long-term market timing model based on the research outlined in our post, Building the ultimate market timing model. This model tends to generate only a handful of signals each decade.


The Trend Asset Allocation Model is an asset allocation model that applies trend-following principles based on the inputs of global stock and commodity prices. This model has a shorter time horizon and tends to turn over about 4-6 times a year. The performance and full details of a model portfolio based on the out-of-sample signals of the Trend Model can be found here.


My inner trader uses a trading model, which is a blend of price momentum (is the Trend Model becoming more bullish, or bearish?) and overbought/oversold extremes (don’t buy if the trend is overbought, and vice versa). Subscribers receive real-time alerts of model changes, and a hypothetical trading record of the email alerts is updated weekly here. The hypothetical trading record of the trading model of the real-time alerts that began in March 2016 is shown below.


The latest signals of each model are as follows:
  • Ultimate market timing model: Sell equities
  • Trend Model signal: Neutral
  • Trading model: Neutral

Update schedule: I generally update model readings on my site on weekends and tweet mid-week observations at @humblestudent. Subscribers receive real-time alerts of trading model changes, and a hypothetical trading record of those email alerts is shown here.
 

Subscribers can access the latest signal in real time here.


Waiting for the FOMC

As investors look ahead to the FOMC meeting next week, rates are rising and the 2s10s yield curve is inverting further. The 10-year to 3-month spread is not inverted yet, but it likely will once the Fed raises rates.


It’s difficult to make definitive bull or bear views on equities and bonds as there is much policy uncertainty. Here is what I am watching:
  • The Fed has given the obligatory nod to a “soft landing” but what’s the body language about a possible recession?
  • The Fed has said higher for longer, but how much longer?
  • What are its inflation projections for 2022, 2023, and 2024 in the Summary of Economic Projections (SEP)?
  • How far does the dot plot get revised up, and what is the terminal rate?


The small business barometer

As we are in the blackout period for Fed officials ahead of the FOMC meeting, investors are left to speculate on the likely direction of Fed policy. Here are some clues from the most recent NFIB small business survey. The survey is especially useful since small businesses are sensitive economic barometers because they lack bargaining power. The NFIB survey had some good news on inflation. The pace of price increases is rapidly decelerating, which is good news.


The bad news is that small business optimism edged up, which is a curious reading during a midterm election year. Small business owners tend to tilt small-c conservative and Republican. Normally, small business optimism is depressed when the Democrats control the White House and both the Senate and House. The small increase in optimism is a signal that the economy is robust in the face of recession fears which leaves room for the Fed to raise rates without too many recession worries.


Signs of technical weakness

What does that mean for the stock market? Technical indicators all suggest that the path of least resistance is down, at least for the short term. First, we are seeing trend line violations across all market cap bands.


As the S&P 500 broke down to a lower low, breadth indicators have confirmed the weakness by also showing lower lows.


The NYSE McClellan Summation Index (NYSI) has been falling and stochastics are not oversold yet, indicating further downside potential in the near term.


The NYSE McClellan Oscillator rebounded from an extreme oversold reading and it is weakening again, which is an indication that the market could fall further if the bears control the tape.


Equally disturbing is the lack of insider buying as stock prices weakened.


Beware of reversals

Ahead of a possible market-moving event like an FOMC meeting, it’s difficult to make a call on market direction beyond the event. Investors and traders risk falling into a possible price reversal trap. The stock market has followed an FOMC pattern in 2022, where stock prices fall and bottom just ahead of the FOMC meeting and rally afterward, which is an indication that positioning becomes overly hawkish and bearish and snaps back.


Ryan Detrick calculated the daily seasonality for the S&P 500, and we are entering a period of negative seasonality and reversal that roughly coincides with the FOMC meeting cycle.


The market saw a big drop in stock prices in reaction to the hot CPI print. SentimenTrader observed that every single stock in the NASDAQ 100 fell that day, which is rare. A historical study shows that the median one-week return is 0.3%, but the median two-week return is 4.1%. Unless the market melts up on Monday, the first week will be negative, but if history is any guide, the following week should be strongly positive.


In conclusion, it’s difficult to make definitive calls on market direction ahead of an FOMC meeting. Price momentum is negative in the wake of the hot CPI report and I would expect it to continue into the date of the meeting. However, investors need to be prepared for a possible reversal should sentiment and positioning become excessively bearish and hawkish.


A pending major market bottom? It sounds too easy!

Is the universe unfolding as it should? Most technical and sentiment indicators argue for a near-term double bottom in the S&P 500. The June bottom was the initial capitulation bottom. The market rallied and it is poised to weaken and re-test the old lows in the near future. That’s when the new bull begins.


The new bull narrative sounds far too easy. Macro and fundamental factors argue for further downside potential. The Powell Fed is in a “whatever it takes” mode to tame inflation. The 2-year Treasury yield has been climbing relentlessly, which is an indication of rising market expectations of a terminal Fed Funds rate. Forward P/E valuations are becoming increasingly challenging even as the E in the P/E ratio declines ahead of a likely recession. If support at the June low doesn’t hold, SPY faces a possible air pocket and a rapid fall to the 260-320 support zone, which represents considerable downside risk from current levels.


The bull case

The bull case is easy to make. The percentage of S&P 500 stocks above their 50 dma fell below 5% at the June low, which was the signal for a price momentum wipeout (pink vertical lines). The indicator flashed a buy signal by quickly rebounding to over 90% (grey vertical lines). The stock market has continued to rise after every single buy signal in the last 20 years.


With the S&P 500 about to undergo the typically weak September seasonality in a mid-term election year, investors are faced with a potential buying opportunity in the coming weeks that could yield a bonanza by year-end and beyond.


The latest BoA Global Fund Manager Survey showed that global equity allocation fell to an all-time low, indicating widespread panic, which is contrarian bullish. These excessively bearish sentiment conditions should act to put a floor on stock prices if the market were to weaken during its period of negative seasonality.


Putting it all together, the market is poised for a major market bottom in the coming weeks. What more could anyone ask for?


Fundamental and macro doubts

It sounds just too easy and the Federal Reserve begs to differ. Marketwatch reported that Anatole Kaletsky of Gavekal warned that the Fed’s inflation fight isn’t over and the Fed won’t respond if the economy falls into recession.
Anatole Kaletsky, the chairman and chief economist of Gavekal, calculates that even if price increases come to a complete standstill right now, core inflation would still be 4.3% in December, and the headline rate at 6.2%. If core inflation continues to rise at the 0.56% rate as it did in August, it will hit 6.6% in December — and if inflation rises at the same rate recorded by the median CPI over the last three months, that core number will reach 7.2% by December.


“Many investors expect the U.S. economy to plunge into a deep recession and the Fed to respond by panicking and abandoning its inflation target. Both things may happen eventually, but neither is remotely plausible within the next six months or so,” he says.


After all, the most recent data on U.S. activity actually has been strengthening. “With inflation and labor market reports still pointing clearly to overheating, the Fed will have no excuse to hint at pausing, never mind at future easing,” says Kaletsky.


He forecasts the fed funds rate will be 4.5% by Christmas, that core inflation will be around 6.5% and the U.S. economy will still show no evidence of recession.
Fed Funds futures are now pricing in a peak Fed Funds rate of 4.42% in March 2023 and rates remaining above 4% for the bulk of next year. These hawkish higher for longer expectations don’t appear to be fully priced into stock prices.


As we approach Q3 earnings season, the market faces possible disappointment in the form of earnings disappointments as Q3 earnings estimates have been declining.


The earnings picture becomes even worse if the energy sector is excluded. Yardeni Research Inc. suggests that sector analysts are likely to cut profit margin estimates further during Q3 earning season. “Analysts remain mostly bullish on S&P 500 revenues in part because they go up along with inflation. Furthermore, very few industries (such as the S&P 500 Homebuilding) are showing signs of falling into a recession currently.” With the exception of energy and real estate, sector margins have been falling, which is going to create valuation and growth headwinds for equity prices.


The latest economic update from New Deal democrat, who maintains a set of coincident indicators, short-leading indicators with a 6-month horizon, and long-leading indicators with a 12-month horizon, is effectively pointing to a slowdown that begins in early 2023 and a recession by next summer.
The long leading forecast continues to be very negative. The short term forecast is only slightly negative. The nowcast turned slightly positive last week, but back to neutral this week, as tax withholding turned decisively negative (I’ll withhold judgment on the potential broader implications of that until the August 31-September 1 anomaly is out of the 20 day mix).
In a separate post analyzing aggregate payrolls, he warned:
Although the decline in gas prices in the past 3 months has been very helpful, the consumer remains in a really dicey situation. Any further deterioration is likely to signal either that a recession is nearly imminent, or that one has already begun.
As well, last week’s warning from FedEx could be seen as a wake-up call for investors. The company announced that it is closing 90 locations, five corporate offices, and parking aircraft all due to macroeconomic headwinds: “Macroeconomic trends significantly worsened later in the quarter… given the speed at which conditions shifted… we are aggressively accelerating cost reduction efforts.” The company went on to suspend earnings guidance because of ongoing uncertainty.


In short, the combination of higher interest rates, falling earnings expectations, and a probable 2023 recession makes the new bull scenario unlikely. 


Bearish charts

Not all technicians are bullish. Martin Pring is one of the few technical analysts who has a more cautious interpretation of the market and believes that US equity prices could see further downside in the context of inter-market analysis.


Arguably, the June bottom was not a capitulation bottom. The accompanying chart shows the one-hour swings of the S&P 500 since 2001. The hourly swings at the June bottom barely reached the 2.5% level, which is a marginal reading, though similar conditions could be found at the 2018 Christmas Eve bottom.


Let’s have some fun with point and figure charting. Here is a monthly S&P 500 point and figure chart with a 5% box and a one box reversal. The index has retreated to a rising trend line and a breach could signal serious trouble.


Here is the same chart with a two box reversal. The measured target is 3258, which is in the top half of the support zone outlined earlier in the weekly SPY chart.


Resolving the bull-bear debate

Here is how I resolve the bull and bear debate. The BoA Global Fund Manager Survey is a global survey and the underweight position in equities is more reflective of the economic anxieties outside the US. The relative performance of the different regions shows that the US is the clear leader. Europe is underperforming and the other regions are roughly flat relative to the MSCI All-Country World Index (ACWI).


The two main non-US trading blocs, Europe and Asia are in serious economic trouble. For some context, my analysis presents some of the effects in the form of a percentage of GDP.


It’s no surprise that Europe is tanking. Energy costs are soaring and the scale of the energy shock dwarfs past global shocks. A Bloomberg article documented how the ripple effects are shutting seemingly unrelated industries such as brewing and tomato farming. Britain has announced household energy subsidies that amount to 5% of GDP. EU price support is not far behind and estimates are in the range of 5-10% of GDP. BlackRock estimates that the EU energy burden, which is not its price support, is 11.7% of GDP.


Over in Asia, China isn’t faring much better. China’s COVID lockdowns are bringing the economy to a screeching halt. Goldman Sachs estimated that Chinese cities representing 35% of GDP are subject to lockdown.


At the same time, the Chinese property market is imploding. A Bloomberg podcast with Bloomberg Economics chief economist Tom Orlik outlined the scale of the mortgage strike by buyers of incomplete projects. It typically takes about three years for property development to reach completion. Bloomberg Economics found the normal three-year completion rate is 80%, but that figure recently fell to 50% because property developers found themselves squeezed by a lack of financing. The mortgage strike problem is now about 1.4% of GDP. If left unchecked, it will balloon to 4% of GDP by 2024.


How both the bulls and bears are right

Putting it all together, here is how both the bulls and bears could be right. I believe investors need to consider the level of equity sentiment by region. The market is far more concerned about economic weakness outside the US than within the US. The outperformance of US equities is an indication that the market regards the US stock market as a safe haven. In particular, the surveyed exposure to eurozone equities is at a record low, indicating extreme fear.


I recently suggested that Europe is probably already in a recession (see Will Europe drag us into a global recession?) and monitor European equities based on a first-in-first-out principle. Once European risk appetite begins to emerge from its doldrums, that could be the signal for a risk-on revival.


In many ways, Europe is starting to turn. European gas prices have peaked and they are in retreat, indicating that Russia is losing leverage over the EU. While Ukraine has seen some successes on the battlefield, the Russo-Ukraine war is by no means over. Here is what I am watching.


The performance of MSCI Poland is a useful barometer of geopolitical risk premium. The index is still in a downtrend relative to the Euro STOXX 50 and ACWI. Wait for a definitive sign of relative breakouts before sounding the all-clear.


Both BASF and Dow Chemical are commodity chemical producers based on two sides of the Atlantic. BASF (in USD) skidded against Dow in February with the onset of the war, but its relative performance is tracing out a relative bottom against Dow and it is testing a key resistance level. Wait for the relative breakout.


If and when they occur, relative breakouts in these two barometers will be a buy signal for global risk appetite. As investors piled into US assets for their safe haven quality during this downturn, expect US equities to lag as investors rotate into higher octane and higher beta equities. S&P 500 stocks have the potential to lag in the new bull phase. Jurrien Timmer at Fidelity has suggested the 1940’s as a template for the S&P 500, when stock prices fell -26% and then moved sideways as P/E ratios gradually fell.


Investors who are constrained to the US should consider mid- and small-cap equities, whose forward P/E ratios are far less demanding than the large-cap S&P 500.


In conclusion, the bulls could be right in their timing and analysis, and at the same time, the bears could also be right because of their macro and valuation concerns. The key difference is geography. Most of the growth concerns and opportunities are outside the US, while large-cap US equity valuations are elevated because of their perceived safe haven status in a period of slow global growth.


Fed: Do you believe us now?

Mid-week market update: Yesterday’s hot CPI report finally convinced the market that the Fed is serious. For weeks one Fed official after another gave the same message: We will raise rates to about 4% and hold them there while we evaluate the inflation picture. We don’t want a repeat of the 1970s when the Fed prematurely eased while inflation pressures were still strong.
 

Former Fed Vice Chair Richard Clarida said in a CNBC interview,  “I think they’re going to 4% hell or high water, if I had to put it into two boxes. They are data-dependent, but that’s why they’re going to 4%. Inflation is way too high.”


The market is now discounting a 75 bps move next week with about a 25% chance of a 100 bps. The terminal rate is rose to 400-425 bps from 375-400 bps before the CPI report.


Not unexpected

While the intensity of yesterday’s slide was a surprise, a stock market slide was not unexpected. I pointed out that the market was vulnerable to a setback. The VIX Index had recycled from above its Bollinger Band, which is an oversold signal for the market, to its 20 dma. Such events have typically resolved in a stall in rallies. As well, yesterday’s sell-off left an island reversal top, which is also an ominous technical sign.


I also alerted readers that the Cleveland Fed’s August inflation nowcast was above consensus expectations. Ahead of the CPI report, my social media feed was filled with chatter about how soft the print was going to be, indicating excessive sentiment for a dovish pivot and risk-on rally. 


Ed Clissold of Ned Davis Research found that, historically, the DJIA struggles but is marginally positive whenever headline CPI is higher than core CPI, which is the case today. 


More downside potential

Traders were undoubtedly disappointed by the CPI report and the overly bullish positioning led to a -4.3% skid in the S&P 500. While the TRIN spike was a sign of a selling stampede, none of my other tactical bottom indicators are flashing buy signals. I interpret this to mean that there is unfinished business to the downside. The market’s inability to stage any meaningful reflex rebound after yesterday’s massive down day is disturbing.


Nautilus Research pointed out that there is a 50-day VIX cycle, with the scheduled top on Monday, September 19, 2022, which is just before the start of the two-day FOMC meeting.


This is consistent with the FOMC cycle that I’ve noticed in 2022. The market has tended to weaken and bottom either just ahead or coincident with FOMC meeting day.


My inner investor remains neutrally weighted at roughly the weights specified by investment policy. My inner trader remains hesitant about taking a position. The usually reliable S&P 500 Intermediate-Term Breadth Momentum Oscillator (ITBM) just flashed a buy signal when its 14-day RSI recycled from an oversold condition. In light of the bullish headwinds that I just outlined, the risk of a buy signal failure in the manner of the model choppiness during the August-September 2020 period (circled) is a strong possibility.


My inner trader concludes that the prudent course of action is to stay on the sidelines. It’s probably too late to sell but too early to buy.