Preface: Explaining our market timing models
We maintain several market timing models, each with differing time horizons. The “Ultimate Market Timing Model” is a long-term market timing model based on the research outlined in our post, Building the ultimate market timing model. This model tends to generate only a handful of signals each decade.
The Trend Asset Allocation Model is an asset allocation model that applies trend-following principles based on the inputs of global stock and commodity prices. This model has a shorter time horizon and tends to turn over about 4-6 times a year. The performance and full details of a model portfolio based on the out-of-sample signals of the Trend Model can be found here.

My inner trader uses a trading model, which is a blend of price momentum (is the Trend Model becoming more bullish, or bearish?) and overbought/oversold extremes (don’t buy if the trend is overbought, and vice versa). Subscribers receive real-time alerts of model changes, and a hypothetical trading record of the email alerts is updated weekly here. The hypothetical trading record of the trading model of the real-time alerts that began in March 2016 is shown below.

The latest signals of each model are as follows:
- Ultimate market timing model: Sell equities
- Trend Model signal: Neutral
- Trading model: Bearish
Update schedule: I generally update model readings on my site on weekends. I am also on Twitter at @humblestudent and on Mastodon at @humblestudent@toot.community. Subscribers receive real-time alerts of trading model changes, and a hypothetical trading record of those email alerts is shown here.
Subscribers can access the latest signal in real-time here.
Here we go again
Here we go again. A previous “can’t miss” breadth thrust indicator of a new bull market just flashed a buy signal. The percentage of S&P 500 above their 50 dma rose from below 5%, which is an oversold extreme, to over 90%, an overbought extreme. Such a breadth had been a buy signal with a 100% success rate until this year. This indicator flashed a buy signal in August, which failed badly and it recycled back to below 5%.

Is this latest buy signal a case of second-time lucky, or fooled me once, shame on you, fooled me twice, shame on me?
The bull case
The equity bull case rests strictly on historical studies of price momentum. While there are many variations of the bullish resolutions of breadth thrusts and price momentum, I offer the following examples.
Ryan Detrick pointed out that the S&P 500 just put in two back-to-back gains of 5% or more. These examples of strong price momentum have tended to resolve bullishly.

Steve Deppe observed that the S&P 500 ended November with a monthly close with a trailing 2-month return of 10% or more and negative trailing 6-month returns. Such instances of strong momentum after a bear trend have also tended to be bullish.

Jonathan Harrier published a historical study that defended the bullish conclusion of the breadth thrust signal based on the percentage of S&P 500 stocks above their 50 dma. All were higher six and 12 months later.

The devil is in the details. When the first buy signal from the breadth thrust signal appeared in August, I pointed out that while the technical and price momentum outlook was positive, the macro outlook was negative. Moreover, the Zweig Breadth Thrust, which was the rare granddaddy of breadth thrust signals, only flashed six buy signals in the out-of-sample period since Marty Zweig published his book in 1986. While the S&P 500 was higher 12 months later in all cases, the market sputtered immediately after the buy signal in two instances during periods when the Fed was raising rates.

The lesson here is that while technical analysis does add value, top-down macro analysis also matters. In the current case of the breadth thrust buy signal, what would the investor be discounting if he were to buy the market?
What are the bulls discounting?
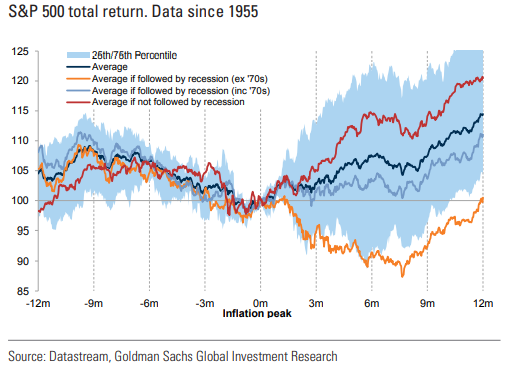
One positive macro development is a softening of inflation indicators. However, analysis from Goldman Sachs found that an inflation peak is only equity bullish if it’s not followed by a recession. If you’re bullish, you’re betting on a soft landing.
New Deal democrat, who maintains a modeling discipline of keeping coincident, short leading, and long leading indicators, has some bad news. Starting with his analysis of ISM data:
Going back almost 75 years, the new orders index has always fallen below 50 within 6 months before a recession. Recessions have typically started once the overall index falls below 50, and usually below 48.
Which means that today’s report for November comes very close to meeting all of the above criteria. The overall index declined below 50 for the first time since May 2020, at 49.0. The new orders subindex declined -2 to 47.2, the 5th time in the past 6 months that it has been below 50, and only 0.1 above its September low of 47.1:

Even though the November Jobs Report was stronger than expected, his analysis of the high-frequency initial jobless claims data is coming close to a recession signal:
In the past, if the 4 week average is more than 5% higher YoY for any significant period of time, and less reliably, if the slightly lagging continuing claims are higher YoY, a recession is almost always close at hand:
The first marker could be met by January 1. The second marker could be met by February.

From a global perspective, the South Korean economy is a sensitive bellwether of global growth. South Korea’s October industrial production fell -3.5%, which was the biggest decline since April 2020. In addition, the SCMP reported that:
- Shipments to China have fallen for six consecutive months, but November’s decline was the sharpest since mid-2009
- South Korean shipments worldwide fell by 14% to US$51.91 billion last month compared to November 2021

What did Powell say?
The market adopted a risk-on tone after Fed Chair Jerome Powell’s speech at Brookings Institution last week (also see video of the speech and Q&A). Market participants appeared to have focused on Powell’s confirmation that the Fed will temper its December rate hike to 50 basis points and he did not want to overtighten.
There were several points that the bulls may have missed. First, Powell revealed that the natural rate of unemployment, or Non-Accelerating Inflation Rate of Unemployment (NAIRU), has risen strongly since the pandemic, and the labor force participation rate (LFPR) has not fully recovered. The weakness in LFPR was mainly attributable to early retirement as older workers left the workforce and to a lesser extent a slower growth in the working population, and lower rates of immigration. Powell observed that older workers have not retired and they are unlikely to return.
This sets up a jobs market dynamic of a higher NAIRU and a persistent tighter labor market. While the Fed may be correct to slow the pace of its rate hikes, it will be more difficult to cut interest rates if NAIRU is still elevated and the job market stays tight. The market is expecting a Fed Funds plateau to begin in early 2023 and next summer or fall. An elevated NARIU makes that scenario less likely.

In the Q&A discussion about the r*, or the natural rate of interest, Powell revealed that the Fed is monitoring how the market responds to monetary policy to measure whether how the tightness of monetary policy. He also stated in his speech that “ongoing rate increases will be appropriate in order to attain a policy stance that is sufficiently restrictive to move inflation down to 2 percent over time”.
The Chicago Fed National Conditions Index has been easing and financial conditions eased further in the aftermath of Powell’s speech. Did the Fed Chair overdo the dovish tilt? Did he inadvertently ease financial conditions with his speech? (Asking for a friend).

In summary, Fed policy in 2023 can be summarized as raise and hold. In the current circumstances, the odds of rate cuts later in the year are relatively low, which is contrary to market expectations.

The bear case
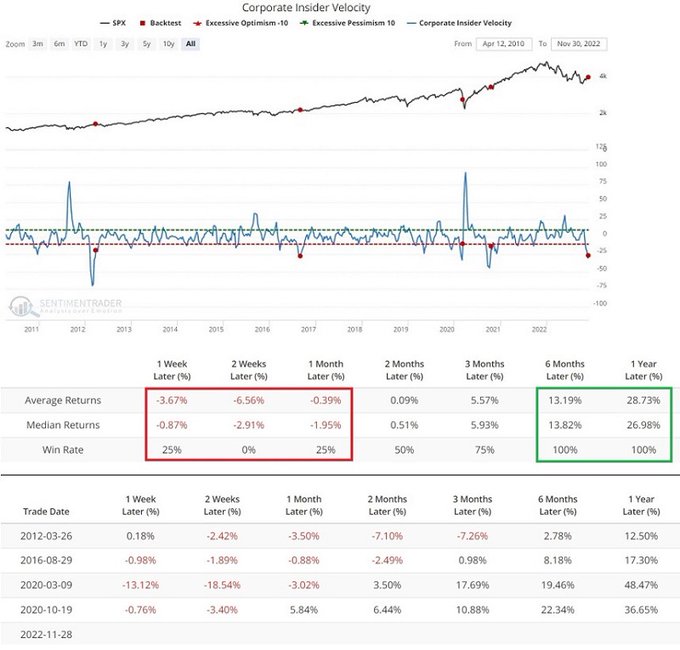
Notwithstanding the macro case to be cautious on stocks, here are the technical and sentiment bear cases. Insider activity has seen a recent surge of selling.

Jay Kaeppel at SentimenTrader found that similar past episodes have been short-term bearish but longer-term bullish for stock prices.
Don’t forget that the Fed’s quantitative tightening program is still operating in the background. Liquidity conditions are starting to roll over, and they have been strongly correlated to the S&P 500.

The S&P 500 is testing key resistance levels, as defined by its 200 dma and falling trend line, while it is overbought on the percentage of stocks above their 20 dma. The market has been behaving in an unusual way. It failed to rally significantly on Thursday after the tame PCE report and it rallied to nearly even after the stronger than expected Jobs Report on Friday. Do you feel lucky?

Finally, I would like to add a note about the disclosure of my trading account after discussions with some readers. I disclose the direction of my trading exposure to indicate any potential conflicts. I use leveraged ETFs because the account is a tax-deferred account that does not allow margin trading and my degree of exposure is a relatively small percentage of the account. It emphatically does not represent an endorsement that you should follow my use of these products to trade their own account. Leverage ETFs have a known decay problem that don’t make the suitable for anything other than short-term trading. You have to determine and be responsible for your own risk tolerance and pain thresholds. Your own mileage will and should vary.
Disclosure: Long SPXU
Instead of trying to short the SPX into the strongest price and breadth strength so far in 2022, shouldn’t one had taken the easier (or path of least resistance) and taken the long bond trade for example, initiated around the same time using a simple ^MOV-TLT trend model?
If one is inclined to use leverage, TMF is 3x TLT for short term trading.
Entry long 11/21/22 100.69 +6.36% currently.
https://toot.community/@ttmarket/109456016596238618
I have shifted from Winter to Spring (bear to bull) this weekend. This is long term not a rally mode.
Here is how I explained it to a few colleagues. As always, this is not investment advice for any individual since I don’t know your risk tolerance or financial circumstances.
“Big News: SPRING has come.
Events have moved the Global market to Spring on its Tactical Factor Rotation. I have resisted doing this even though we had a recent massive everything TWIST event. Why did I resist? Because at a bear market/Winter low, economically sensitive Value and Small Cap are weakest and highlight the bottom signaling TWIST. In the U.S. market, it was Growth Factor weakest and Value/Small Cap were relatively very strong. There was no recession built into the Factor performance, only forecasts of one. American corporate earnings and the U.S. economy were holding in surprisingly well. I missed other important world events.
I now realize my focus was too American-centric. This wasn’t my problem back at the beginning of 2016. The Canadian and most global stock markets had been in an economic slump and bear markets going into 2016. Energy had crashed and the Canadian dollar had plunged. I was setting up for a bear market low and on January 20, 2016, Canada (especially oil prices and the Loonie) had a huge TWIST that signaled the low. The U.S. market continued weak until early February as its Growth Factor oriented index was on a different schedule. In fact, the S&P 500 never fell the 20% bear market minimum while all countries and the U.S. Russell 2000 Small Cap were solidly in bear market territory. The S&P 500 has a very different makeup than other country indexes.
So, Canada and the world were in recessions in 2015-16 and their TWISTs signaled a new global multi-year Value-led bull market when the U.S. did not. Now, Europe is the economically weak area (along with China that has started a bull market) where Value was at the bottom of the four Factors (Value, Growth, Small Cap, Low Volatility) and had a massive TWIST. So, Europe is signaling a Value-led global bull market just as Canada had in 2016. The U.S. will be dragged along. I will now emphasize non-U.S. equities.”
After this, I posted a chart of European Factors (Value, Growth, Small Cap and Low Volatility) that showed Value ranked at the bottom at their low in October and a surge into the lead after the TWIST on November 10. This is classic ‘end of Winter’ Factor action.
This new bull TWIST signal may fail as it did in the 2008 GFC. I will be using a stop loss strategy just in case. A recession might turn nasty or nukes could fly. Who knows?
Thanks for sharing!
Thanks for sharing the long term signal of your factors model. If I understand it correctly, the model is indicating that the bottom is in for US equities. Also, that implies that there will not be a recession in US (Europe is likely in and China is at a minimal growth).
The growth in US is slowing and inflation is still high. Wage inflation in last three months is higher than the y/y wage inflation . Chairman Powell will likely raise the rates, albeit at a slower pace, to cool the labor markets.
How does this macro outlook support the factor signals? Or, is there an alternative macro scenario that explains the signal?
Hard to fathom a U.S. recession can be avoided at this point with the Fed still tightening. This from Charlie Bilello..
“And the yield curve continues to fall deeper into inverted territory, with the 3-Month Treasury bill yield now 0.83% higher than the 10-Year Treasury bond.
In the last 60 years, the only periods with equal or greater inversion:
-2000 (recession in 2001)
-1979-82 (recessions in 1980, 1981-82)
-1974 (recession in 1973-75)”.
Agreed. Stocks bottom in a recession, not before a recession. Only question then is about the magnitude of the drawdown and timing.
Thank you so much Ken!
wishfull thinking self reinforced by technical aspects like it was in August. Factor Rotation, another breath trusts, bullish signals on interest rate scene it is all true but it’s mean nothing without macro context. There is a little upside for markets under current circumstances and historical probabilities about EPS, ability to FED to stay on course over time.
There are possibilities that stocks markets do not fall in meaningful way from now and we are in bull market yet there are little historical evidences such outcome
To stick with the winter/spring analogy I would like to point out that temperatures in central Europe already dropped over the last few days and are projected to drop another 10-15 degrees Celsius next week. Expectations of a mild winter in Europe (and a surprisingly warm October) were parts of the reason for the rally. France has delayed some of their nuclear reactor restarts again recently and contributions from solar and wind are currently at very low levels, which means that Germany still has to burn a lot of natural gas for energy production (share of gas power plants reached 21.7% which is problematic)
The interest rate scene got very bullish last week. The 2024 Fed Futures have fallen a full 1% in a couple of weeks. EXTREMELY bulllish.
Also, Sentimentrader has an indicator of AAA minus BBB spreads that just fell enough to trigger a buy signal for the stock market.
Also CCC spreads plunged one day last week. I will be interesting to see if this carries through.
Credit spreads would likely blow out in a recession scenario which is a concern but this could be largely offset by declining yields in the underlying government bonds. I have been buying good quality long corporates and bond proxies expecting this scenario to play out. High yield, calculated risk.
We have the debt. It’s not going away.
If there is a pivot and rates go down then won’t the yield inversion un-invert? Doesn’t this = recession?
If there is no pivot and rates stay up, won’t debt crush us and lead to a pivot some day?
The only good thing about this is that things feel so dreadful, that who knows, maybe this is a bottom done.
At this point we have to see what prices do. If they motor on through that resist line then maybe we are heading up, but if they get repelled by that resist line, watch for downside.
My bias is that we were heading for problems before the pandemic, and when it happened the massive stimulus reversed things, but now we have to pay the piper, so I am thinking we go down.
Is there an indicator for false narratives? You know like “bad news is good news” or “the market had already discounted the news”.
It’s just what the pundits say.
I am inclined to believe that when bad news is shrugged off, or good news is ignored to think that this has meaning, but it’s likely more of the same with a dash of confirmation bias.
Anything is possible, but with deglobalization, energy issues, geopolitical unrest, budget deficits as far as one can see, debt to the moon….high PEs, is this how bull markets start? Are they anticipating Buzz Lightyear as the next head of the Fed, “QE to infinity and beyond”?
Is this spontaneous gaslighting? WE get bombarded with so many opinions, narratives that our heads are turning in circles.
and we have not had a blowout volume down day, nothing like 2020, 2018, 2008, and many other significant bottoms. So we haven’t had the pukefest yet.
Do we have a rising wedge from mid October?
I wouldn’t bet against Cam. He’s not perfect (no one is), but his track record beats that of anyone else I follow.
Had this feeling that the market was going to tank when Michael Burry posted over the weekend that he is currently not short. Selling was pretty much isolated to the US however, Hang Seng surged and Europe only slightly down. It is difficult for me to see European stocks doing too well with a US recession looming and especially cyclicals in the US getting hit hard, but China looks like it has room to run as many seem to be reluctant to buy still (KWEB started the year around 37 and that would be 10 points above the 200-day while the low was 10 points below the 200-day)
From Mike Wilson’s note:
Although he does not rule out a final run up to 4150, he looks to the level as the “absolute upside” the index can reach. He looks for a break of 3938, which is where the 150 day MA is found, to give bears downside confirmation.
This is just one of those sixth sense predictions that may or may not foretell anything at all. But I’m betting that Cam stays the course on his current bear trade and ends up winning big.
There seems to be some trouble brewing at Blackstone, which is a pretty useless comment by itself, but this is the kind of background that could lead to a more significant drop (compared to just profit taking before the Fed)
My weekend analysis confirms Ken’s observations, though my conclusion is slightly different.
Stay tuned this Saturday.