Preface: Explaining our market timing models
We maintain several market timing models, each with differing time horizons. The “Ultimate Market Timing Model” is a long-term market timing model based on the research outlined in our post, Building the ultimate market timing model. This model tends to generate only a handful of signals each decade.
The Trend Asset Allocation Model is an asset allocation model that applies trend-following principles based on the inputs of global stock and commodity prices. This model has a shorter time horizon and tends to turn over about 4-6 times a year. The performance and full details of a model portfolio based on the out-of-sample signals of the Trend Model can be found here.

My inner trader uses a trading model, which is a blend of price momentum (is the Trend Model becoming more bullish, or bearish?) and overbought/oversold extremes (don’t buy if the trend is overbought, and vice versa). Subscribers receive real-time alerts of model changes, and a hypothetical trading record of the email alerts is updated weekly here. The hypothetical trading record of the trading model of the real-time alerts that began in March 2016 is shown below.

The latest signals of each model are as follows:
- Ultimate market timing model: Sell equities
- Trend Model signal: Neutral
- Trading model: Bearish
Update schedule: I generally update model readings on my site on weekends. I am also on Twitter at @humblestudent and on Mastodon at @humblestudent@toot.community. Subscribers receive real-time alerts of trading model changes, and a hypothetical trading record of those email alerts is shown here.
Subscribers can access the latest signal in real-time here.
Marginally more dovish
Fed policy is still moving markets. The release of the November FOMC minutes confirmed what Fed officials had been telegraphing in the past few weeks, namely that “a substantial majority of participants judged that a slowing in the pace of increase would likely soon be appropriate”. However, “the target range for the federal funds rate…had become more important …than the pace of further increases in the target range”. Fed Funds expectations turned marginally more dovish in the wake of the release and the S&P 500 rallied.

Despite the market’s excitement about the slowing in the pace of rate hikes, Fed Chair Powell sounded a more hawkish tone and said during the November FOMC press conference that he’s “never thought of [a series of milder inflation readings] as the appropriate test for slowing the pace of increases or for identifying the appropriately restrictive level”. Fed Chair Jerome Powell is scheduled to speak at the Brookings Institution on November 30 on the economy and labor markets, just two days before the start of the blackout window for Fed speeches ahead of the December FOMC meeting. That speech is likely to set the tone for the markets for the coming weeks.
Why QT and liquidity matters
As well, investors may have forgotten about the FOMC’s decision to “continue the process of reducing the Federal Reserve’s securities holdings, as described in the Plans for Reducing the Size of the Federal Reserve’s Balance Sheet that the Committee issued in May”, otherwise known as quantitative tightening (QT). While correlation isn’t causation, the size of the Fed’s balance sheet has closely tracked the S&P 500 in the post-COVID Crash era. That’s because liquidity matters to stock prices.

Despite the ongoing quantitative tightening program that’s reduced the size of the Fed’s balance sheet, liquidity conditions have improved because of changes in reverse repos and rundowns in the Treasury General Account. Liquidity conditions are highly correlated to the S&P 500, but the conditions that boosted liquidity should be temporary.

Indeed, Cross Border Capital has argued that the Fed liquidity is exhibiting a staircase pattern, and it’s correlated to the S&P 500.

Analysis from Pictet Asset Management shows that the S&P 500 is trading at a premium to liquidity-implied fair value.

Moreover, non-US M2 growth has been plunging precipitously, which creates headwinds for equity prices..

A recent OECD simulation found that when all countries hike rates in concert, the impact on inflation is less while the negative effect on inflation is higher. These factors may act to keep the Fed more hawkish than what the market expects.

Waiting for Powell
That’s why Powell’s upcoming speech could set the tone for asset prices. Fed policy has affected Treasury yields and the USD, and the S&P 500 has been inversely correlated to the USD for all of 2022.

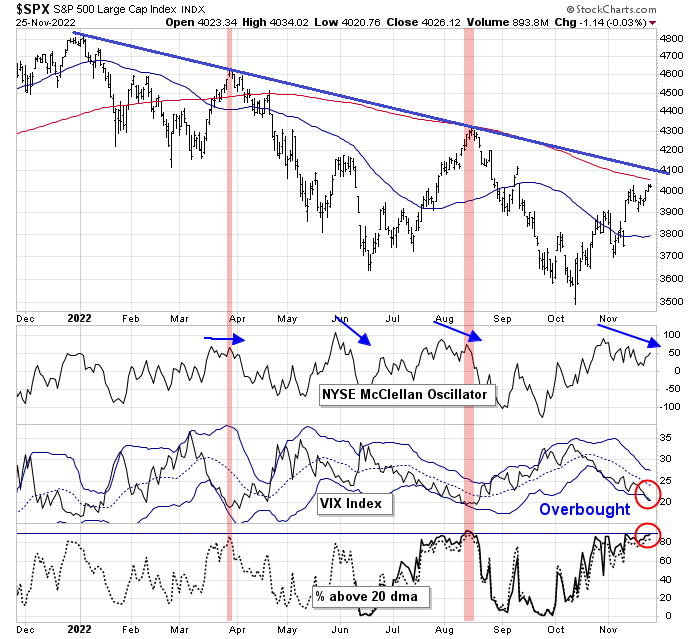
You can tell a lot about the psychology of a market by seeing how it reacts to news. The S&P 500 rose only 0.6% after the release of the FOMC minutes. The index is nearing two key resistance levels, its 200 dma at about 4060, and its falling trend line at about 4080-4100 while exhibiting overbought conditions, as measured by the VIX Index recently breached its lower Bollinger Band and the percentage of S&P 500 stocks above their 50 dma is within a hair of 90%. As well, the NYSE McClellan Oscillator (NYMO) flashes negative divergence through a series of lower highs and lower lows. I interpret these conditions as the market advance is poised to stall.
While there is undoubtedly a dovish contingent within the FOMC, the message from recent Fed speakers has emphasized the risk of under-tightening and allow inflation to get out of control. Powell has sounded a more hawkish tone than other members in the past. his speech sets up a potential pivotal turn for risk appetite into the end of 2022.
The subject of Powell’s speech is the economy and labor markets. I expect that he will reiterate his determination to maintain a tight monetary policy until there is “clear and convincing evidence” that inflation is falling. As well, he will also focus on the labor market, which is still tight, and probably cite low unemployment and strong wage growth as hurdles for pausing interest rate increases. As a reminder, the Chicago Fed National Financial Index is slightly lower, or looser, than the readings at the time of Powell’s Jackson Hole speech that cratered the S&P 500 -3.4% in one day.

In addition to the Powell speech, which is on Wednesday at 1:30 pm ET, the market will see a number of key inflation and labor market data points that could be sources of volatility, namely the PCE report and JOLTS report on Wednesday and the Non-Farm Payroll report Friday.
Disclosure: Long SPXU
Based on what you have written today and yesterday, the market seems to be whistling past the graveyard. Powell’s speech not withstanding.
Is a recession inevitable?
Seems like it, based on multiple indicators. So far, things have gone by the book. Last shoe to drop is the massive rally in TNX, oil prices have declined. Next shoe to drop will be Q4 earnings, in January. Credit cards are being tapped as last resort spending. Housing is on the decline too. Kind of spooky, when everything goes so much by the book.
Thanks! Nonetheless, there are some who think that US will skirt a recession (Yardeni, for one).
Most expectations for recession are in 2023. We are at the doorstep of 2023 already. Why is the market not reflecting the expectations?
Personally, I am positioned overweight on short term treasuries. Thinking about going long 10 year treasuries.
Watch the development in China. First time in 33 years Chinese actually stood up to CCP rule in a not so small scale. A first step. Nevertheless meaningful.
Kudos to Ken for his call on China.