I highlighted a widening gulf between the technical and macro outlook in August (see “Price leads fundamentals”, or “Don’t fight the Fed”?). At the time, the technical indicators were wildly bullish because of strong price momentum, while the macro outlook was cautious. The macro view eventually won out.
A similar divide may be appearing again, albeit not as wide. Technical internals has been pointing to a shift in leadership to value and cyclical sectors, indicating the emergence of cyclical green shoots. Further analysis of technical internals, as well as the macro picture, indicate that hope of a cyclical rebound may be an illusion.
Here’s why.
Technical deterioration
Here are some signs of technical deterioration to ponder. If the market is discounting a cyclical revival, why have the relative performance of defensive sectors been in minor uptrends since the S&P 500 rallied off its October low. Should defensive sectors be losing ground on a relative basis under such circumstances?
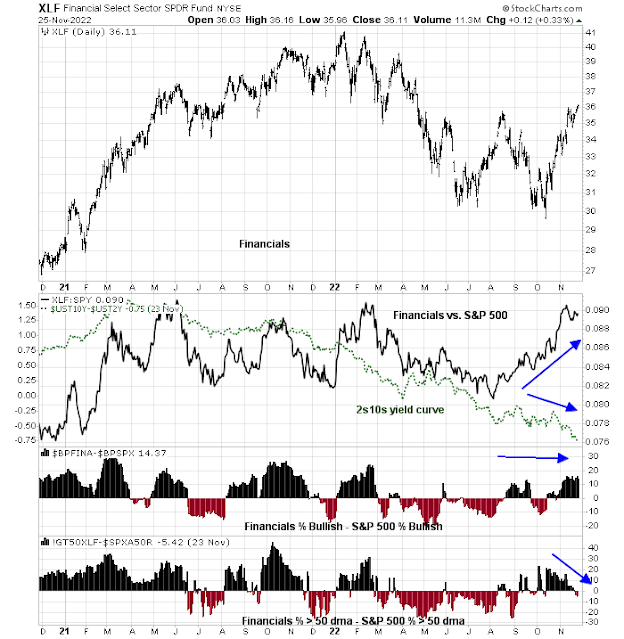
Further analysis of the relative performances of individual sectors reveals inconsistencies. Historically, the relative returns of Financials have been correlated to the shape of the yield curve. Banks tend to borrow short and lend long. A steepening yield curve enhances profitability while a flattening yield curve reduces profitability. As the yield curve flattens, this leads to a negative divergence in the relative strength of Financials. As well, the relative breadth of the sector (bottom two panels) have been flat to down, which is not a positive sign for sector leadership.
The Industrials sector enjoyed a strong recent rally and the sector appears a bit extended. Relative breadth is also weakening, which is another warning sign.
Energy stocks staged upside absolute and relative breakouts, which are positive signs, but relative breadth has been weakening since mid-October.
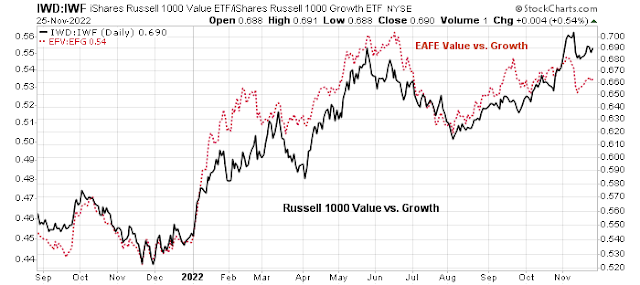
I interpret these charts as the market having second thoughts on the prospect that a cyclical rebound is just around the corner. The US value/growth rebound can be explained mainly by weakness in large-cap growth stocks. Developed international value/growth, as represented by the EAFE Index, has been trading sideways since early September.
Recession ahead
From a top-down macro perspective, the idea of a bottom and cyclical rebound doesn’t make sense. Signs of an impending recession are everywhere. The
November FOMC minutes indicate that “the staff…viewed the possibility that the economy would enter a recession sometime over the next year as almost as likely as the baseline”.
New Deal democrat, who maintains a set of coincident, short-leading, and long-leading indicators, is warning about a recession in H1 2023.
- A significant majority of the short leading indicators, as codified by both the Conference Board and previously by Prof. Geoffrey Moore, have all declined from their peaks.
- This decline has been long enough and strong enough, per past experiences with the onset of recession, to justify a warning that a recession is more likely than not to begin in the next 6 months.
The NDR Index of Coincident Economic Indicators is also flashing a recession signal.
Valuation and earnings risk
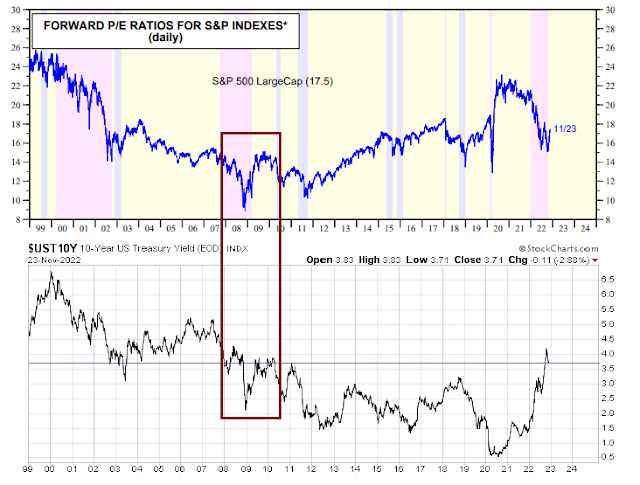
Notwithstanding the risk of deteriorating fundamentals from a recession, the S&P 500 is slightly overpriced based on current earnings estimates. The index is trading at a forward P/E of 17.5, based on bottom-up derived EPS estimates. The last time the 10-year Treasury yield was at similar levels, the market was trading at a P/E range of 13-15, though it fell to a high single-digit multiple during the 2008 panic.

Bottom-up EPS estimates are only starting to fall, but the decline is nowhere near the 15-20% peak-to-trough basis seen in a garden variety recession. According to FactSet, consensus bottom-up derived S&P 500 EPS estimates for 2023 is $232. Bloomberg reported that the average Wall Street strategist estimate is $215, with a high of $232 from Jefferies and a low of $185 from Morgan Stanley. It’s not unusual to see top-down estimates diverge from bottom-up estimates at major economic turning points. Strategists can estimate the economic impact from their top-down models, while individual company analysts have to wait for company guidance to change their estimates. This is a signal that bottom-up aggregated estimates have much further to fall. The combination of an elevated forward P/E ratio with the prospect for further cuts in earnings outlook is an indication that a valuation air pocket is ahead for equity investors.
The bull case
Even though the economic and valuation outlook appears dire, here is the bull case, or at least some mitigating circumstances indicating that any downturn should be mild.
The first is a high level of household savings in developed economies.
A Federal Reserve study confirmed the findings of high savings. While low income households are stressed, middle and high income consumer balance sheets are in good shape.
I would warn, however, that while elevated levels of household savings could act to cushion the effects of a recession, the magnitude of the effect could be relatively minimal. Consider, for example, how the housing market has become the economic cycle. As mortgage rates have surged, strong levels of savings will have a relatively minor effect on the deterioration of housing affordability. As a consequence, housing permits, which lead housing starts, have plummeted.
As property prices have risen dramatically around the world, housing affordability has been a problem in many countries.
Another factor that has raised hopes on Wall Street is the China reopening narrative. It is said that China is undergoing a process of relaxing its Zero COVID policy. As well, Beijing unveiled a 16-point plan to stabilize its property market.
Despite all of the hopes about a COVID policy relaxation, the barriers to a full reopening are considerable. China has taken a different course to address the pandemic compared to the rest of the world as it continues to pursue the lockdown as a primary tool of disease control. Vaccination rates are relatively low compared to other Asian countries, especially among the vulnerable elderly population. A relaxation of COVID restrictions will also require a significant expansion of hospital and ICU capacity, which is not at all evident. The recent steps at relaxation have predictably collapsed. China’s daily case count reached an all-time high and the city of Beijing has relapsed back into the strictest level of quarantine.
Equally concerning is a
Bloomberg report that the Street consensus has shifted to turn bullish on China. The China reopening narrative is extremely vulnerable to disappointment.
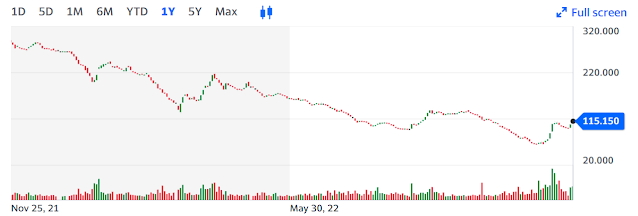
On the property front, I am monitoring the Premia China USD Property Bond ETF (3001.HK). The ETF measures the USD-denominated bonds of Chinese property developers, whose price slide has begun to stabilize, but it’s not showing signs of a strong recovery.
There is one green shoot and right-tailed risk on the horizon that hasn’t been discounted by the markets. The protests in Iran have become more serious and widespread. Tehran has shifted from a counter-protest approach to a counter-insurgency approach, which is an indication that the regime feels it is increasingly threatened. The IRGC has been deployed instead of regular police and it is resorting to deadly force in some instances.
While this is not my base case, a collapse of the Iranian regime would have dramatic geopolitical and financial consequences for the region and the world. It would deprive Russia of a key arms supplier and create more pressure on the Kremlin to sue for peace. As well, a less belligerent government in Tehran would allow Iranian oil to flow more freely and put downward pressure on energy prices, which would be a welcome relief for global central bankers concerned about inflation, and act as an enormous risk-on catalyst for asset prices. Indeed, oil prices have begun to moderate, even without the collapse of the Tehran regime, which I would characterize as a green shoot.

In conclusion, a more detailed analysis of market internals indicates that hopes of a cyclical rebound are beginning to fade. Macro and valuation risk are weighing on equity prices and downside risk remains. As the expectations of a recession are becoming consensus, investors may be better served in a greater allocation to Treasury bonds than stocks over the coming months.


“As the expectations of a recession are becoming consensus, investors may be better served in a greater allocation to Treasury bonds than stocks over the coming months”.
Is it too early to add duration to bond holdings? For the first time, in many years, 10-30 year US bonds are throwing out decent yields.
As short term yields have been lucrative with no risk, we are heavy on 3-6 months treasuries individual bonds. One area that also is enticing is bank preferreds selling at 20% discount to call value, effectively yielding 5.5-6%. In 3-5 years, the return can be 10% annualized.
Thanks. Makes sense.
Anyone knows if there is a high volume of short contracts around TLT?
You can tell by one study that institutional position has been heavily (3 to 1) selling TBT which is the the 3x inverse of TLT, and a separate study showing buying of TMF (TLT bull) by 1.57 to 1.
https://twitter.com/stephenharlinmd/status/1596234965263519745/photo/1
Indeed Iran is the major focus now since it brings upon major ramifications. Many actors are behind the development. Chief among them are Israel and Saudi Arabia, and to lesser extent US. If Iran should have a regime change the axis of evil would have only China and NK left. Essentially only one China against the world. Imagine Russia and Iran oil into the world market again. And SA would behave better without the leverage. Most of the terrorism would disappear in ME. Assad would have to flee. And the last, Venezuela would have a major change in leadership which adds more oil to the market. Cuba and a number of African countries would have to change too.
See, how critical the Iran situation is for the world.
Thanks Alex!