Preface: Explaining our market timing models
We maintain several market timing models, each with differing time horizons. The “Ultimate Market Timing Model” is a long-term market timing model based on the research outlined in our post, Building the ultimate market timing model. This model tends to generate only a handful of signals each decade.
The Trend Asset Allocation Model is an asset allocation model that applies trend-following principles based on the inputs of global stock and commodity prices. This model has a shorter time horizon and tends to turn over about 4-6 times a year. The performance and full details of a model portfolio based on the out-of-sample signals of the Trend Model can be found here.

My inner trader uses a trading model, which is a blend of price momentum (is the Trend Model becoming more bullish, or bearish?) and overbought/oversold extremes (don’t buy if the trend is overbought, and vice versa). Subscribers receive real-time alerts of model changes, and a hypothetical trading record of the email alerts is updated weekly here. The hypothetical trading record of the trading model of the real-time alerts that began in March 2016 is shown below.

The latest signals of each model are as follows:
- Ultimate market timing model: Sell equities
- Trend Model signal: Neutral
- Trading model: Bearish
Update schedule: I generally update model readings on my site on weekends. I am also on Twitter at @humblestudent and on Mastodon at @humblestudent@toot.community. Subscribers receive real-time alerts of trading model changes, and a hypothetical trading record of those email alerts is shown here.
Subscribers can access the latest signal in real time here.
A rejection and a breakout from resistance
Last week, I highlighted the key technical tests that the S&P 500 was about to undergo as it breached its 200 dma and it was nearing a falling trend line. Ultimately, the stock market failed at resistance and pulled back to a key support level. Long Treasury prices, which had been highly correlated with stock prices in 2023, underwent a similar technical test but staged an upside breakout.

The stock/bond ratio is now weakening. Anyone who expected Mr. Bond to die in the face of hawkish Fed policy must be disappointed.
A change in tone
The change in tone in the Treasury market can be attributed to several factors. One is growing evidence in the jobs market. Initial jobless claims are rising, albeit slowing, from their April trough.

Unit labor costs, which were reported last week, decelerated and came in softer than expected. It was a welcome antidote to the upside surprise exhibited by average hourly earnings in the November Non-Farm Payroll report.

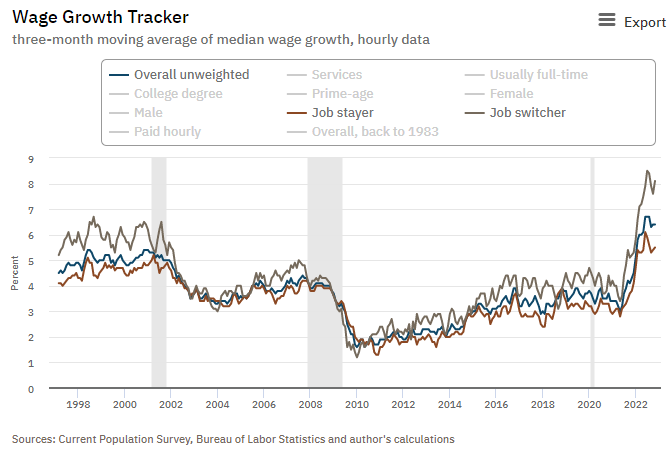
Before you get overly excited, the Atlanta Fed’s wage growth tracker showed that wage growth for job switchers rose from 7.6% in October to 8.1% in November while the overall wage growth rate stayed constant at 6.4%, indicating continued tightness in the labor market.
Oil prices broke a key technical support level, which was a surprise in light of the expected strength in demand from the China reopening narrative.

As well, used car prices continue to weaken, which is positive for disinflation.

Moreover, the Bank of Canada’s dovish rate hike raised hopes of a possible pause in the global rate hike cycle. The BoC increased rates by 50 basis points, but signaled a possible pause in its statement: “Looking ahead, Governing Council will be considering whether the policy interest rate needs to rise further to bring supply and demand back into balance”.
Asset market implications
The divergence between Treasury and equity prices has bearish implications for risk assets. Much of the recent market relationships can’t be relied on anymore.
As an example, the relative performance of large-cap growth stocks has been inversely correlated to Treasury yields because of the long-duration characteristic of growth stocks. As the bond market begins to discount a growth slowdown and probable recession, don’t expect growth to outperform under these circumstances.

Indeed, both the absolute and relative performance of technology stocks are struggling, and relative breadth indicators (bottom two panels) are also lagging behind the S&P 500.

Despite the Treasury market rally, investors should be cautious about high-yield credits. While the relative performance of junk bonds is tracking the performance of the S&P 500, leveraged loans (red dotted line) are flashing warning signs of rising credit risk.

The week ahead
Looking to the week ahead, investors will be watching the November CPI report on Tuesday and the FOMC decision Wednesday. The Cleveland Fed’s inflation nowcast of 0.47% and 0.51% for headline and core CPI respectively are ahead of consensus expectations of 0.3% and 0.4%. The risk of a hot negative surprise is elevated and the market reaction to the PPI print on Friday was a potential preview of the market reaction.

The market is discounting a 50 basis point hike in December, a terminal rate that’s just over 5%, and rate cuts in mid 2023. Keep an eye on expected inflation, and the unemployment rate that will be published in the December Summary of Economic Projections after the FOMC meeting. While the inflation rate will determine the pace of rate hikes, the Fed’s perception of the labor market will determine the timing of rate cuts.

I have argued the lack of recovery in the labor force participation rate by older workers translates into a higher natural unemployment rate, which will keep the job market tight. Market expectations of rate cuts in mid 2023 would be unrealistic under such a scenario. The prospect of a prolonged tight Fed as the labor market stays tight would be bullish for bonds but bearish for stocks.

In conclusion, the Treasury bond market is turning up while the stock market is turning down, which is a condition that hasn’t been seen for much of this year. I believe that this market action is the market’s signal of weaker economic growth, which should be bond bullish and equity bearish. However, much of the short-term outlook will depend on next week’s CPI report and FOMC meeting.
As a reminder, I reiterate my discussion of my trading position exposures from last week:
I would like to add a note about the disclosure of my trading account after discussions with some readers. I disclose the direction of my trading exposure to indicate any potential conflicts. I use leveraged ETFs because the account is a tax-deferred account that does not allow margin trading and my degree of exposure is a relatively small percentage of the account. It emphatically does not represent an endorsement that you should follow my use of these products to trade their own account. Leverage ETFs have a known decay problem that don’t make the suitable for anything other than short-term trading. You have to determine and be responsible for your own risk tolerance and pain thresholds. Your own mileage will and should vary.
Disclosure: Long SPXU
From the October 13th intra-day low the SPY rallied 17.78% . As of now the pullback from the high has been 4.48%. In normal circumstances a pull back in an intermediate rally is an opportunity to buy. However, the year end cross currents of tax selling and holiday volume is distorting the normal ebb and flow of the market. Also, the dollar is at point where it could either breakdown or rally. The risk reward is not there. More so, as traders that have had a good year are not going to take risk at the tail end of the year.
Finally, I would like to wish all my fellow readers a happy and healthy holiday season and good wishes for the new year.
2022 has been the first year of working off the bubble valuations of growth stocks built up over the 2017-2021 period. I expect this will continue. Value did much better this year but that was mainly due to energy stocks soaring. Regular Value will have to perform well going forward without the Energy boost.
The U.S. market has a much higher PE on forecast earnings over non-US, as a legacy of the continuing Growth overvaluation. Global ex-US is much cheaper, especially China and Europe.
My call that the global bear market has ended and Spring arrived, highlights China first, Europe second, EAFE third and U.S. down the list with Canada below it due to its extremely high energy and banks weighting.
Have a great holiday season.
Thanks Cam for your excellent analysis.
We are in this together.
Dilemma: how to conciliate an “undergoing secular rotation from growth to value” with an intermediate perspective, by the end of 2023, of a recession (value=cyclicals exposure with falling earnings) and FED easing monetary policy (which advantages growth equities like zero coupon bonds) ?
What if we are entering secular inflation? With onshoring and energy constraints and fiscal spending we could be in a new era. The boomers are getting social security with COLA, that is money leaking into the general circulation, similar to stimulus checks. So if 10,000 boomers a day are hooking up with SS, that is an extra 180 million or so per year per day (10k x 12 approx 1500) so approx 60 billion of increased SS, minus those who die, but it’s a smaller number. Then one adds COLA to the whole outlay and we are talking a big number which every year will be inflated with COLA. At some point there will be a move away from the USD, the sanctions are giving some an incentive to move away from the USD. What happens to inflation when all those dollars come back and the USD goes down?
People say that because the USD is world reserve currency we have to run a trade deficit, only in the 50s and 60s the US did not run trade deficits and it was still the reserve currency. We have a horrible trade deficit. Unless everyone wants to keep taking our paper just because that’s how we do it, the $ is in trouble and this will also cause inflation.
That TLT has bounced could reflect a move to safety before the market really tanks, and in anticipation of a fed put at some point in 2023.
What if we get persistent higher inflation like in the 70s?
Pre GFC TLT was sub 60 , mostly sub 50.
It might be best to do bonds with a shorter duration, like 2 years and 1 year, then if surprise surprise in 2 years rates are heading up you still get as good a yield as on the longer duration bonds, but you miss out on capital appreciation, but you don’t have the risk of holding a 30 year bond paying 4% while rates are at 10.
I know that a lot of people are talking about how bonds will outperform, but are they right?
Two factors are at play – slowing growth rates vs. lower discount rates. It is difficult to judge the interplay and make categorical statements of a SECULAR move from growth to value. Growth is a broad catch all for Ark type companies to those growing with increasing cash flows. Companies in the latter category may outperform all others.
It is not that Value will perform well but rather that Growth is in a continuous decline from bubble valuation.
Many of the growth names have already declined 80-90% from their peak levels. These companies are still growing and their valuations are no longer in the bubble territory. If the USD peaks here (partly because the Fed may be getting close to the peak FFR while the ECB is still raising rates) and the Fed pause may be only 1-3 months away, the market will begin to anticipate that and investors will come back to these names.
Many of the growth/tech names derive a substantial portion of their rev and earnings from other countries. A weaker USD will be a tailwind here.
Also, growth is likely to be lackluster in 2023 as the US and the world economy feels the lagged effects of higher interest rates. These growth companies could trade at a premium in a growth-starved world, as Cam has noted in the past.
Of course, if we have a major recession or deflation, you are better off just staying in bonds and cash.
So in a nutshell stay flexible and let the game come to you. Only price pays and listen to what market tells you. When in doubt don’t play. Use proper sizing and risk control.
Despite the fact that leveraged ETFs officially have a known decay problem, which makes them unsuitable for anything other than short term trading, it is rather amusing to note how much could have been made by buying TQQQ (a 3X fund for QQQ) at its inception on Feb 11, 2010, and selling at the peak on Nov 22, 2021. (I don’t have exact data, but am just reading from charts at the BigCharts site.) Anyway, TQQQ opened at about .407, and peaked at about 92 less than 12 years later. That’s an increase by a factor of about 226. Of course, this was over a 12 year period that was mainly bullish. And if it had not been so bullish, one could have taken a big loss.
It’s me again. I was just wondering, would it be possible to short a 3X bear fund instead of buying a 3X bull fund? Is that even allowed? If so, that would put the known decay disadvantage of 3X funds to our advantage. The SQQQ fund opened on the same day as the TQQQ fund, back on Feb 11, 2010. And the (adjusted for reverse splits) price shown is about 515,000. Then when TQQQ fund peaked in 2021, SQQQ hit a minimum of about 28.5, dropping by a factor of about 18,070. That’s a much bigger factor than the 226 gain factor for TQQQ. But I’m not clear on the methodology I’d use, if I were allowed to short SQQQ.
If your broker is able to borrow shares for you then you can short 3x bear funds. The borrowing interest is much higher than normal shares. This strategy is so obvious that a lot of small traders are into it. In a year like 2022 with volatilities high 3x bears decay very fast. A simple buy-n-hold would generate good return after interest cost. But using vix as a guide to short/cover generates very high return. Both incurs high tax bill as short-term trades. It’s fun to trade around but if you have a large portfolio it does not make much difference. Long-term holding of good dividend-paying stocks would generate qualified dividends at a much lower tax rate.
The problem in borrowing is that 3x bears decay very fast. So as prices drop you need to short ever increasing share count to generate same amount of profits (more borrowing cost too). And then the fund companies will do large reverse splits to jack up the price. Now you have ever shrinking shares to short. More traders try to borrow from shrinking shares pool. The end game is the close of the funds when the assets are too low that fund companies are not making money from operating them anymore. The best examples are those volatility-based 2x/3x funds. These are the most vicious types. They move much faster than indices-based ultrafunds. They are always in decline because at least 95% of time vix readings are in contango. So you always make money, until a black swan like COVID19 comes along and vix shot up to 85. A group of gong-hos I knew got completely wiped out ( They can hire The Ventures to play the song at a much cheaper price). Check, for example, TVIXF (used to be TVIX). It shot up from like 38/39 to 1000 in very short order. It is now below half dollar. The daily volume drops from tens of millions to a few hundred. Surprisingly it is still open.
The summary is that it is a viable strategy. Just follow your own style with disciplines and risk control.
You’d think that if one shorts both BOIL and KOLD that it would work, but there is the cost of whatever interest and things don’t always track or make sense. Still it sounds relatively neutral to the price of nat gas, but keeping things simple is probably best except for when you want to play casino
12/13/22 08:30 ET
US November CPI +7.1% y/y vs +7.3% expected.
But the SPX futures market (+2.9%) had already known that for more than 24 hours, starting around 12/12/22 04:30 ET. All three VWAP trades in the ES 15 minute model had scored buys before the CPI print.
https://toot.community/@ttmarket/109506692411568619
US dollar index $DXY down more than 1.2% after CPI. Most traders think they can handle the dollar trade, but once loss on loss (large magenta dots) selling begins, it takes a while for a base to form before it can rally. Last time this loss selling happened was in Feb 2016 and the bottom wasn’t in until after Feb 2018.
https://toot.community/@ttmarket/109506798047773164
The candle on ES mini is really ugly. But then if we are slowing and heading for breakage, how can they expect higher prices? Yesterday the VIX was up while the market was up which is unusual. We could get a sharp move down this week. The VIX today is bouncing…crazy but I think that when Powell goes hawkish we will see the recent action as being wrong footed. That could set up a rally for the month end but my guess is we finish the week down a lot.
Today Fed rate announcement at 2 PM ET.
VIX9D -2.74%
VIX3M -1.77%
VIX -1.64% at 22.16 why is VIX dropping going into Fed rate if the Fed mattered so much, yet going into CPI VIX was up +10%?
Prior 2 rate announcements all had VIX above 30, so why has SPX traded around 4000 for 5 weeks if this is still a bear market rally?
Sept. 21, 2022 +75bp
Nov. 2, 2022 +75bp
It is confusing. Perhaps it is a conflict between Santa’s Rally and Fed Pivot vs rates going up.
The VIX has been 19 or more for most of this year, and current levels were mostly at the end stages of a rally.
But if disinflation or deflation/recessions are good for the market, now I’d be confused.
I think the magician is waving the *slowing inflation fed gonna pivot * bunny with one hand while holding the *Looney Tunes Acme mallet* behind his back.
Everything to me says the bear is not dead and will return.
Remember that in past market crashes the Fed aggressively lowered rates and yet the market kept going down, so if we were smart we would fear the pivot.
Another visual for those who read this far…Yosemite Sam walking confidently off a cliff holding his prized *Fed Pivot* brand of wings only to find upon opening a pair of Acme anvils.
So I am expecting the wings to be deployed soon.
Enough people are talking Santa rally, it may not happen, but if it does the market will levitate a while longer