Preface: Explaining our market timing models
We maintain several market timing models, each with differing time horizons. The “
Ultimate Market Timing Model” is a long-term market timing model based on the research outlined in our post,
Building the ultimate market timing model. This model tends to generate only a handful of signals each decade.
The
Trend Asset Allocation Model is an asset allocation model that applies trend-following principles based on the inputs of global stock and commodity prices. This model has a shorter time horizon and tends to turn over about 4-6 times a year. The performance and full details of a model portfolio based on the out-of-sample signals of the Trend Model can be found
here.
My inner trader uses a
trading model, which is a blend of price momentum (is the Trend Model becoming more bullish, or bearish?) and overbought/oversold extremes (don’t buy if the trend is overbought, and vice versa). Subscribers receive real-time alerts of model changes, and a hypothetical trading record of the email alerts is updated weekly
here. The hypothetical trading record of the trading model of the real-time alerts that began in March 2016 is shown below.
The latest signals of each model are as follows:
- Ultimate market timing model: Sell equities
- Trend Model signal: Neutral
- Trading model: Neutral
Update schedule: I generally update model readings on my site on weekends and tweet mid-week observations at @humblestudent. Subscribers receive real-time alerts of trading model changes, and a hypothetical trading record of those email alerts is shown here.
Subscribers can access the latest signal in real time here.
Curb your enthusiasm
Does the soft October CPI report mark the start of a fresh bull? Not so fast!
To be sure, the report was positive in many ways. Most of the strength in core CPI was in services and Owners’ Equivalent Rent (OER) in particular. Rents are a lagging component of CPI and it has been weakening. Eventually, it will show up in actual CPI metrics. In the meantime, monthly core CPI ex-OER continues to show a trend of deceleration.
Mark Hulbert advised investors to curb their enthusiasm. He pointed out that the stock market’s outsized one-day return in response to the softer than expected CPI report is an indication that the bear market is still alive and well.
Despite Thursday’s explosive rally in stocks, it’s likely we’re still mired in a bear market.
In fact, the magnitude of the surge itself suggests the bear is still alive and well.
Consider all trading days since the Nasdaq Composite Index was created in 1971 in which it gained — as it did Thursday — more than 6%. Twenty of 26 of those days prior to Thursday occurred during a bear market, or 77% of the time, according to Ned Davis Research.
Indeed, Rob Hanna at
Quantifable Edges found that market returns after a one-day 5% gain tend to be bearish and volatile.
CPI: Not as good as it looks
Equity bulls should be warned that the positive CPI surprise wasn’t as good as it looks.
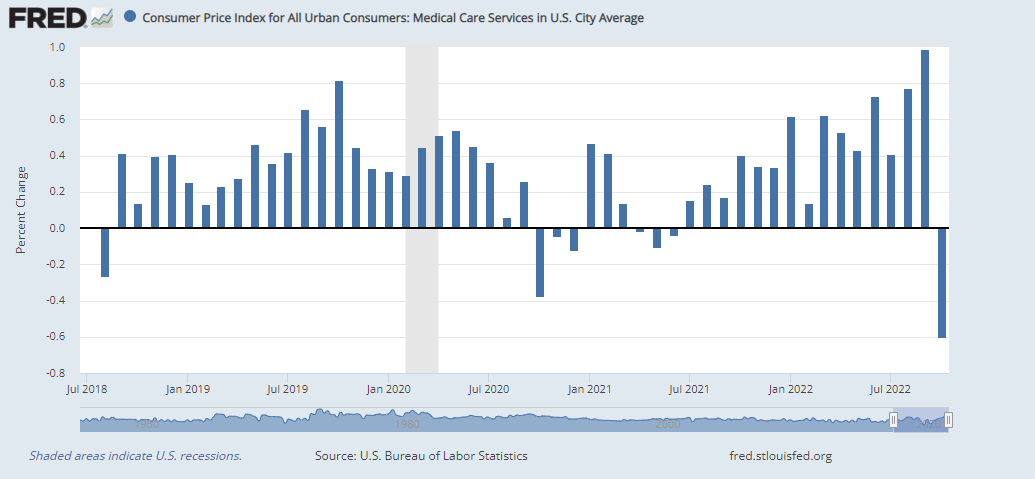
BLS made a technical adjustment to the way it calculates medical insurance for the month of October.
In October 2022, the retained earnings calculation began including premium and benefit expenditures for Medicare Part D. Previously, these Medicare Part D expenditures were not included.
The adjustment made the medical care services component of CPI plunge -0.6% for October and accounted for -0.05% of the -0.2% surprise. This adjustment will not be reflected in PCE, which is the Fed’s preferred inflation metric. For more details, see this
WSJ article from October 25, 2022.
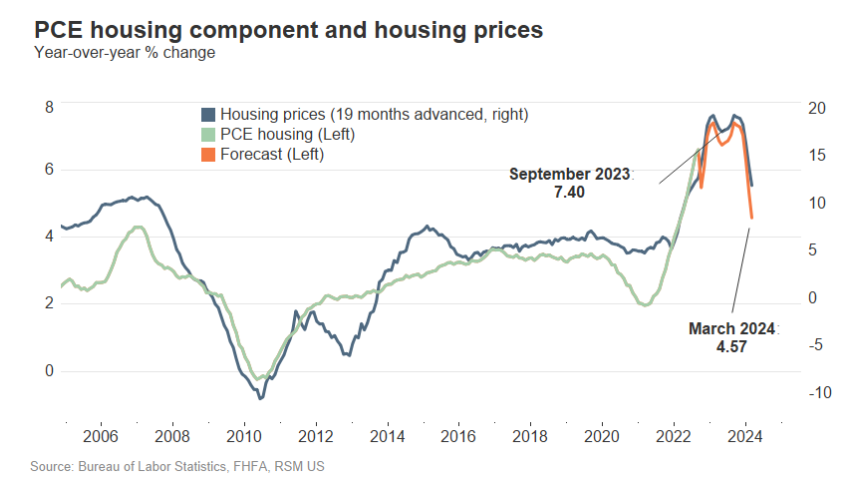
Even though housing is weakening, softness in housing component of inflation won’t be seen for some time in CPI,
RSM found that housing prices lag inflation rates by about 18 months. Inflation will stay elevated for most of 2023 and won’t decline until early 2024.
Bull or bear?
From a technical perspective, investors could view the market’s strength through a bullish or bearish lens. The bullish interpretation is the S&P 500 staged an upside breakout from an inverted head and shoulders neckline at 3900, with an upside measured objective of 4300. The bearish view is the market is overbought on the percentage of S&P 500 stocks above their 20 dma and the advance is about to stall.
I am inclined to believe that risk/reward is unfavorable based on Hanna’s analysis and other factors. Now that the S&P 500 has staged an upside breakout at 3900 and reached the Fibonacci resistance level of about 4000. It will encounter strong resistance at the falling trend line at about 4130. In other words, upside potential is limited.
Negative divergences
I am also seeing warning signs of negative divergences from equity risk appetite factors. The equal-weighted ratio of consumer discretionary to staple stocks has been lagging behind the S&P 500.
Credit market appetite is also flashing warning signals. Even as the S&P 500 staged an upside breakout through 3900, the relative performance of high-yield bonds relative to their duration-equivalent Treasuries lagged and failed to confirm the breakout.
Waiting for the next shoe to drop
Now that most of the mid-term election drama is past and the Republicans have narrow control of the House, the next probable speed bump is a debt ceiling battle. Oxford Economics observed that the Treasury will likely reach its debt limit in December and a debt ceiling increase is required. While it’s technically possible a debt ceiling bill could be passed in the lame duck session while the Democrats have control of both chambers of Congress, it requires the cooperation of the Republicans in the Senate, which is unlikely. Depending on the makeup of the new Republican House caucus, investors could see debt ceiling drama very soon. The recent UK experience shows that markets were unforgiving of fiscal uncertainty.

Even in the absence of a debt ceiling showdown, the stock market is likely to face headwinds into year-end. Fed reserve balances (blue line) have shown a close correlation with the S&P 500, and they have been fairly steady in the past few weeks. The Treasury’s General Account (red line, inverted scale) is likely ramp into year-end ahead of the debt ceiling, which will drain reserves from the system and have an adverse effect on stock prices. Add to that the high probability of tax loss selling in a year when stocks are down, the market will face considerable pressures.

The Goldman Sachs Financial Conditions Index eased considerably in the wake of the risk-on episode. In reaction to the CPI report, the market is now anticipating a 50 bps hike in the December Fed Funds rate and a change in the terminal rate from 500-525 bps to 475-500 bps. While a 50 bps hike is plausible, the reduction in the terminal rate is less likely. As a reminder, here is how Powell responded to the news in the last
post-FOMC press conference that the markets had gone risk-on after the last FOMC meeting.
CHAIR POWELL. We’re not targeting any one or two particular things. Our message should be, what I’m trying to do is make sure that our message is clear, which is that we think we have a ways to go, we have some ground to cover with interest rates before we get to, before we get to that level of interest rates that we think is sufficiently restrictive. And putting that in the statement and identifying that as a goal is an important step.
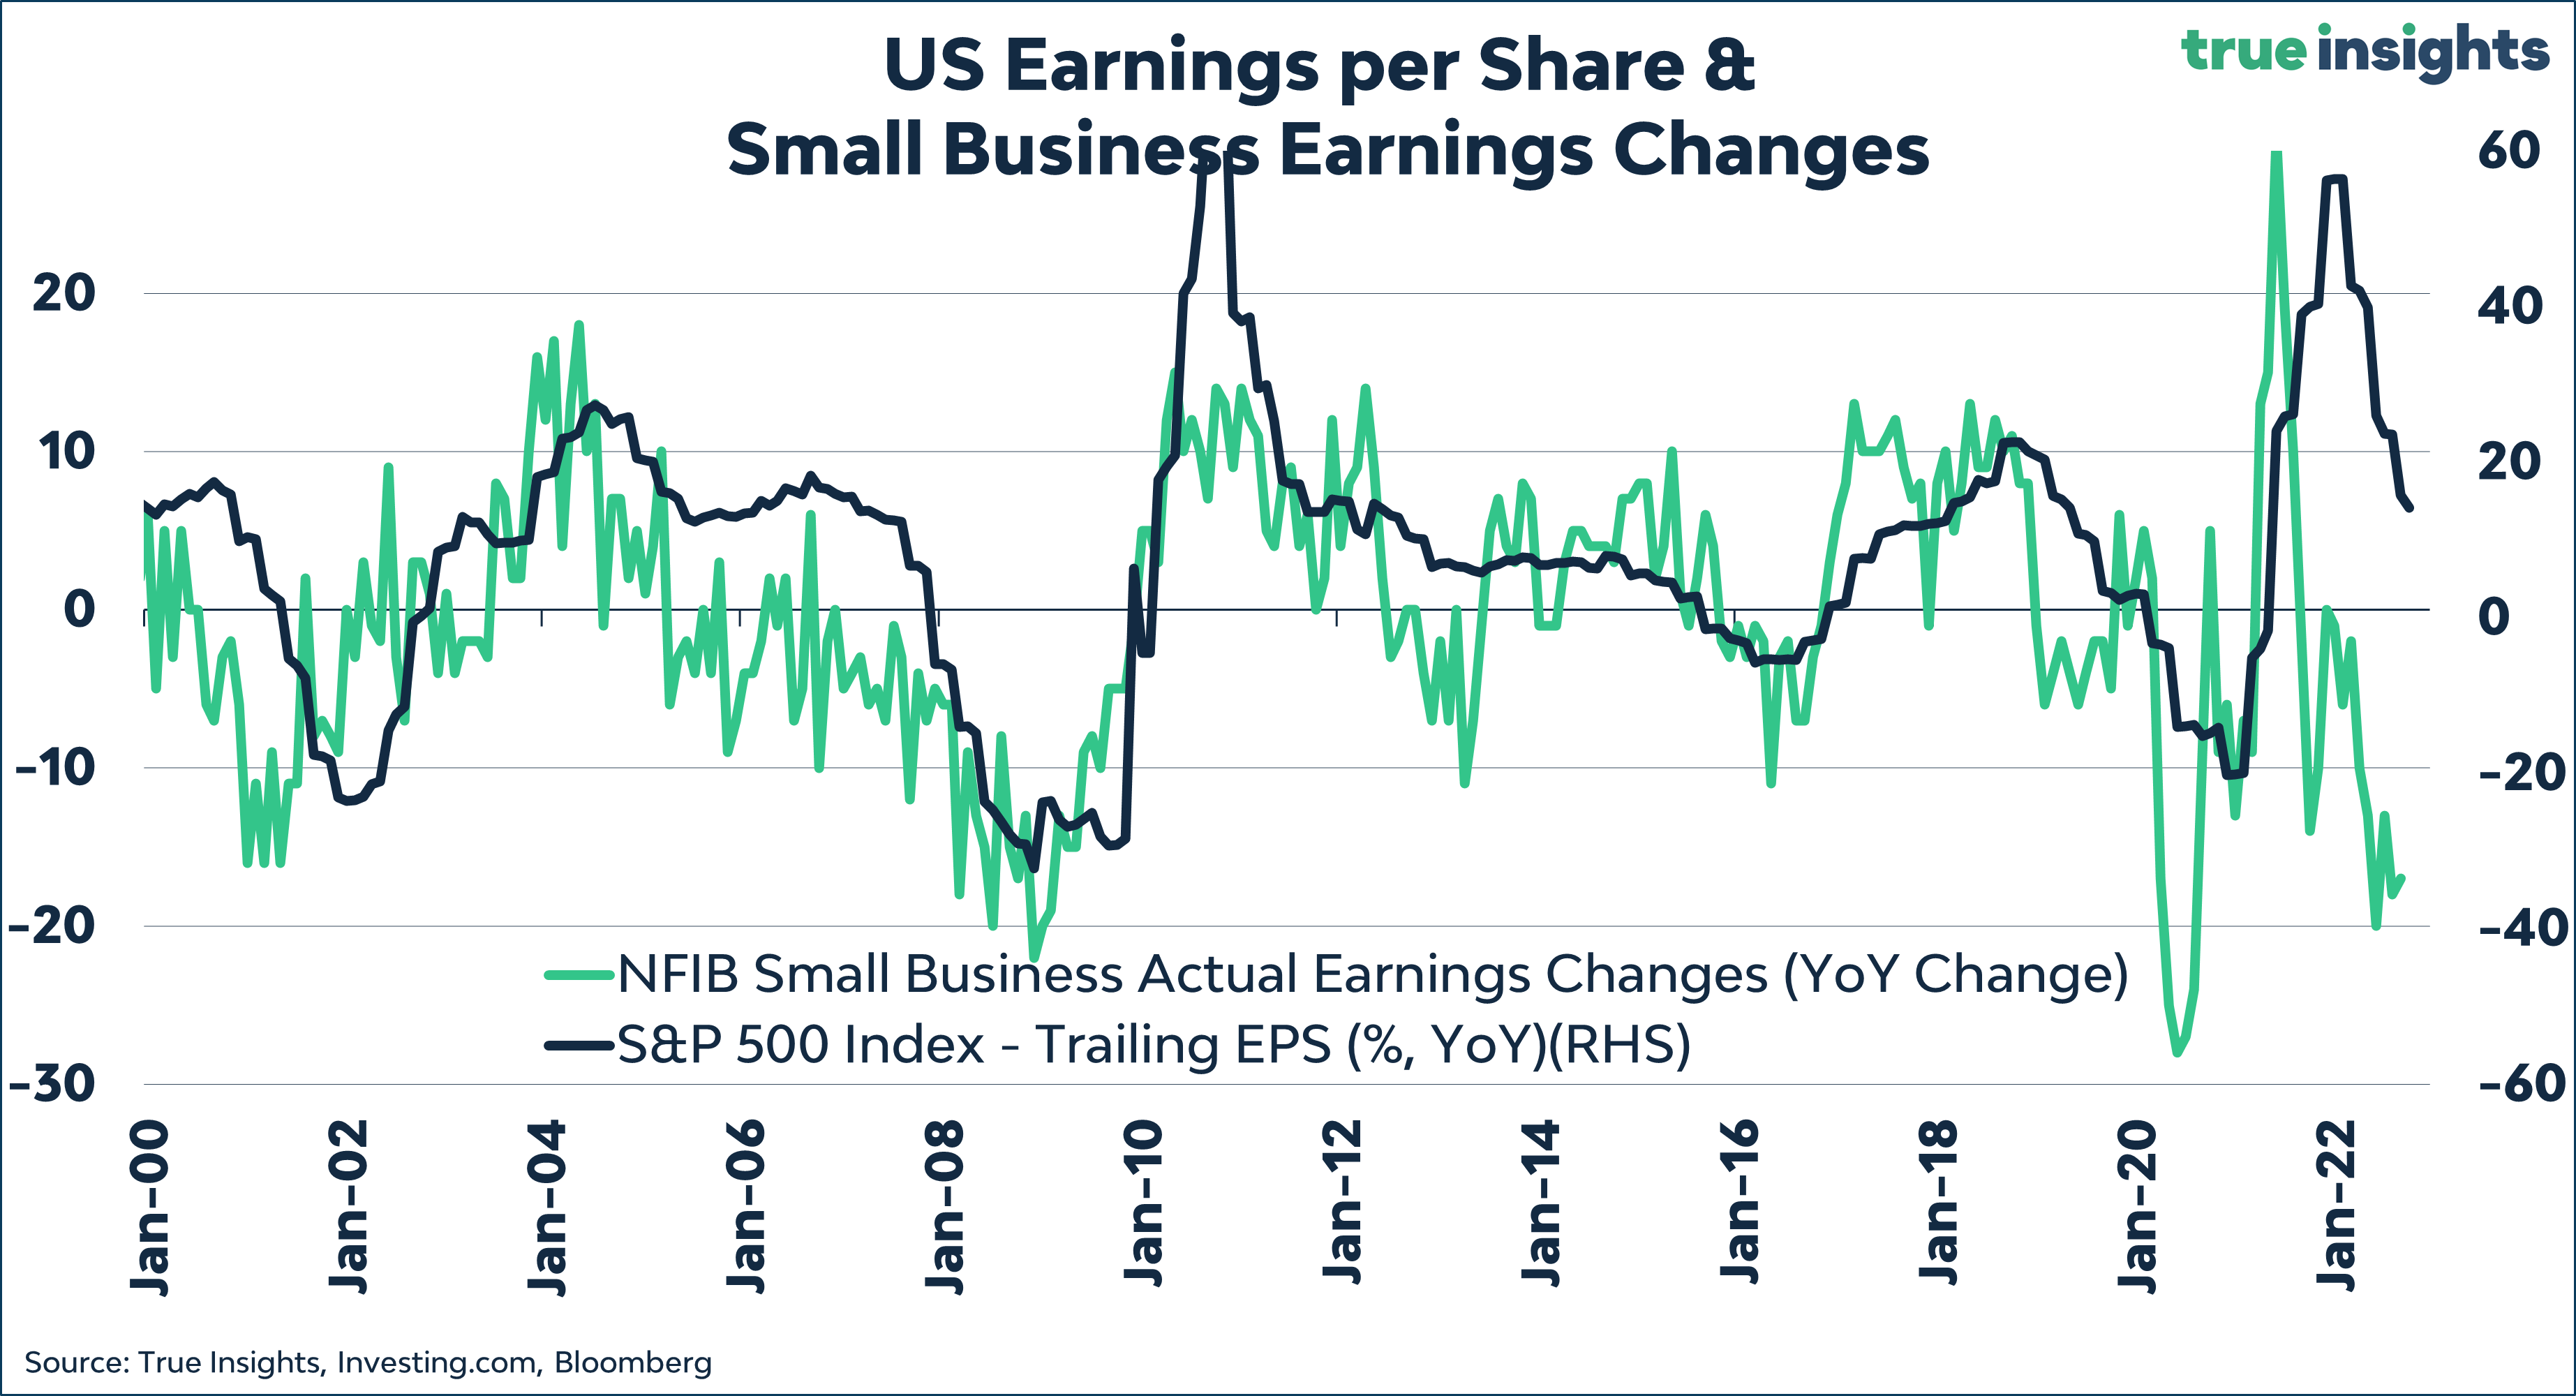
In addition, the market has only begun to respond to the deterioration in economic conditions. The recent
NFIB survey is revealing, as small businesses have little bargaining power and they are therefore sensitive barometers of the economy. Small business earnings growth is tanking, but S&P 500 earnings growth is only decelerating. An earnings recession is just around the corner, and it hasn’t been fully discounted by the market yet.
In conclusion, while the soft CPI report is intermediate-term positive for risk assets, equities face a number of important hurdles before a new bull market can begin. I believe that stocks are undergoing a bear market rally. The S&P 500 will encounter strong resistance at about 4130.


Further to soft CPI print, this excerpt from Derek Holt, Vice-President & Head of Capital Markets Economics, Scotiabank:
Regarding month-over-month annualized inflation readings, “every down month this year like this one has been followed by a surge the next time. I think the massive market reaction is a combination of a hope-driven rally and positioning squeeze much more than is sensible with the modest new evidence at hand. There are two reasons for this. We don’t know if the relatively soft core inflation reading is simply a third head fake this year and at risk of being a repeat of the prior two occasions that were surrounded by otherwise hot readings. Recall that the softer than expected 0.3% m/m core reading in July prompted a sucker’s rally and stridently premature declarations of victory over inflation before a pair of 0.6% prints followed. String a few together and then we’ll see.”
The problem with Hulbert and Hanna’s studies is that they are not looking at them in the context of inflation, therefore it is nearly useless for what happened this week.
There is really no secret to the peak inflation trade and it has happened with regularity for more than a century, even before there has been a Federal reserve. The fact that you saw SPX rallied 5.54% on Thursday morning is a testimony of that fact. In the history of the S&P since 1957 there has only been 3 cases that shared the same criteria with the prior two cases rallied >27% with near zero drawdown, and now 11/10/22:
(buy on close)
01/27/1975, 75.37 +27% 117 trading days
04/22/1980, 103.43 +36% 147 trading days
11/10/2022, 3956.37 ??
Can anyone name the conditions? Obviously CPI is one of them and the other is strength on strength rally. Critics are going to say these are not statistically relevant, but it is not a coincidence that there had only been 3 cases of inflation >8% over the same time period and other conclusion can be derived from studying 120 years of CPI and market history. I will leave it to the students of the markets to figure out the rest of the criteria – all one needs is the inflation rate and market price.
Addendum to this peak inflation analysis. The market may not be 100% efficient or knows everything there is to know about the economy but it comes close and it leads the economy and the Federal Reserve, it always had, it always will. The macro bros like to think they know but they have no entry point, no exit and no duration to their analysis – they are usually jurists or English majors who would like you to buy their thesis, not that there is anything wrong with that, and they lack clarity and the near instantaneous self correction afforded by technical analysis.
If one follows the peak inflation trade analysis above and lowered the CPI threshold to 5% instead of the > 8%, there is an additional data point:
10/6/1982, 125.97 +37% 179 trading days zero drawdown
This October 1982 trade was when inflation finally cracked below 5% which was the first time since March of 1978. Notice all these trades have in common, near zero drawdowns which means if one entered at or near the beginning of the trade, there was nearly no loss during the next 117+ days from the original entry.
As evident from the chart below with the 3 trades from the 1970s and 1982, this concept of strength on strength and peak inflation analysis provided a clear demarcation of bear and bull markets – the magenta dots showed the investors to go short or cash and the cyan dots showed when to accumulate during an inflationary era. This analysis is by no means a suggestion that this is a no risk trade and one will only end up with gains and no losses as there are risks in any trade. Remember what Ned Davis, perhaps the premier technical analyst extant said: “We are in the business of making mistakes. The only difference between the winners and the losers is that the winners make small mistakes, while the losers make big mistakes”.
https://i.imgur.com/1tQRbiL.png
It is great that some in Germany are now reporting that peak inflation is in – but the market has already spoken on 11/10/22 with the index GDAX rallied strength on strength and perhaps even earlier on 11/04/22. This tells you that market participants already knew the data point before it was widely known – GDAX now +20% from the low on 9/29/22. The peak inflation rally is going on all around the world.
https://i.imgur.com/hMNiJBu.png
I don’t know how they do it. Somehow the “herd” gets played.
Consider the 77% red flag of a >6% jump….That means that a bearish stance will be right more than 3/4 of the time. How come we aren’t running for the hills?
Why do they even pretend with a debt ceiling? At this point they are like drug addicts saying that today is their last hit, tomorrow they go straight. So they can pretend it matters?
But the market is not the economy. In the economy I don’t think we get the “bad news is good news” mantra.
Also the growth in GDP since the 60s just keeps slowing down and yet the markets keep going higher. So maybe in the long long run the market goes higher, just like the price of everything will go up, but for now there is a 77% chance we are in a bear market rally….
But what will buybacks and those funds that have to have a position in equities do? How high can this rally go? If one looks at 2000 and 2008, the resistance trendiness are impressive so I would think that 4100 or so will be monster resist and a good place to look for the next leg down
https://www.marketwatch.com/story/feds-waller-says-market-has-overreacted-to-consumer-inflation-data-weve-got-a-long-long-way-to-go-11668381864?mod=home-page
I recall the market advanced with little volatility the last few times debt ceilings were hit (and govt shut down).