Preface: Explaining our market timing models
We maintain several market timing models, each with differing time horizons. The “Ultimate Market Timing Model” is a long-term market timing model based on the research outlined in our post, Building the ultimate market timing model. This model tends to generate only a handful of signals each decade.
The Trend Asset Allocation Model is an asset allocation model that applies trend-following *principles based on the inputs of global stock and commodity prices. This model has a shorter time horizon and tends to turn over about 4-6 times a year. The performance and full details of a model portfolio based on the out-of-sample signals of the Trend Model can be found here.

My inner trader uses a trading model, which is a blend of price momentum (is the Trend Model becoming more bullish, or bearish?) and overbought/oversold extremes (don’t buy if the trend is overbought, and vice versa). Subscribers receive real-time alerts of model changes, and a hypothetical trading record of the email alerts is updated weekly here. The hypothetical trading record of the trading model of the real-time alerts that began in March 2016 is shown below.

The latest signals of each model are as follows:
- Ultimate market timing model: Buy equities (Last changed from “sell” on 28-Jul-2023)
- Trend Model signal: Bullish (Last changed from “neutral” on 28-Jul-2023)
- Trading model: Bullish (Last changed from “neutral” on 16-Aug-2023)
Update schedule: I generally update model readings on my site on weekends. I am also on Twitter at @humblestudent and on Mastodon at @humblestudent@toot.community. Subscribers receive real-time alerts of trading model changes, and a hypothetical trading record of those email alerts is shown here.
Subscribers can access the latest signal in real time here.
Sell the news?
Last week, I suggested that the stock market was ripe for a relief rally in the context of a deeper correction. The rally duly arrived. One of the main events was the earnings report from Nvidia, which blew the doors off Street expectations both on sales and earnings. The market reacted with Nvidia failing to hold its overnight gains. More importantly, the Semiconductor Index weakened below a key relative support level.

Is this a case of buy the rumour, sell the news? What does that mean about the short-term direction for stock prices. Is the relief rally over and a deeper correction about to begin?
An oversold extreme
I had pointed out that the market was extremely stretched to the downside on the NYSE McClellan Oscillator (NYMO), among other indicators. In the past, such oversold extremes usually resolved in short-term rallies. Upon further analysis of recent similar instances, I found that the rebound usually reached a minimum target of a 50% retracement of the previous downdraft, which translated into a S&P 500 level of 4470, the VIX Index reaching its 20 dma on a closing basis and NYMO reaching at least the neutral level. None of these conditions have been met, though they came close on Wednesday.

Arguably, the relief rally has further room to run, but the market’s reaction to the strong Nvidia results was unsettling. Were the near misses on the minimum rally targets good enough to call an end to the bounce?
The bear case
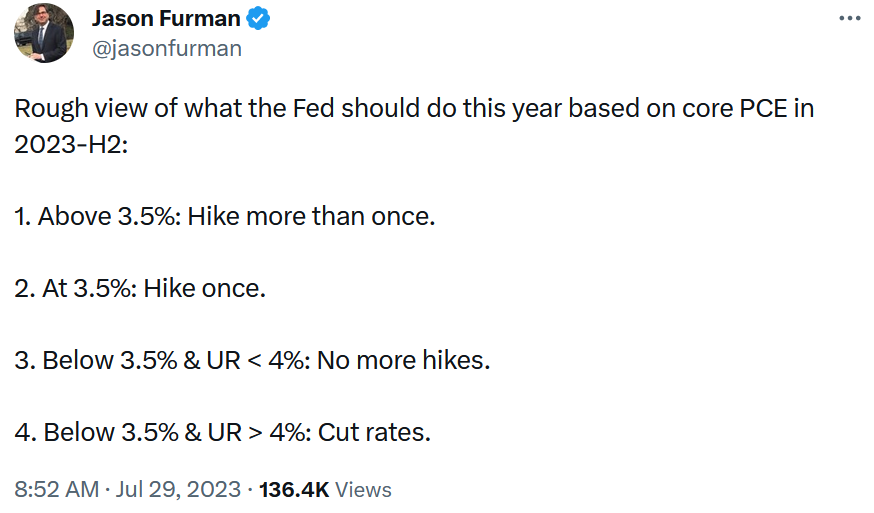
The bear case is easy to make. The bond market began to discount a new rate hike at the October FOMC meeting. Despite this, the stock market rose Friday.

An examination of breadth indicators tells the story of narrow leadership. When the S&P 500 broke out to a new recovery high in June, only the S&P 500 Advance-Decline Line confirmed the breakout. The NYSE A-D Line, the S&P 400 Mid-cap A-D Line and the S&P 600 Small-cap A-D Line all failed to confirm the breakout.

Equally disturbing is the lack of participation by small-cap stocks in the relief rally. In fact, the Russell 2000 is testing a key relative support level (bottom panel).

Sentiment support
On the other hand, sentiment models point to a durable bottom. The NAAIM Exposure Index, which measures the sentiment of RIAs who manage individual investor funds, fell below its 26-week Bollinger Band. This has been a reliable buy signal with an almost perfect track record in the entire history of the NAAIM Exposure Index.

Option sentiment data confirms the extreme bearish readings, which is contrarian bullish. The 10 dma of the CBOE put/call ratio is at a historically elevated level.

Where does that leave us? While breadth indicators argue for a deeper correction, that day may not have arrived just yet. Sentiment is too bearish and should put a floor on stock prices in the short term. The relief rally probably has further room to run.
My inner trader remains long the S&P 500. The usual caveats apply to my trading positions.
I would like to add a note about the disclosure of my trading account after discussions with some readers. I disclose the direction of my trading exposure to indicate any potential conflicts. I use leveraged ETFs because the account is a tax-deferred account that does not allow margin trading and my degree of exposure is a relatively small percentage of the account. It emphatically does not represent an endorsement that you should follow my use of these products to trade their own account. Leverage ETFs have a known decay problem that don’t make the suitable for anything other than short-term trading. You have to determine and be responsible for your own risk tolerance and pain thresholds. Your own mileage will and should vary.
Programming note: I am on holiday next week. Unless the market experiences severe volatility, there will be no mid-week update. Regular commentary will resume next weekend.
Disclosure: Long SPXL