Preface: Explaining our market timing models
We maintain several market timing models, each with differing time horizons. The “
Ultimate Market Timing Model” is a long-term market timing model based on the research outlined in our post,
Building the ultimate market timing model. This model tends to generate only a handful of signals each decade.
The
Trend Asset Allocation Model is an asset allocation model that applies trend-following principles based on the inputs of global stock and commodity prices. This model has a shorter time horizon and tends to turn over about 4-6 times a year. The performance and full details of a model portfolio based on the out-of-sample signals of the Trend Model can be found
here.
My inner trader uses a
trading model, which is a blend of price momentum (is the Trend Model becoming more bullish, or bearish?) and overbought/oversold extremes (don’t buy if the trend is overbought, and vice versa). Subscribers receive real-time alerts of model changes, and a hypothetical trading record of the email alerts is updated weekly
here. The hypothetical trading record of the trading model of the real-time alerts that began in March 2016 is shown below.
The latest signals of each model are as follows:
- Ultimate market timing model: Sell equities
- Trend Model signal: Neutral
- Trading model: Bearish
Update schedule: I generally update model readings on my site on weekends. I am also on Twitter at @humblestudent and on Mastodon at @humblestudent@toot.community. Subscribers receive real-time alerts of trading model changes, and a hypothetical trading record of those email alerts is shown here.
Subscribers can access the latest signal in real time here.
The stock market was choppy on earnings season-induced volatility last week, but a case is being formed for a correction. Even as the S&P 500 tested overhead resistance Friday, it exhibited several negative divergences, which is a signal that the market rally is poised for a stall.
Here are the bull and bear cases.
The bear case
The bear case is the easier one to make.
One troubling bottom-up sign came from the earnings report of Coca-Cola and PepsiCo, both of which reported that they were successfully pursuing price over volume strategies of increasing prices while sacrificing volume growth. While such a strategy increased margins at the company level, it is troubling at the macro level as they are signals of consumer acceptance of higher prices. By implication, inflation may be more difficult to tame than the Fed expects.
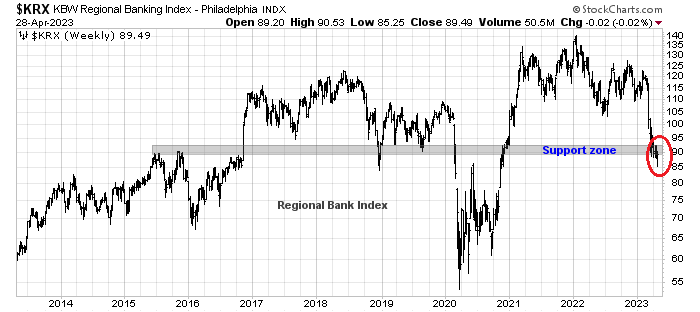
In addition, the banking crisis may not be over. The earnings report from First Republic Bank was a shocker. Even though the bank beat earnings expectations, it reported that deposits fell an astonishing 41% in the first quarter. Regulators have not intervened in hopes that the other banks will hash out a deal to ensure that First Republic doesn’t collapse. In response, the KBW Regional Banking Index is teetering at a key support zone.
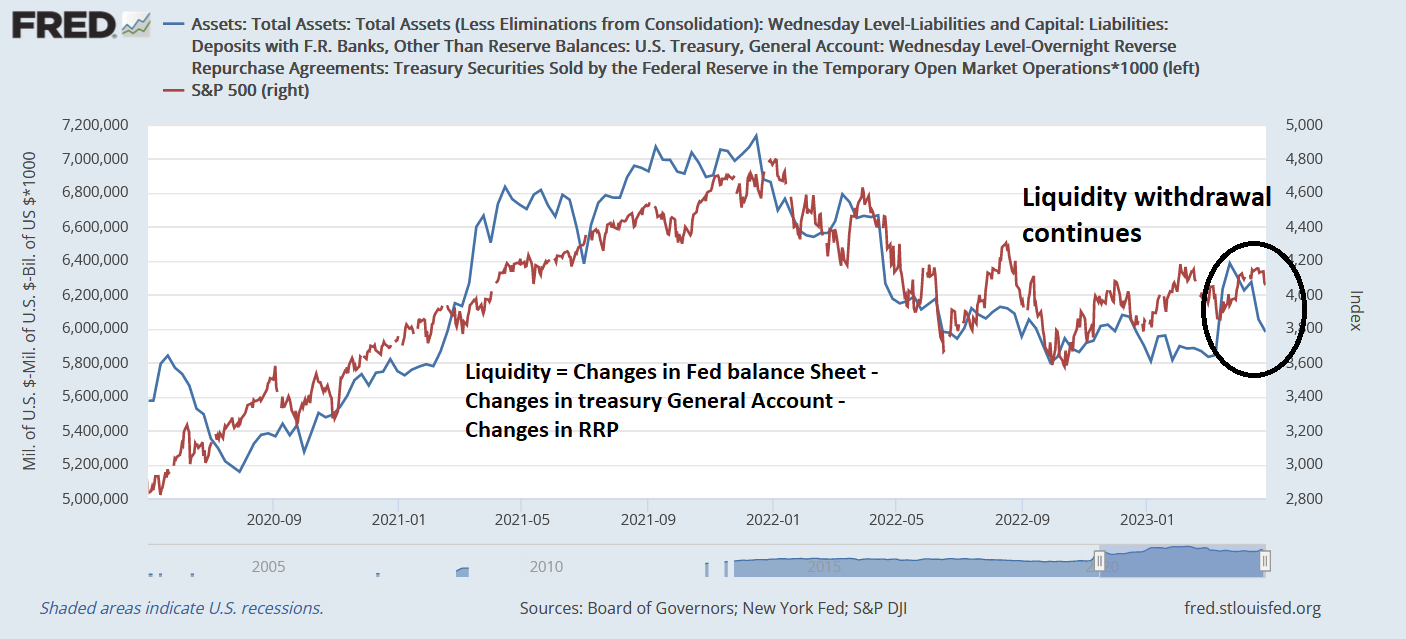
Despite concerns over the banking system, the latest figures show that liquidity is still being withdrawn. In the past, liquidity has either been coincident or slightly led the S&P 500.
Equally worrisome is the narrow leadership exhibited by last week’s market advance. Big Tech took the spotlight and earnings results were strong. The accompanying chart of the S&P 500, the NASDAQ 100 compared to the equal-weighted versions of the same indices, illustrates the outsized influence of megacap stocks, and megacap FANG+ names in particular. For the uninitiated, cap-weighted indices give more weight to the price action of the largest stocks while their equal-weighted counterparts emphasize the price movement of smaller names.
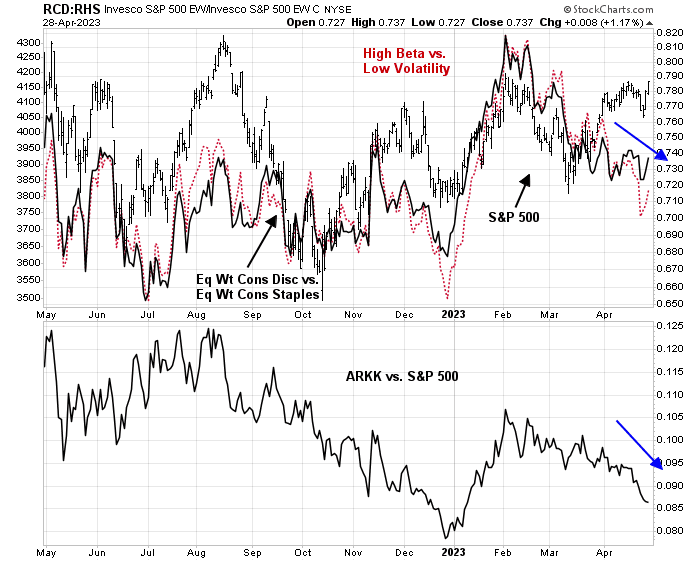
Other indicators, such as equity risk appetite factors, are signaling negative divergences.
Similarly, credit market risk appetite is also not confirming the S&P 500 advance.
The bull case
The file on the bull case is thinner but nevertheless valid.
First, the latest downdraft in regional banking shares should not be treated as an alarm, but a welcome buying opportunity. The KBW Regional Banking Index is exhibiting a series of positive RSI divergences, indicating a loss of downside momentum. Such instances of weakness should be bought and not sold.
From a fundamental perspective, bank regulators have a well-worn playbook on what to do in the case of a banking crisis, and they should be well positioned to act should matters get out of hand. The epicentre of the latest crisis are the small and mid-sized banks, which are within the Fed’s regulatory reach, unlike past crises such as LTCM in 1988, which was a hedge fund problem, and Bear Stearns and Lehman Brothers in 2008, which were broker-dealers, none of which were the kind of organizations that the Fed had a mandate to rescue. More importantly, new reports indicate that the FDIC is preparing to put First Republic Bank under receivership and it has asked other banks, including JPMorgan, and PNC for their bids for First Republic.
From a longer-term perspective, the NYSE McClellan Summation Index is turning up and its stochastic recently recycled from oversold to neutral, which is a buy signal.
In addition, the closely watched Q1 earnings season hasn’t been no earnings catastrophe. FactSet reported that with 53% of S&P 500 companies reporting actual results, 79% of S&P 500 companies reported positive EPS surprises, compared to a 5-year average of 77%, and 74% of S&P 500 companies reported positive revenue surprises, compared to a 5-year average of 69%. These results are not disasters.
The debt ceiling wild card
No analysis of the markets today would be complete without a discussion of the debt ceiling game of chicken in Washington. Estimates of X date, or the date that the U.S. Treasury runs out of money, varies between early June and August. Much depends on 2023 tax receipts, which have been weak compared to 2022.
The accompanying chart shows the S&P 500, the price performance of junk bonds compared to their equivalent-duration Treasuries and the 3-month T-Bill yield in 2011, which was the last episode of debt ceiling havoc. The budget was passed on April 15, 2011, but the debt ceiling was approaching soon after its passage. Treasury estimated an X date of August 2, and after much negotiation the debt ceiling was raised on July 31, two days before the estimated X date. The eventual peak-to-trough S&P 500 drawdown over that episode was -8.2%. However, the 2011 incident is not a perfect comparison as that period coincided with a Greek Crisis that threatened the break-up of the euro currency.

Historically, the U.S. Treasury has drawn down its account at the Fed (TGA) as part of its extraordinary measures to avoid running out of money as a debt ceiling approached; 2023 is no different. As Treasury draws down and spends its cash, it has the effect of injecting liquidity into the banking system, which creates a tailwind for equity prices. As soon as the debt ceiling is raised, TGA balances will gradually rise and liquidity is withdrawn, which is bearish for stocks.
In conclusion, the technical backdrop may be setting up for pullback in the S&P 500. Strong support can be found at the 3770–3800 zone should the market weaken. The bear case consists of renewed doubts over banking system stability, narrow leadership and negative divergences from risk appetite indicators. The bull case consists of positive divergences in the regional banking index, a bullish recycle in NYSI and a relatively benign earnings season.
My inner investor is neutrally positioned between stocks and bonds at about his investment policy target. My inner trader is nervously maintaining his S&P 500 short position. The key market moving event will be the FOMC decision next week. The Fed is expected to raise rates by a quarter-point but possibly hint at a pause at the next meeting, which could be interpreted as bullish, but also signal a higher for longer regime, which would be bearish. How this plays out, I have no idea.
The usual disclaimers apply to my trading positions.
I would like to add a note about the disclosure of my trading account after discussions with some readers. I disclose the direction of my trading exposure to indicate any potential conflicts. I use leveraged ETFs because the account is a tax-deferred account that does not allow margin trading and my degree of exposure is a relatively small percentage of the account. It emphatically does not represent an endorsement that you should follow my use of these products to trade their own account. Leverage ETFs have a known decay problem that don’t make the suitable for anything other than short-term trading. You have to determine and be responsible for your own risk tolerance and pain thresholds. Your own mileage will and should vary.
Disclosure: Long SPXU


How the S&P is compared to the Nasdaq makes me think of Dow theory and how non confirmations of Industrials and Transports.
The market being irrational can interpret the FOMC as bullish or positive, regardless of what Powell says…a pause can be good, or OMG the economy must really be bad, and more hikes can also be spun whichever way you like.
But, consumers have loads of debt, and no printing presses (not even the old fashioned ones that actually used paper). The economy runs on the spending of the majority. Asset bubbles help a few who hold them, but the trickle down is not enough, and in any case the money spent on the trickle down in the full completion of the cycle is likely bad investment, because trickle down spending is not likely to be productive.
It’s part of the reason why Japanese real estate is still going down after over 30 years. You buy an apartment, the price is the price, but whether it goes up or down you still have an apartment. Invest into upgrading it, or the neighborhood and you might have something more valuable, but asset bubbles are just distortions of price.
Nothing goes up forever, but it could have another leg or two or 3 up before it goes down down down.
You’d think that pre-FOMC that there would be caution, but maybe there is short covering just in case we get the “pause” word, but remember that an indebted populace cannot deal with a pause at 5%, free works better and I doubt we have the excuse at present for free.
The only free money that can flow is from the Fed for the next two years. Imagine that with Fed battling inflation at the same time. If it does, all bets are off.
Stop worrying and learn to love trading. Index investing will be more and more vexing and fruitless because the world is changing fast and faster, and old rules are increasingly unreliable and possibly detrimental to your financial health. Maximum randomness on time compression. Better think it as a market of stocks instead of a stock market.
Our fellow readers here are worrying about USD hegemony. Stop worrying. USD is still the cleanest dirty shirt in the laundry basket. All fiats are dirty laundry. This type of media campaign regularly recycles over the decades. It intensifies recently since China is trying to alter the established world order (not by any means a good one but there is no alternative) and Russia is stuck in a quagmire in Ukraine. China and Russia are not friends and now are inconvenient bed fellows by necessity. CCP is very much worried about Putin’s impending collapse.
Recently there has been an absurd amount of short videos showing up on Youtube for the purpose of shaping public opinions. It takes the intelligence of one of my thumbs to know where the sources are from. For the intelligence community this is akin to chatter. You don’t ban them because they give you a measurement of activity level. The correct approach should be radio silence, but the opposite is happening. So there is a smell of desperation in the air. If you are astute in awareness you probably sense something big is brewing.
For the competitiveness among the countries in the world keep faith in the US. From all the info available today, US is going to accelerate, like Usain Bolt. Be prepared to see more and more haters showing up. In the meantime there are lots of trading opportunities to profit from.
Ingjiunn,
Well said!!