Preface: Explaining our market timing models


The latest signals of each model are as follows:
- Ultimate market timing model: Buy equities (Last changed from “sell” on 28-Jul-2023)
- Trend Model signal: Bullish (Last changed from “neutral” on 28-Jul-2023)
- Trading model: Neutral (Last changed from “bullish” on 11-Oct-2023)
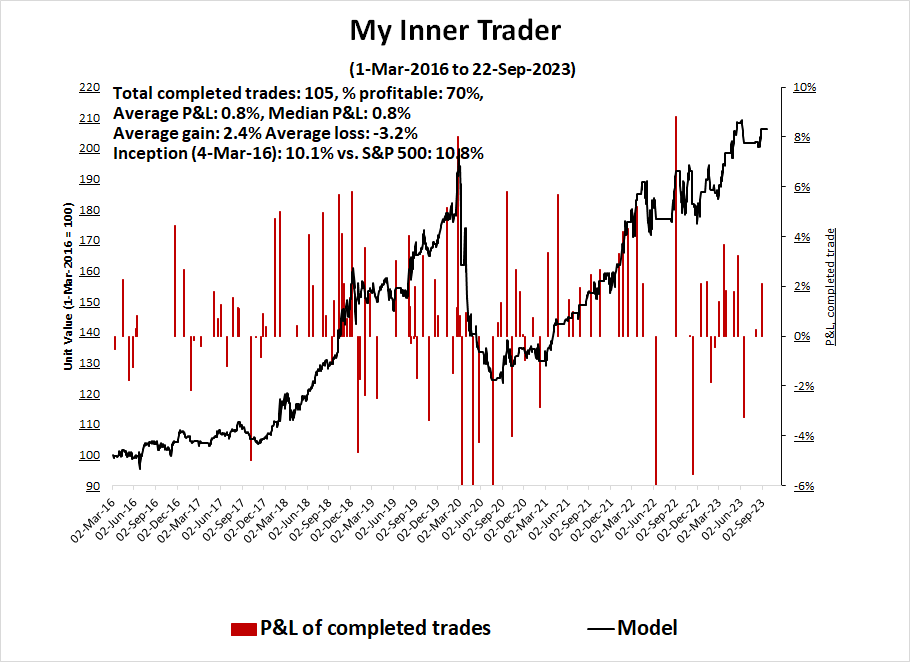
Update schedule: I generally update model readings on my site on weekends. I am also on X/Twitter at @humblestudent. Subscribers receive real-time alerts of trading model changes, and a hypothetical trading record of those email alerts is shown here.
Subscribers can access the latest signal in real time here.
Rebound from a panic bottom
Did you buy in at the bottom? I highlighted how insider purchases (blue line) exceeded insider sales (red line) in late September. Such episodes have signaled low-risk entry points into stocks in the past. Indeed, a market rebound appears to be under way. While past buy signals have resolved in relief rallies, not all were durable.

I believe the current market rebound from the recent lows will be long lasting. Here are three reasons why.
Supportive market structure
Firstly, the technical outlook of the market structure is unabashedly bullish. My models are filled with numerous intermediate-term buy signals. The usually reliable S&P 500 Intermediate Breadth Momentum Oscillator (ITBM) flashed a buy signal last week when its 14-day RSI recycled from oversold to neutral. In the past, ITBM buy signal failures have occurred when the advance was too far advanced, as measured by the percentage of S&P 500 stocks above their 20 dma rising to 65%, which is not the case this time. The history of ITBM shows that the advance generally doesn’t stall until either the 14-day RSI becomes overbought or the percentage of stocks above their 20 dma becomes overbought. I interpret this to mean that this rally has legs.

Looking out longer term, the S&P 500 experienced a breadth wipeout and recycle when the percentage of S&P 500 stocks above their 50 dma fell below and rose back above 10%. Historically, subsequent rallies from such events don’t end until the indicator becomes overbought and reaches at least 80%, indicating further upside potential.

Similarly, the percentage of S&P 500 bullish on point and figure charts fell below 30% and recycled. Past instances in the past 10 years have also generally resolved with strong rallies.

Supportive risk appetite indicators
Risk appetite indicators are also supportive of further stock market strength. The relative performance of global consumer discretionary to staples stocks is holding up remarkably well in the face of the recent market turmoil.

Credit market risk appetite, as measured by the relative performance of junk bonds, is exhibiting a minor positive divergence against the S&P 500..

Supportive sentiment
Sentiment models are also supportive of a strong advance. Marketwatch reported that Goldman Sachs found that CTAs, which are mainly trend-following hedge funds, are short equities at the zero percentile over the last 10 years, and “CTAs are now buyers of SPX in every scenario over the next month”.

In a separate report. Goldman’s prime brokerage arm reported that the aggregate position of U.S. long/short equity hedge funds is at a five-year low.

In other words, a rebound from these oversold levels is likely to set off a FOMO scramble for risk into year-end.
Key risks
The other is geopolitical risk. By now, the world is well aware of the surprise attack on Israel and the Israeli response. A less well-known development is a possible rapprochement between Iran and Saudi Arabia, as evidenced by a readout of a phone call between Saudi Crown Prince Mohammed bin Salman and Iranian President Ebrahim Raisi.
HRH the Crown Prince emphasized that the Kingdom is exerting maximum effort to engage with all international and regional parties to halt the ongoing escalation, and he asserted the Kingdom’s opposition to any form of civilian targeting and the loss of innocent lives.
He stressed the necessity of adhering to the principles of international humanitarian law and expressed deep concern for the dire humanitarian situation in Gaza and its impact on civilians.
HRH the Crown Prince also underscored the Kingdom’s unwavering stance in standing up for the Palestinian Cause and supporting efforts aimed at achieving comprehensive and fair peace that ensures the Palestinian people’s legitimate rights.

The week ahead
Looking to the week ahead, the S&P 500 rally stalled just below its 50 dma and a gap from late September when the VIX Index recycled from above its upper Bollinger Band to its 20 dma.

Earnings season is just kicking off. FactSet reports that forward 12-month EPS estimates are still rising, which is an indicator of bullish positive fundamental momentum.

The reports from major banks were well received by the market. One notable feature of the bank reports is the reduction in loan loss provisions in the face of fears over a slowing economy. This is a cautiously positive sign from the banking industry. In addition, the highly preliminary earnings surprise rate has trended up compared to recent quarters, though it’s very early in Q3 reporting season,

In conclusion, the financial markets are recovering from a very oversold condition and extreme positioning. The recovery has already sparked a minor risk-on rebound. Bullish momentum should continue to spark a FOMO stampede for risk into year-end.

The term premium red herring

Here’s what has happened since the peak in rate anxiety. In the space of a week, the market had to face a blowout jobs report, a surprise Middle East war, and hot PPI and slightly hot CPI prints. In the face of such news, one would think this would put upward pressure on yields. Instead, Treasury yields retreated.
The fall in yields was initially attributable to a flight to safety, but such an explanation doesn’t seem plausible as the USD Index fell in lockstep. If there had been a flight to safety, the USD would have been bid.

What happened? The most reasonable explanation is that the jitters over rising term premium and real rates was a red herring.
A matter of psychology
When I discussed this issue last week, I concluded, “I believe the market is at or near the point of maximum pain and investors should be prepared for a FOMO scramble for bonds and risky assets.” I stand by those remarks.

Higher for longer?
At the height of the bond market panic, I privately pondered at what point would the Fed come to the rescue of the Treasury market in order to prevent a disorderly unwind in the manner of the gilt crisis of 2022. Since then, various Fed officials have spoke and given dovish guidance.
Financial conditions have tightened notably in recent months. But the reasons for the tightening matter. If long-term interest rates remain elevated because of higher term premiums, there may be less need to raise the fed funds rate. However, to the extent that strength in the economy is behind the increase in long-term interest rates, the FOMC may need to do more. So, I will be carefully evaluating both economic and financial developments to assess the extent of additional policy firming that may be appropriate to deliver on the FOMC’s mandate.
Other Fed officials have spoken out and the tone has become more dovish. Boston Fed President Susan Collins believes in taking a more patient approach to monetary policy now that rates are at or near their peak, though further rate increases are still possible. Atlanta Fed President Raphael Bostic added to the dovish tone with remarks that the Fed may have done enough with its interest rate hikes to bring down inflation.
All participants agreed that the Committee was in a position to proceed carefully that policy decisions at every meeting would continue to be based on the totality of incoming information & its implications for the economic outlook as well as the balance of risks,
The September CPI report didn’t move the needle on monetary policy expectations. Core CPI was in line with market expectations and headline CPI was slightly above. Monthly annualized core CPI (blue bars) edged up, and so did the closely watched services ex-shelter CPI (red bars). I interpret this to mean that while the Fed may stay on hold, the possibility of one more rate hike is still on the table.

Putting it all together, the market doesn’t expect any further rate hikes and cuts to begin in mid-2024.

A durable rebound
In conclusion, the turnaround from the recent bond market tantrum was mainly attributable to excessive bearishness rather than to fundamental factors. Bearish sentiment was also evident in the equity market. S&P 500 breadth, as measured by the percentage of stocks above their 50 dma, fell below 10% in the most recent sell-off. While there are no guarantees, recent episodes of similar breadth wipeouts saw the stocks rally until this indicator reached at least 80%, indicating further upside in the coming weeks. Similarly, the 10-year Treasury yield should decline and find support at the 4.25–4.35% zone.

Time for a pause in the rally
Mid-week market update: This relief rally from last week’s lows has been stunning. The stock market shrugged off a hot employment report, a Middle East war that could set off an oil price surge, and a hot PPI print this morning to rise 3.5% off last week’s lows. But it may be time for a pause in the advance. The 5-day RSI is now in overbought territory, and the VIX Index has recycled from above its Bollinger Band to the 20 dma, or the middle of the band.

Still intermediate bullish
While I expect a few days of consolidation, the intermediate-term trend is still up. One supportive data point is the muted response of gasoline prices to the war in the Middle East. Even as oil prices spiked, the gasoline to oil price spread, which is reflective of refining margins, fell. This development should mitigate any inflationary pressures from any oil shock.

The 10-year Treasury yield, which was the source of much anxiety, fell after the onset of the war. Combined with increasingly dovish comments from Fed officials, these developments should be bullish for risk assets.

Credit market risk appetite has also been holding up well. High yield bond relative performance is exhibiting a positive divergence to the S&P 500 – another bullish development.

Subscribers received an alert this morning that my inner trader had taken profits in his long S&P 500 position. As the market is showing signs of a near-term stall, the prudent course of action is to step to the sidelines ahead of tomorrow’s all-important CPI report.
The stock market is likely to consolidate or pull back in the next few days, but the intermediate-term trend is still up.
The out-of-the-box-way to play a relief rally
Preface: Explaining our market timing models

The latest signals of each model are as follows:
- Ultimate market timing model: Buy equities (Last changed from “sell” on 28-Jul-2023)
- Trend Model signal: Bullish (Last changed from “neutral” on 28-Jul-2023)
- Trading model: Bullish (Last changed from “neutral” on 22-Sep-2023)
Update schedule: I generally update model readings on my site on weekends. I am also on X/Twitter at @humblestudent. Subscribers receive real-time alerts of trading model changes, and a hypothetical trading record of those email alerts is shown here.
Subscribers can access the latest signal in real time here.
Poised for a rebound
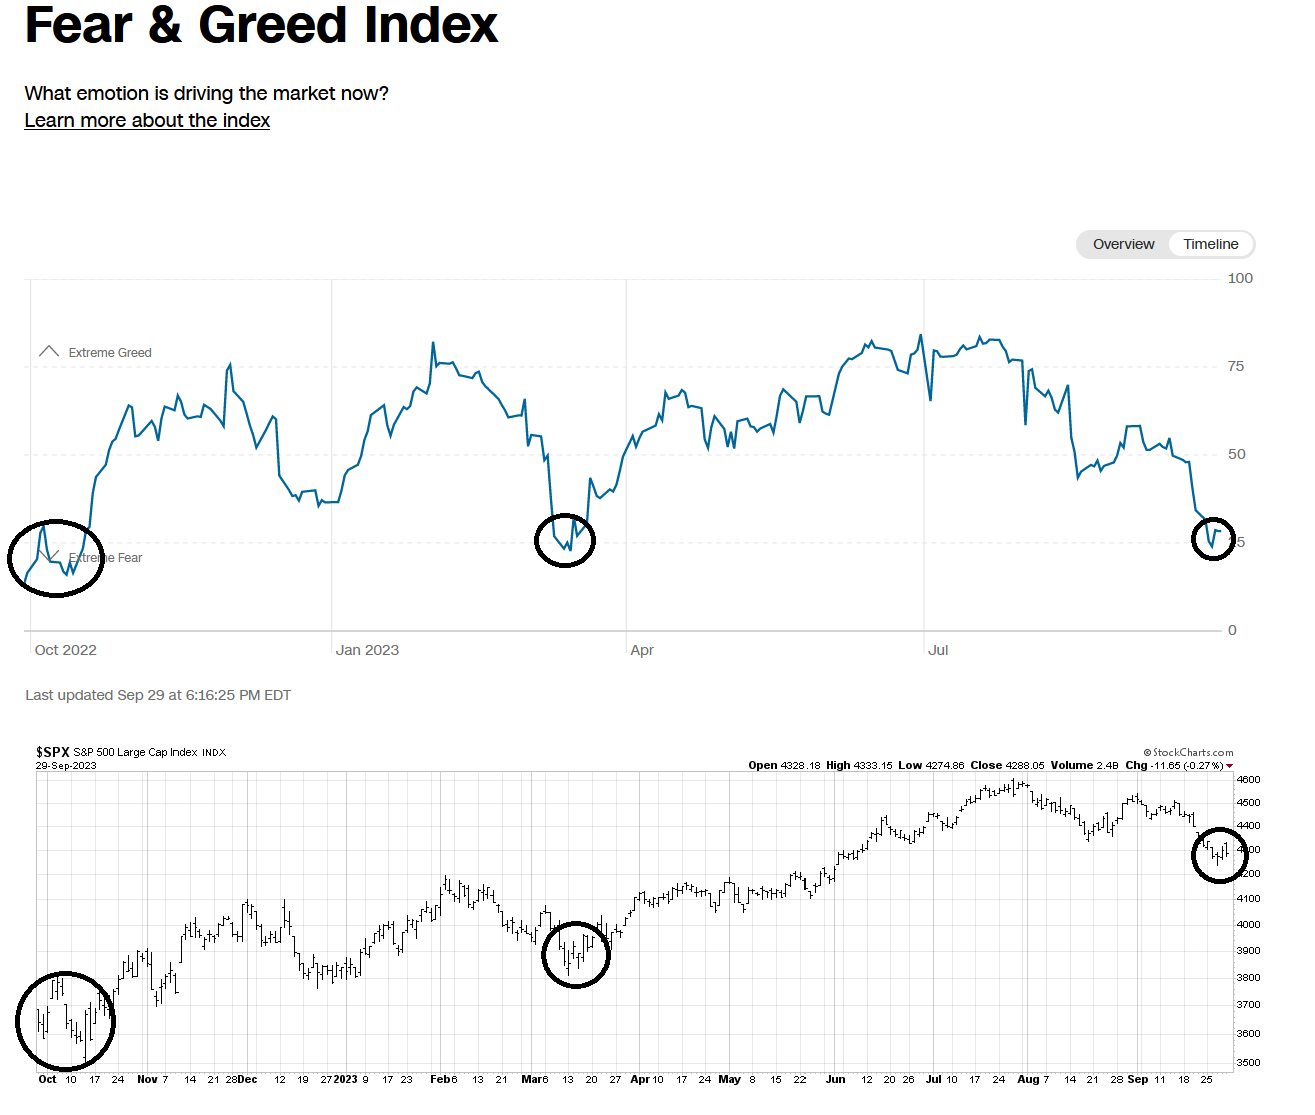
There are numerous signs that the U.S. stock market is oversold, washed out and poised for a FOMO (Fear of Missing Out) rebound. The latest indicator is the CNN Fear & Greed Index, which is beginning to recover from levels seen at the market lows of October 2022 and March 2023.

The stock market has experienced a technical wipeout. Jay Kaeppel at SentimenTrader found that whenever the percentage of S&P 500 stocks fell below 15% (it reached as low as 8.6% last Tuesday), forward returns have been strong, with the exception of the 2008 experience.

Seasonal indicators are also pointing to a market rally. Combined with the deeply oversold nature of the market, the odds favour an imminent “rip your face off” rally to alleviate the oversold condition.

A leadership review
Should the market experience a relief rally, what vehicles could an investor use to position to maximize potential return under such a scenario?

Defensives sectors have also performed poorly on a relative basis, largely because utilities and REITs are interest-sensitive sectors that didn’t respond well to the surge in bond yields.

The relative returns of cyclically sensitive value sectors were mixed. Most were either flat with the index, though energy turned up but weakened when oil prices retreated.

The hidden surprise
The surprising flat relative returns of cyclically sensitive sectors highlighted a hidden investment theme. If these sectors, which should lag during bearish episodes, are flat with the market, does that mean they will perform well during a risk-on period?
In particular, consider how gold has behaved since 2021. Gold has shown an inverse historical relationship to the USD. When the USD started to rally in early 2021, gold should have fallen. Instead, the price of bullion was mainly flat over this period.

Gold mining stocks offer a similar favourable risk-reward ratio. The gold mining to gold ratio is trading at a relative support zone, indicating excessive bearish sentiment. Similarly, the percentage of stocks bullish on point and figure charts is nearing 10%, which is another washed-out area. As well, gold miners to S&P 500 are testing a key relative support level.

From a long-term perspective, the gold to S&P 500 ratio appears to be making a bottom that should favour gold and inflation hedge vehicles over U.S. equities.

An analysis that zooms out from gold to the materials sector also shows a constructive picture. While the relative performance of materials stocks has been flat, relative breadth indicators (bottom two panels) are exhibiting underlying strength. This sector should outperform in a risk-on rebound.

No review of gold and materials without a word on the energy sector. Energy stocks retreated when oil prices weakened, but the recent events in Israel is likely to derail the Saudi-Israeli dialogue and increase the geopolitical premium on oil prices. Longer term, the transition to renewable energy creates significant disincentives for oil producers to invest in new production, which will put a floor on oil prices over the next few years. Oil has become the new tobacco.

Unanswered questions
You can tell a lot about market psychology by the way the market reacts to news. The S&P 500 took a reflex risk-off tone on the blowout jobs report, but turned around and rallied to a gain of 1.8% on the day. Earlier in the week, the market had been exhibiting a series of positive divergence on its 5-day RSI, which was a setup for the relief rally.

However, the eruption of war in the Middle East raises a number of unanswered questions for the trajectory of risk appetite:
- The early knee-jerk reaction on extremely thin CFD market has been a minor risk-off event. Will the risk-off tone continue?
- As wear breaks out, what will be the main beneficiary of safe haven flows, gold or USD assets?
- If flows move into the USD, will that alleviate the upward pressure on Treasury yields?
My Bottom Spotting Model flashed a buy signal about two weeks ago, and the signal was sparked by the extreme oversold nature of the stock market. The market’s risk-on reaction to the NFP beat Friday was a signal that the rebound had begun,

In conclusion, the stock market is oversold, washed out and poised for a FOMO relief rally. My review of sector relative performance leads me to believe that the leadership in a rebound will be led by the cyclically sensitive materials stocks. In particular, gold and gold stocks have defied their inverse correlation to USD strength and could be strong beneficiaries under a relief rally scenario.
My inner trader continues to be bullishly positioned in the S&P 500. The usual disclaimers apply to my trading positions.
I would like to add a note about the disclosure of my trading account after discussions with some readers. I disclose the direction of my trading exposure to indicate any potential conflicts. I use leveraged ETFs because the account is a tax-deferred account that does not allow margin trading and my degree of exposure is a relatively small percentage of the account. It emphatically does not represent an endorsement that you should follow my use of these products to trade their own account. Leverage ETFs have a known decay problem that don’t make the suitable for anything other than short-term trading. You have to determine and be responsible for your own risk tolerance and pain thresholds. Your own mileage will and should vary.
Disclosure: Long SPXL
What’s spooking the bond market, and why it matters to equities
What’s bothering the bond market? The 10-year Treasury yield (blue line) has shot up to levels last seen just before the GFC. The surge in yields has occurred just as investors are seeing better news on inflation. At the same time, core PCE (red line) has been falling. Shouldn’t that be good news for the trajectory of monetary policy? Why are yields rising?

Good news on inflation and employment
The rise in yields is occurring against a backdrop of good news on inflation and employment. Core PCE, which is the Fed’s preferred inflation metric, has been running at a monthly annualized rate of below 3% for the last three months. Core CPI has been similarly tame. The latest reading shows core CPI at a monthly annualized rate of 3.4% and core PCE at 1.8%. The key difference between the two indicators is that CPI measures a price basket paid by the consumer while PCE measures a basket received by businesses.

Despite the strong headlines from the JOLTS and nonfarm payroll report, the jobs market also shows welcome signs of cooling, which is welcome news for the Fed. The market was rattled last week by the surprise uptick in the headline job openings figure in the August JOLTS report, but internals are consistent with a slowing jobs market. Historically, both temp jobs (blue line) and the quits/layoffs ratio (red line) have led nonfarm payroll employment (black line). Quits/layoffs from the JOLTS report shows an albeit noisy cooling trend.

The strength in the nonfarm payroll report looks anomalous. While the establish report beat expectations with a gain of 336,000 jobs, the more volatile household survey showed only a gain of 86,000. However, an outsized 73,000 of the growth came from government jobs and 70,000 from education and health care. Average hourly earnings also missed expectations, indicating tame wage growth. Monthly annualized average hourly earnings have been rising at 2.5% for two consecutive months, which is another indication of disinflation.

In addition, Bloomberg Economics tracked WARN notices, which large firms have to file if they plan to lay off more than 50 people, and found that companies in the sun belt and rust belt are planning mass layoffs.

These data points should be good news for interest rates. Indeed, Fed Funds expectations have steadied to no more rate hikes, followed by rate cuts that begin in mid-2024. In addition, San Francisco Fed President Mary Daly stated that the recent rise in bond yields is roughly equivalent to one rate hike, which reduces the odds of more hikes should current conditions persist.

A rising term premium

Here’s why this matters for equity investors. The S&P 500 has shown a close correlation to TIPS prices, but they began to diverge last September and diverged even further last April. Arguably, the carnage in the bond market should be depressing the S&P 500 down to the 3000–3200 level.

The bull and bear cases
What accounts for the surge in term premium and how should investors position themselves?
The increase in term premium can be attributable to worries over the ballooning fiscal deficit. This raises the question of whether the market would suffer indigestion in absorbing the flood of new Treasury supply.


Strange as it may seem, the best evidence available suggests that the dollar share in China’s reserves has been broadly stable since 2015 (if not a bit before). If a simple adjustment is made for Treasuries held by offshore custodians like Belgium’s Euroclear, China’s reported holdings of U.S. assets look to be basically stable at between $1.8 and $1.9 trillion. After netting out China’s substantial holdings of U.S. equities, China’s holdings of U.S. bonds, after adjusting for China’s suspected Euroclear custodial account, have consistently been around 50 percent of China’s reported reserves. Nothing all that surprising.Notwithstanding Setser’s analysis, I agree. While the China selling story may make sense from a geopolitical viewpoint, as Sino-American relations have deteriorated, it doesn’t from a currency level viewpoint. If China were to undertake a substantial sale of Treasury and Agency paper, where would the money go? If the funds were to be re-invested into another country’s paper, it would show up as USD weakness and strength in the new recipient currency. So far, USD strength has been relentless and I have seen little strength in either the yuan or in other currencies.

Credit event ahead?