America the weak?
This chart of the Euro STOXX 50, MSCI China, and S&P 500 (all in USD) tells a story of differing relative strength. The Euro STOXX 50 has been flat since early February the best relative performer. MSCI China has been correcting, but turned up last week when Hong Kong announced that it was eliminating its COVID mask mandate. In addition, China’s PMI data came in better than expected, indicating expansion. The S&P 500 topped out mid-February and its bottom lagged both Europe and China.
Let’s briefly review the performance and backdrop of each region.
US: Fed-induced headwinds
Good news is bad news in America. January core durable goods rose 0.7% from -0.4% in December (consensus 0.1%). January pending home sales surged by 8.1% (1.0% expected). Q4 unit labor costs rose 3.7% (1.6% expected), which is a signal of wage pressures. However, the Institute of Supply Management (ISM) Manufacturing PMI rose slightly from 47.4 to 47.7 but missed expectations (vs. 48.0 consensus).
Fed Funds futures are discounting three consecutive quarter-point rate hikes, followed by a plateau until early 2024. Past expectations of any rate drops in late 2023 are gone. Powell’s Congressional testimony Tuesday and Wednesday should bring further clarity to Fed Funds expectations and be a source of potential market volatility.
From a bottom-up perspective, the results of Q4 earnings season landed with a thud. The Street is cutting forward 12-month EPS across all market cap bands.
It’s not a pretty picture.
Europe: Still the leader
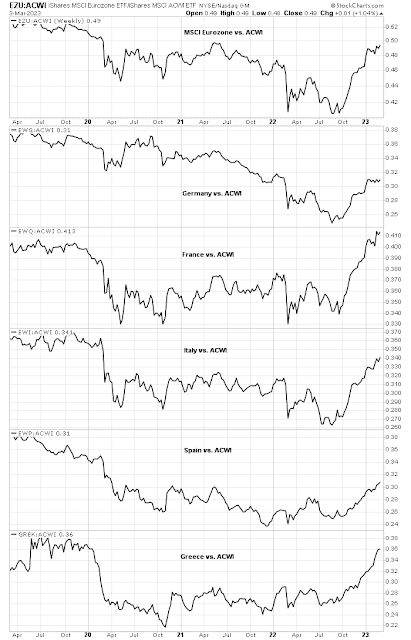
On the other hand, a relative performance analysis shows that eurozone equities have been the leaders since the October bottom. Most notably, standouts were France and Greece (yes, that Greece).
Since the October bottom, industrial and financial stocks have shown the greatest relative strength in Europe, which are signals of cyclical strength.
Bloomberg reported that the “EU Seeks Trade Deal With US to Unlock EV Benefits” and it’s seeking to clinch the outline of an accord that could allow US consumers get IRA tax credit for EU vehicles. Such news could provide a boost to the European auto sector and further improve sentiment for European equities.
China: From re-opening to recovery?
The bull case for China may be evolving from an re-opening story to a recovery story. A
Bloomberg article indicated that China’s reopening trade may be unraveling: “Hedge funds who piled into the rally late last year are rapidly trimming risk. Key stock benchmarks in Hong Kong have fallen more than 10% from their January peaks. Bond outflows have resumed.” Alibaba, which is an approximate proxy for hedge fund exposure to China, recently became oversold based on its 14-day RSI. Oversold conditions in the last year have resolved in price rebounds.
A different
Bloomberg article tells a story of renewed optimism: “China’s Upcoming Congress Spurs Optimism on Mainland Stocks” as “investors say NPC meeting to deliver bigger windfall onshore”. Hong Kong and Chinese equities surged last week when John Lee, the city’s the chief executive, announced eliminated mask mandates.
An analysis of my China re-opening indicators tells a mixed story. On one hand, the pullback in Chinese equities and the equity markets of China’s major Asian partners is very real. While the USD-denominated performance of the Japanese market has moved sideways against the MSCI All-Country World Index (ACWI), other Asian markets have violated either rising relative trend lines or relative support, indicating market expectations of weakness and underperformance.

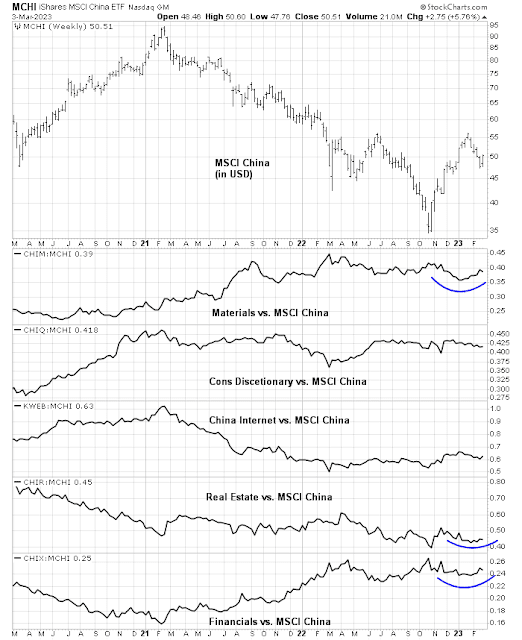
On the other hand, a review of the relative performance of key sectors within the Chinese market leads to a more constructive conclusion. Material stocks are still turning up relative to MSCI China, which is a market signal of strong commodity and materials demand from Chinese infrastructure investment. As well, the real estate and financial sectors are also exhibiting signs of relative turnarounds, which are signals that Beijing’s policies to support the property market are having their effect. However, consumer discretionary and internet stocks, which are dominated by giants like Alibaba and Tencent, whose businesses are sensitive to consumer spending, are still lagging.
This update of the China market internals tells a mixed, but constructive picture. While the initial market enthusiasm over the re-opening story has faded, underlying indicators of a cyclical rebound from market and sentiment indicators are still positive.
The geopolitical tail risk is a Chinese decision to supply arms to Russia. While it has sent non-lethal aid such as helmets and dual-use items such as aircraft parts in the past, sending weapons such as artillery shells to bolster Russia’s depleted stocks would be a game-changer in Sino-Western relations. It risks the imposition of sanctions and could crater the Chinese economy. Goodbye re-opening. Goodbye recovery.
However, if the current trend were to continue, the market should see more concrete signs of a cyclical rebound by Q2. The bull case for China appears to be evolving from a re-opening story, which became overbought and faded, to a longer-lived recovery story.
With Europe still the global leaders and China and Asia showing signs of a bullish turnaround, US equities are likely to be laggards for the remainder of this year.
Look into the week ahead, the S&P 500 regained its 50 dma but it looks extended on the hourly chart. The 5-hour RSI has exceeded 90, which is a level that has led to short-term pullbacks in the last three months. Before you jump on the bulls’ train, Powell’s Congressional testimony Tuesday and Wednesday and Friday’s Jobs Report could be sources of volatility.
My inner investor remains bullishly positioned. Subscribers received an email alert on Friday that my inner trader had taken profits on his long S&P 500 position. He is standing aside for better opportunities. In all likelihood, we will see some weakness in the coming week. Keep an eye on whether positive or negative divergences develop should the index retreat and re-test its early March lows.


Inflation data coming out of several European countries is VERY bad. The ECB may have to hike more and longer.
As my posts have stated, I’m very highly weighted in EAFE (the Value Factor there). It’s worked like charm. This week, I reduced exposure somewhat and bought U.S. T-Bills. To watch Central Bank futures rates in the U.S. and Europe soar (up over 1% in a month!!) while their stock markets rally last week is very weird. It is like gravity has been rescinded. I’m just reducing risk.
The longer term Fed Funds futures going up so much is especially, very troubling as it spells ‘higher for longer’ being accepted by professionals that use Fed Futures. The FANG+ Growth stocks have been leading YTD and higher for longer will eventually pull the rug out from under them from a valuation standpoint.
Market strategists who are economically oriented are witnessing this conundrum of rates soaring and stocks strong and I think their heads are soon going to explode if it keeps up. Their public comments are talking of immanent disaster with recession hitting due to higher rates etc. etc. etc.
A saving grace might happen this Friday. The jobs number could reverse the huge strength of the January number that kicked off the rates surge. I’ve read a few deep dives into the January number where the expert concludes faulty seasonal adjustments caused the shockingly big jobs rise. The Fed has also juggled some of the numbers with inflation that skewed things. They think this faulty data will be exposed going forward. This Friday’s number could do that or start the process. If so, expect stocks to fly. If it’s a continuing strong number, that’s a big problem for stocks AND bonds. Note, I bought T-Bills and not bonds when I reduced equities.
Please note, this is not investment advice for anybody. I don’t know your situation.
January’s data points altered the perception that the downward trend in inflation will continue uninterrupted. More than the job numbers, inflation metrics did not follow the expected trend.
Market swings from one end to the other rapidly – high volatility.
I believe that higher rates will have a big impact on the economy (a recession), inflation will moderate and rates will come down. Economic growth will resume.
It’s likely that recessionary conditions happen in 2023.
I have started to accumulate 10 year treasury bonds on days TNX moves to 4.0+ range. I expect a return of around 10% in less than a year.
Agree with Ken on jobs number. We should not expect the normalization process to be linear, rather stochastic. But market participants mostly are algo-driven, so the positioning swing is extreme. Even the imprecise sentiment survey, e.g. AAII, shows a comical swing from big bull to big bear in just 2-3 weeks. This actually provides big opportunity for short-term trading. Now is the best time for trading. Once the trend gets established the swing will get smaller and smaller. But anyway the market is seeing good time ahead.
For Japan, it is an interesting case. Its economy is finally slowly back to normal after the deflation receded. DXJ etf just made all-time high last Fri.
Cam,
All the best on your eye procedure. Speedy and full recovery to you.