Preface: Explaining our market timing models
We maintain several market timing models, each with differing time horizons. The “
Ultimate Market Timing Model” is a long-term market timing model based on the research outlined in our post,
Building the ultimate market timing model. This model tends to generate only a handful of signals each decade.
The
Trend Asset Allocation Model is an asset allocation model that applies trend-following principles based on the inputs of global stock and commodity prices. This model has a shorter time horizon and tends to turn over about 4-6 times a year. The performance and full details of a model portfolio based on the out-of-sample signals of the Trend Model can be found
here.
My inner trader uses a
trading model, which is a blend of price momentum (is the Trend Model becoming more bullish, or bearish?) and overbought/oversold extremes (don’t buy if the trend is overbought, and vice versa). Subscribers receive real-time alerts of model changes, and a hypothetical trading record of the email alerts is updated weekly
here. The hypothetical trading record of the trading model of the real-time alerts that began in March 2016 is shown below.
The latest signals of each model are as follows:
- Ultimate market timing model: Buy equities
- Trend Model signal: Bullish
- Trading model: Neutral
Update schedule: I generally update model readings on my site on weekends. I am also on Twitter at @humblestudent and on Mastodon at @humblestudent@toot.community. Subscribers receive real-time alerts of trading model changes, and a hypothetical trading record of those email alerts is shown here.
Subscribers can access the latest signal in real time here.
Three golden crosses
Here’s why I am bullish on the outlook for equities. A review of the performance of the major regions shows that all regions have achieved golden crosses, which occurs when the 50 dma rises above the 200 dma to indicate an uptrend. MSCI EAFE is in the lead, followed by the S&P 500, while MSCI Emerging Markets is lagging and it’s violated its 50 dma.
While strong global breadth is constructive for the equity outlook, the nagging question is, “Could EM weakness unravel the bullish narrative?”
Too far, too fast?
A review of global relative return unpacks the story of EM weakness. While developed markets are largely performing well, emerging markets (bottom panel) are running into some trouble. Since China accounts for about one-third of the weight in the EM index, dis-aggregating China from the rest of EM makes some sense. In particular, EM ex-China has fallen to fresh relative lows, which is an ominous sign of relative performance. In other words, China is holding up EM performance, but there are signs that its returns are becoming wobbly.
The latest BoA Global Fund Manager Survey also reveals some troubling sentiment conditions. Global institutional investors had been stampeding into EM equities, which is contrarian bearish.
Drilling down further, the EM stampede appears to be China related. “Long China stocks” is now perceived to be the most crowded trade.
A China reopening report card
There was considerable investor excitement in January over the prospect of China reopening its economy after its zero COVID policy about-face. Here is how the China reopening trade is progressing, based on relative performance real-time market-based data.
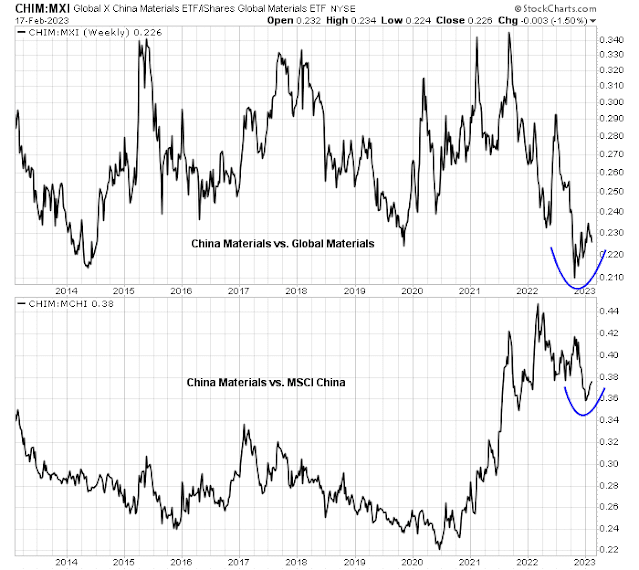
Materials: A successful re-opening would translate into a cyclical rebound, which raises commodity demand and would be reflected in strength in materials stocks.
Consumer Discretionary and Internet: A successful re-opening would translate into increased consumer spending and a better outlook for consumer discretionary and internet stocks, which comprises consumer sensitive companies like Alibaba and Tencent.
Real estate and Financials: One of China’s long-term challenges is the resolution of its debt-induced property bubble. Beijing recently relaxed its “three red lines” criteria, which was designed to rein in rampant property speculation. Can Beijing mitigate the tail-risk of a collapse in its real estate sector?
Here is what’s happened since the publication of that report.
The good news is a constructive long-term relative return patterns of Chinese material stocks. I compared the relationship of Chinese Materials to both Global Materials and MSCI China separately and found that the market is discounting a cyclical rebound in Chinese investments. As China has historically represented dominant for many commodities, rising Chinese infrastructure investment will be bullish for commodities and the equity materials sector. Chinese materials stocks are exhibiting relative rebounds against MSCI China, indicating the market is discounting rising demand, and against global materials stocks, which is another positive sign as rising Chinese materials demand would affect Chinese materials producers first before global producers.
In addition, the fears of another COVID wave of infection that could overwhelm the healthcare system in rural China from Lunar New Year travel have not materialized. A podcast by the
Economist revealed much of rural China had already experienced its COVID wave last December.
On the other hand, consumer discretionary relative performance has been flat to down. The
WSJ reported that consumers are hoarding cash and not borrowing. This is a market signal that China’s consumer spending is not on course for a full recovery and consumer confidence is not recovering. The unwillingness to take on debt is a consequence of the reluctance to buy property. This translates into the relative underperformance of real estate and financial stocks (see chart above showing the flat to negative relative performance of consumer discretionary, internet, real estate, and financial stocks against MSCI China).
The evolution of China’s bank credit tells the story. The household sector can’t drive consumption if consumer credit growth is decelerating. Much of household credit growth goes into real estate, and the real estate sector remain in the doldrums.
Here is how I interpret these readings. While China is undoubtedly reopening and there will be a cyclical rebound effect, as evidenced by the surge in China’s Economic Surprise Index, the equity markets have discounted much of the reopening narrative.
The analysis of the relative performance of China’s equity market and the markets of her major Asian trading partners shows that technical breakdowns of relative uptrends everywhere. The China reopening story is coming back down to earth. In all likelihood, this will resolve in choppy sideways consolidation patterns as the cyclical opening effects will create headwinds for bears.
The longer term outlook for China is more troubling. The
Financial Times reported that Singapore’s GIC, which is the world’s fifth larges sovereign wealth fund, is putting the brakes on private investment in China. GIC is a well-respected institution with deep experience in China, and this pivot sends an ominous signal for China’s long-term investment outlook.
A healthy pullback
The cyclical reopening rebound is still intact and tradable. While it may become a drag on EM equity performance, it is unlikely to derail the equity bullish impulse that just began in 2023. Market internals of US cyclical industries are mostly in relative uptrends, which is supportive of a cyclical equity bull thesis. The current episode of global equity market weakness looks like a healthy pullback.
From a longer term perspective, the copper/gold and semiconductor/S&P 500 ratios serve as useful cyclical indicators and they are correlated to the stock/bond ratio, which is a risk appetite indicator. Both the copper/gold and semiconductor/S&P 500 ratios are confirming the current risk-on environment. This isn’t just a bear market rally, but the start of a fresh bull market.
In the short-term, other equity risk appetite indicators are exhibiting a positive divergence to the S&P 500.
Lastly,
Mark Hulbert observed that NASDAQ market timer sentiment has retreated dramatically since the recent short-term market peak, which is constructive.
It’s remarkable that the market timers aren’t more upbeat. At its peak earlier this month, the Nasdaq Composite was up more than 20% from its late-2022 low, thereby satisfying the semiofficial criterion for what constitutes a new bull market. It’s only modestly below that threshold level now. Yet the market timing community is in a meh mood, and that’s bullish—relative to what we’d normally expect in the wake of a rally as strong as the one recently.
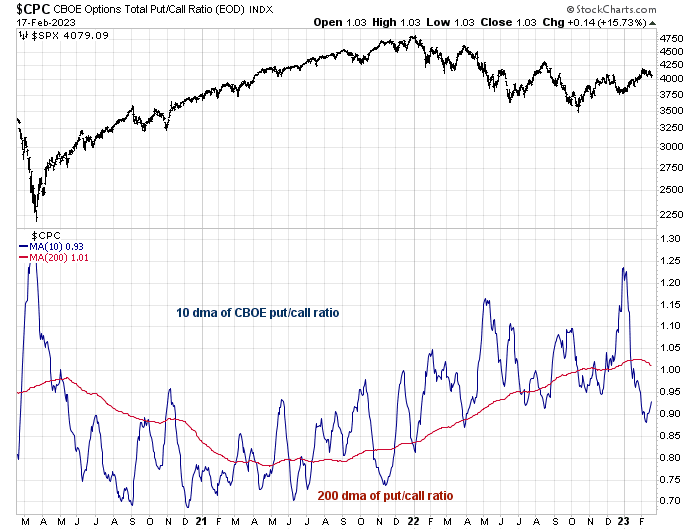
None of this means that the correction is over right now. Sentiment conditions, such as the 10 dma of the put/call ratio, are not signaling panic just yet.
The current global risk-off tone can be attributed to the series of strong US data, such as the jobs report and inflation readings, which, along with hawkish tones from non-voting FOMC members, have sparked a USD rally and equity weakness. Realistically, can anyone expect the blockbuster January jobs report to be followed by another 500K jobs gain in February (see
Was the January Jobs Report a data blip?) or the strong January retail sales print to be followed by another?
The main risk occurs later in the year, when China’s reopening is evident and puts upward pressure on global demand and boosts inflation. The market is expecting the Fed Funds to fall in late 2023, which will be difficult if inflation gets a second wind.
My inner investor remains constructive on the equity outlook and he will be accumulating long positions. My inner trader is standing aside for clearer signs of a tactical opportunity.


Cam, when you say accumulate long positions, do you still like the emphasis on small cap cyclicals? If so, what is a good example of one that is liquid?
Thanks!
When I say accumulate a long position, I am referring to asset allocation between stocks and bonds. While I prefer small caps and cyclical, the degree of overweight is up to you.
February 15, 2023 at 1:41 pm
In my humble opinion the market coming into the CPI data was looking for a very hot number and had bought volatility. Which is now being unwound. Also, the 0DTE option traders are distorting the tape. TSLA is being bulled up by these traders. Unfortunately, what goes up can come down very quickly and sharply. With yields rising and dollar rallying it is counter intuitive for stocks to rally. More so, the Nasdaq. With valuation stretched it is only time before the music stops.
As an update to my previous comment. The severity of the bonds breaking down and the rise in VIX,VXN and the dollar makes me feel that this is more than a garden variety pull back – more an intermediate correction.