Is the U.S. economy headed into recession? The signs are all there.
Even though a recession isn’t part of the Fed’s official forecast, Fed Chair Jerome Powell conceded during the May post-FOMC press conference that the Fed’s staff economists were calling for a mild recession.
Carl Quintanilla of CNBC also reported that the overwhelming consensus from a JPMorgan investor survey was for a recession to begin in H2 2023.
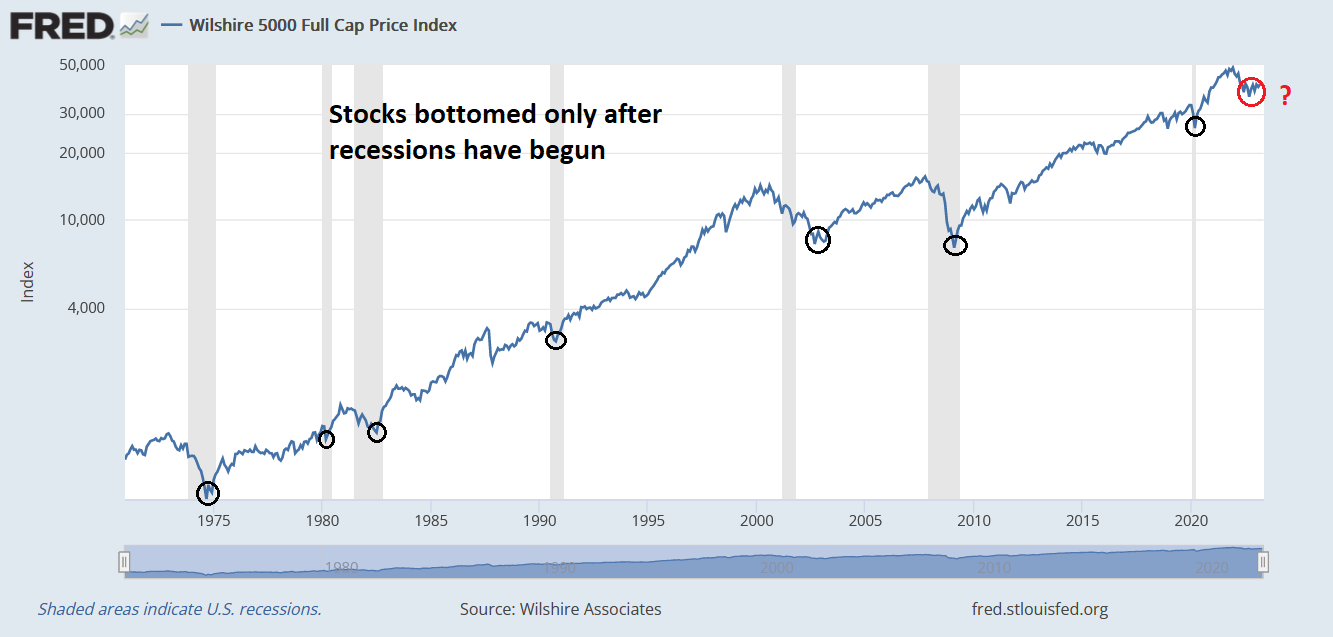
Here’s why the recession question matters. The historical record shows that the stock market only bottomed after recessions have begun (shaded areas are recessions). If the economy does enter a recession, chances are, investors haven’t seen the bottom of the current bear market yet. That doesn’t mean, however, that NBER has to declare a recession before the stock market bottoms as NBER tends to be glacial in its evaluation of economic data and slow to react.
If a recession is ahead, here are some ways to spot the market bottom.
PMI signals
One clue for timing a stock market bottom can be found in the Purchasing Managers’ Indices (PMIs), which are diffusion indices designed to measure whether business conditions are undergoing expansion or contraction. Historically, stock prices haven’t bottomed until ISM Manufacturing PMI has bottomed.
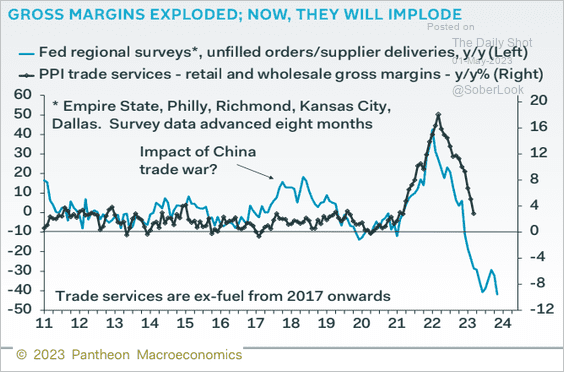
That makes sense from a fundamental perspective. Manufacturing PMI readings have historically led gross margins, which drive earnings and stock prices.
However, this has been an unusual cycle because of the effects of the COVID-19 disruptions. The pandemic initially created a supply shock and supply chain disruption in goods. As supply chains normalized, manufacturing sector activity slowed, which manifested itself in persistently falling manufacturing PMI readings that are below 50, indicating contraction.
By contrast, non-manufacturing, or services, PMI initially cratered with the pandemic shock, but it recovered and ISM non-manufacturing PMI has been flashing a series of above 50 readings, which indicate expansion.
This begs the question of whether the deterioration in manufacturing PMI could be sending false positive signals about a recession if the manufacturing and services economies are so bifurcated.
Labor market signals
Indeed, the Fed has acknowledged that goods inflation is decelerating and shifted its focus to the services economy and the jobs market in particular.
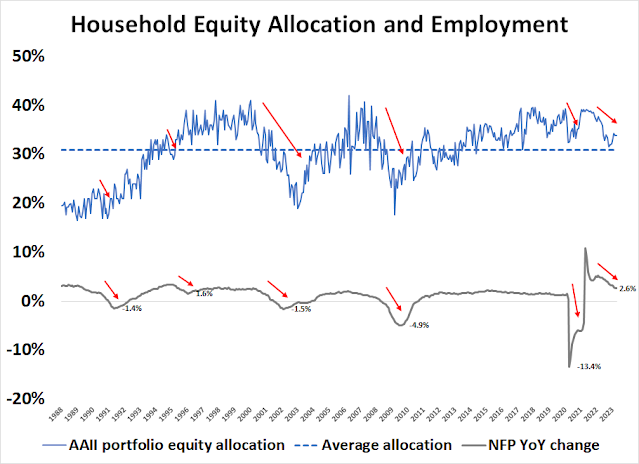
The labor market can offer some clues on the timing of a stock market bottom. I studied investor risk appetite using the monthly AAII asset allocation survey, which is a long data series that asks what investors are doing with their money rather than the weekly survey that asks what they think about the market. The AAII asset allocation survey also offers a way of normalizing risk appetite by measuring household allocations to equities through different economic cycles beginning in 1987. I then compared the equity allocation to the year-over changes in non-farm payroll employment over the study period. Here are the main takeaways from the analysis:
- Equity allocations tend to lead year-over-year changes in NFP, which is another way of saying stock prices are leading indicators and employment is a lagging indicator.
- Recessionary equity bears don’t end until year-over-year changes in NFP turn negative.
- The non-recessionary soft landing of 1995 ended with a year-over-year NFP change of 1.6%; the current reading of 2.6% is well above that level, indicating that stocks may be far from a bottom.
- Despite the recent retreat, equity allocations are still elevated and above their historical average, indicating possible relative downside risk when compared to cash and bonds.
Fed Chair Jerome Powell allowed during the May post-FOMC press conference that “supply and demand in the labour market are coming back into better balance” but still characterized the jobs market as “very tight”. Nevertheless, there are signs that it is slowing. From an anecdotal perspective, mentions of “job cuts” (orange line) compared to the “unemployment rate” (white line) during company earnings calls have reversed positions. Job cut references have been rising while unemployment rate references have stayed relatively stable in the past few months.
In addition, leading indicators of employment are weakening. Temporary jobs and the quits/layoffs ratio from the JOLTS report have historically led NFP employment. The March JOLTS report showed a continuing plunge in quits/layoffs (red line) while temporary jobs have been slowly falling over the past few months.
The April Employment Report showed a strong upside surprise in the headline payroll report and in average hourly earnings. However, temporary jobs continued to decline, which is an ominous sign for the future of employment.
Insider signals
While economic indicators like manufacturing PMI and employment figures can yield some clues to the timing of a stock market bottom, the magnitude of equity downside risk is difficult to estimate because I have no idea how deep a possible recession might be. However, investors can find some clues from insider trading signals.
In the past year, net insider buying (blue line above the red line) has been a good tactical indicator of low-risk entry points into the stock market.
Every market cycle is different. Insiders were early to buy the market during the 2008 market crash.
The pattern of insider activity during the 2011 market bottom was more timely. As a reminder, 2011 was also when that the U.S. Treasury came within two days of running out of funds and defaulting on its debt before lawmakers crafted a deal to raise the debt ceiling. However, that period also coincided with the Greek Crisis which threatened to tear apart the eurozone.
Insiders were also early to buy in October 2019. When the market bottomed in December, they also stepped up and bought. The main takeaway from insider activity is that it can be a useful guide to spotting tactical bottoms, but every cycle is different and net insider buying is no assurance that fundamentals won’t deteriorate further to depress prices.
In conclusion, a recession is likely on the horizon and historically stocks don’t bottom until the economy enters a downturn. Investors can monitor macro indicators like PMI and employment statistics, as well as alternative signals like insider trading to spot the ultimate market bottom.


It’s all about where the money goes, isn’t it?
We have a massive tailwind which I think will only get stronger with time. I will get to that soon.
When there is fear money heads for safety, ZIRP or no ZIRP money finds shelter. This is why when there is fear money hides from risk and equities take a hit, TLT likely rallies. But look SPXU goes up, money is flowing there when the market goes down because it is perceived as safe compared to equities, even though there is a terrible decay in it.
When there is financial repression, bonds and money market funds have less appeal because the yield is so anemic.
But money has to go somewhere, even if it is in your mattress.
This brings us to debt. The gov’t cannot finance it’s debt at 5% for long. It can only do so by taking on more debt or cutting back on spending in a way that nobody is willing to do. Rates will likely go down. Just ask yourself what mortgage rate you would take if you could set it? Zero, negative sounds better but really? Congress is no different.
When money dies, through default (or I should say credit?), or a debt is paid off, if the bank does not issue new loans.
Money can flow out, trade deficits with China, money spent elsewhere by tourists. It’s all about the net effects on the money.
This brings us to the tailwind. Does anyone believe the federal gov’t will run a balanced budget? In the face of the ever increasing entitlement spending on medicare and social security for the next few decades? I don’t.
When the gov’t runs a deficit it means that the private sector runs a surplus. By private I mean ex-gov’t, it could be bondholders in China, just ex-gov’t. So all this money will continue flowing out of the gov’t, where will it go?
When deficits run at 2 trillion a year, it’s a 2 trillion $ tailwind. It doesn’t matter if it’s stimulus checks or defense spending, the money gets into the economy until it is destroyed or sent elsewhere (like if we buy Chinese equities, or bonds, or crypto held by foreign people).
I think most of this money will stick around. It’s why I have to tell myself to stop worrying about P/Es going back to 7 for decades.
What will really crash the market big time is massive global defaults because that could destroy many many trillions.
Unless that happens (if it does, they will put so much fiat into the system that the gold bugs will be vindicated until they get windfall taxation or whatever) we get a recession and a recovery and that tailwind will still be there. Before the 80s the total federal deficit was under 1 trillion, so the annual tailwind was a mild breeze in comparison.
We are in a different paradigm from those days. I have said Sovereign Debt Crisis before in my posts, maybe I need a slower moving word than crisis, call it a SD Conundrum, but we are in one.
This does not mean that we won’t get breathtaking collapses like 2008 or 1987 or 2020, we could, but the tailwinds by then will be gale force and it will be time to buy. In other words, don’t sell at the bottom, but buy, and don’t use margin so that you don’t get forced out.