Preface: Explaining our market timing models


- Ultimate market timing model: Sell equities
- Trend Model signal: Neutral
- Trading model: Neutral
Update schedule: I generally update model readings on my site on weekends. I am also on Twitter at @humblestudent and on Mastodon at @humblestudent@toot.community. Subscribers receive real-time alerts of trading model changes, and a hypothetical trading record of those email alerts is shown here.
Subscribers can access the latest signal in real time here.
A mystery chart
As investors search for evidence of market leadership, here is a mystery chart of constructive patterns of a closely related group. The chart shows patterns of either upside breakouts or pending breakouts out of long multi-year bases.

Faltering U.S. leadership
U.S. equities have been the market leaders since the GFC, but that may be changing. The S&P 500 appears to be undergoing a topping pattern after violating a relative uptrend. The topping patterns are more evident in the relative performance of the NASDAQ 100 and the small-cap Russell 2000. The NASDAQ 100 topped out earlier on a relative basis and the Russell 2000 is flat to down when compared to MSCI All-Country World Index (ACWI).

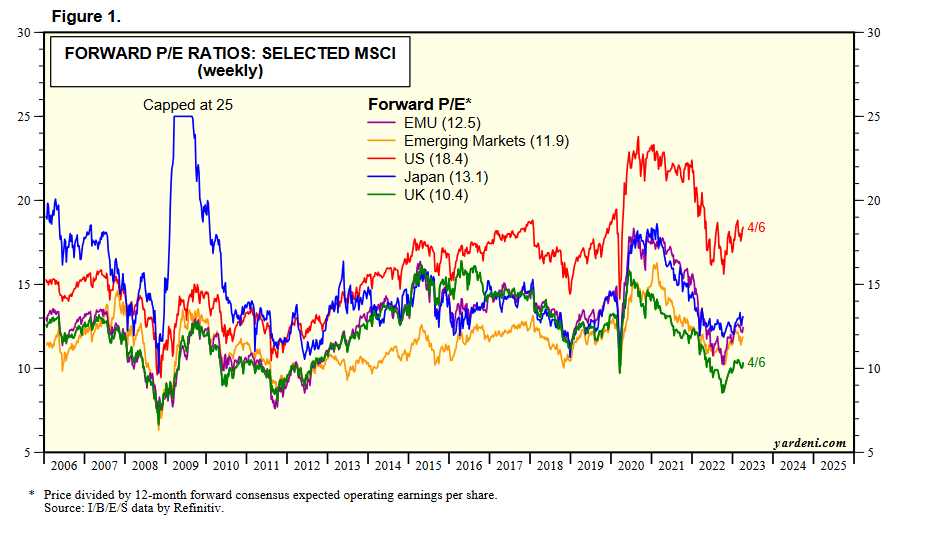
I have repeatedly pointed out the premium forward P/E valuation of U.S. equities. Where can investors find better value and momentum in other parts of the world?
Hello Europe!
Back to our mystery chart. It’s the relative performance of MSCI Eurozone and selected major core and peripheral countries in the eurozone. With the exception of Germany, all countries have staged upside relative breakouts from long bases, indicating strong upside potential.

What about the U.K., which is the cheapest major region by forward P/E. While U.K. equities are exhibiting a similar multi-year relative base and breakout pattern to other eurozone markets, some caution is warranted.

Unexciting Asia
As we move across time zones, the relative performance of Asian markets can best be described as unexciting. Asian markets are flat to down compared to ACWI. The charitable characterization is that they will need more time to base before they can break out.

In the short run, Asian equities may see a boost from Chinese stimulus. Total Social Financing in China has been elevated in the last three months, indicating efforts by Beijing to boost the economy. Keep an eye on the relative performance of China and Hong Kong. Can they stage relative breakouts?

The week ahead
The market action of the S&P 500 last week showed the jittery and headline sensitive nature of market sentiment. The market was flat and marked time on Monday and Tuesday in wait of the closely watched CPI report. When CPI came in slightly softer than expected, prices rallied but retreated later on disappointment over the release of the FOMC minutes. The market then rallied Thursday when PPI came in lower than expected.

That said, hedges are in a crowded short in S&P 500 futures, which will provide buying support and a floor on stock prices in the event of bad news. In the best case, it could spark a FOMO buying panic in the event of good news.

The S&P 500 is testing overhead resistance while exhibiting negative divergences in the 5-day RSI and the NYSE McClellan Oscillator, which are both overbought. Until we see a definitive breakout, the base case remains a choppy range-bound market.

Cam: yesterday you pointed out “ Investors should position themselves by holding a diversified portfolio of stocks and bonds to protect themselves from possible future asset price volatility.” How about cash? My plan is to hold some liquidity parked in an Invesco account (as part of my investment portfolio ) until the debt ceiling issue is resolved. Any thoughts?
I started thinking of Pavlov. Well, most of us know about the experiment, but has anyone done it where the dogs are overstimulated? We are being fed NOISE! Every week, it is FOMC,FOMC minutes, NFP, CPI. There is something that the market can “react” to it seems at least once a week. So we get crazy days like last Wednesday, when really when you think of it, “So what?”. If the CPI jumped or fell 2% or more, OK, but when a .1% move happens, and we all know things change slowly and there are base effects, “So What?” Any excuse to shake the tree is my take on it.
I get it that when Covid was in full form and Costco had no toilet paper, and the shelves at Trader Joes were empty, was not a “So What?” moment.
The downside of modern communication is that we are being bombarded with noise. Fundamentals can be ignored until they matter.
If inflation in 3 years is running at 7% will matter, ditto if it’s running at 2%, but whether next month it changes by 0.1% + or – , means little. Look at any chart, it’s never a line drawn with a ruler (unless it’s the one I had in school that was bashed enough that it was only a ruler in name), so of course all the data we get is bumpy. Never mind that they fudge it later after the fact, which makes it suspect.
Fundamentals do matter, just not right away. Will we get a recession? Probably, and when we do energy stocks, copper stocks will likely sell off, but this does not mean we will stop using energy (ask the Germans) and the EV movement will come to a grinding halt along with the rest of the world’s demand for copper. So when the recession hits and stocks tank put money in sound energy and metals companies and then wait for fundamentals to matter again.
Sunny, you asked yesterday about my investment weather report. America: Winter, Europe and China: Spring.
I totally agree with Cam about Europe. I’m regretting not listening to his caution about China. With a perfect ‘Big Picture ‘ backdrop ìn China, I’m confused as to why it’s stumbling.
Geopolitics is experiencing and historic shift with a profound effect on the dollar dominance. The Middle East is shifting to China. Lulu, President of Brazil goes to Beijing and calls for a BRICS move away from dollar and American policy dominance. Macron goes to Beijing and says Europe shouldn’t put all their eggs in the US basket. Dollar weakness adds to one’s returns in a foreign investment. Chinese influence in Africa is rising. One of their Presidents sais recently, “From China we get a new airport. From the US, we get a lecture. ”
Credit default swaps on US government debt are at about 80 BPS. That is crazy high and reflects worries on the debt ceiling. Foreign investors looking at the American political scene see chaos and division as we move towards the 2024 Presidential election. Read weak dollar.
Thanks very much for sharing!
Traders like me (I hope I am not the only one) is taking
the other side of the trade. Long higher yields, long the dollar, short duration stocks i.e semi-conductor and Nasdaq. There is to much of a consensus for my taste.
Also, I want to point out that interest rates and yields have 10 to 15 year trends. The bull market in lower yields ended when long term yields were 1-2%. With inflation embedded in the economy short term yields going to back to previous lows is wishful thinking.
Sea la vie!!!
I guess Mike Wilson of Morgan Stanley agrees with me. It however does not assure us being right:
The biggest risk could come from a slump in the technology sector if inflation proves sticky and bond yields rise, Wilson said. The tech-heavy Nasdaq 100 has surged 20% this year, partly as the sudden collapse of some regional US lenders sparked a rotation away from banking stocks and toward growth shares. Investors have also been betting that cooling inflation would prompt the Federal Reserve to stop hiking rates soon, but Wilson warned those expectations were premature.
Sometimes things are contrary to expectations.
One we are familiar with is how the 2 year yield drops hard when the market goes in free fall. That one makes sense because something is broken and the UST2Y falls in a failed attempt to stimulate because there is a lag.
Today I saw that homebuilders are more optimistic…in spite of mortgage rates higher, and all other problems. Apparently the housing market does not have the usual mix of new and used homes. The % of used is way down. My thoughts are that people are “locked” with sub 3% mortgages and don’t want to trade homes for another one with a much higher mortgage, so they sit tight and thus the homebuilders have less competition.
All of this to point out a possible contrarian viewpoint. One would think that if mortgage rates drop that this would be positive for homebuilders because new homes become more affordable, but might there be a huge pent up supply from home owners who are no longer locked in? If rates drop, the market likely will also, but maybe homebuilders will get a double whammy. In any case falling mortgage rates could represent a headwind for home builders.