Preface: Explaining our market timing models
We maintain several market timing models, each with differing time horizons. The “Ultimate Market Timing Model” is a long-term market timing model based on the research outlined in our post, Building the ultimate market timing model. This model tends to generate only a handful of signals each decade.
The Trend Asset Allocation Model is an asset allocation model that applies trend-following principles based on the inputs of global stock and commodity prices. This model has a shorter time horizon and tends to turn over about 4-6 times a year. The performance and full details of a model portfolio based on the out-of-sample signals of the Trend Model can be found here.

My inner trader uses a trading model, which is a blend of price momentum (is the Trend Model becoming more bullish, or bearish?) and overbought/oversold extremes (don’t buy if the trend is overbought, and vice versa). Subscribers receive real-time alerts of model changes, and a hypothetical trading record of the email alerts is updated weekly here. The hypothetical trading record of the trading model of the real-time alerts that began in March 2016 is shown below.

The latest signals of each model are as follows:
- Ultimate market timing model: Buy equities
- Trend Model signal: Bullish
- Trading model: Bullish
Update schedule: I generally update model readings on my site on weekends. I am also on Twitter at @humblestudent and on Mastodon at @humblestudent@toot.community. Subscribers receive real-time alerts of trading model changes, and a hypothetical trading record of those email alerts is shown here.
Subscribers can access the latest signal in real time here.
The S&P 500 dodged a technical bullet last week when it successfully tested falling trend line support. Had the trend line been violated, the next major support would have been the 200 wma at about 3730.

Even as the bulls breath sighs of relief, they shouldn’t expect a rally to challenge the old highs just yet. The stock market has sustained considerable technical damage. Textbook technical analysis calls for a period of basing before stock prices can rise in a sustainable way.
Technical damage
Here’s what technical damage looks like. The equal-weighted S&P 500, mid=cap S&P 400, and small-cap Russell 2000 all violated downtrend channels and testing support.

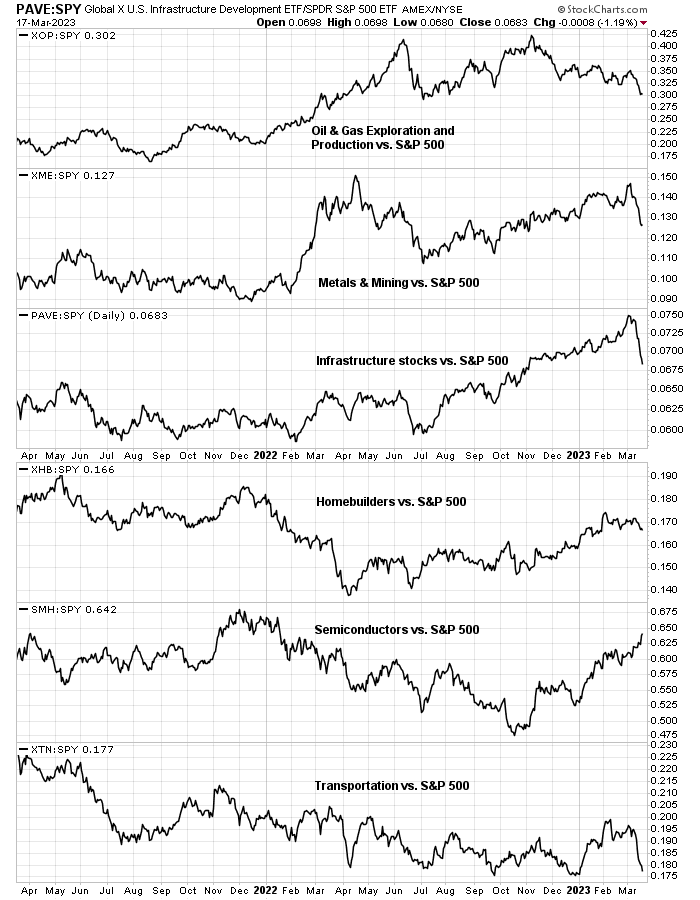
The relative performance of cyclical industries had recently a bright spot for this market, but they’ve all turned down during the latest risk-off episode, with the exception of semiconductors. This is another sign that the bulls have lost control of the tape.
Conversely, the relative performance of defensive sectors are making a comeback, except for real estate.

Silver linings
Even though technical conditions look dire, some silver linings can be found in a dark cloud. First and foremost, insiders are buying the dip. The accompanying chart shows that insider buying activity (blue line) has exceeded insider sales (red line). The history of these “smart investors” since the onset of the COVID Crash shows that they were quite prescient in the purchases.

The Citi Panic/Euphoria Model is now below the October level, which was when the market reached its 12-month low, and it’s in panic territory.

The flood of short-term liquidity unleashed by the Fed should be supportive of stock prices.

Even though large-cap cyclical industries have rolled over on a relative basis, small-cap cyclical sectors have held up well compared to the Russell 2000, which are positive breadth divergences.

The S&P 500 is exhibiting a series of useful positive divergences in the form of the 5-day RSI and the percentage of S&P 500 stocks above their 20 dma. In the past six months, there have been two other similar occurrences, with the basing episodes lasting about 2-3 weeks. If the past is any guide, the bulls will have to wait another 1-2 weeks before the market can break to the upside.

What to watch
Looking to the week ahead, the key even is the FOMC decision on Wednesday. For traders, there are two key indicators to watch.
The first is the price action of the regional banks, which has become an open wound for investors. The KBW Regional Bank Index needs to hold long-term support as a pre-condition for the stock market to sustainably rally.

Nick Timiraos of the WSJ pointed out that the latest update from the Fed suggests that most of the liquidity provided to the banking system went to Silicon Valley Bank (San Francisco Fed) and Signature Bank (NY Fed). There was little demand for funds from the other Fed districts. Despite the market’s fears of contagion, the crisis appears to be contained for now.

The second is the USD Index. The USD has been inversely correlated to the S&P 500. Despite the financial turmoil, the USD hasn’t staged an upside breakout, which is constructive development for risk assets. In the short run, the direction of the greenback will depend on the market perception of Federal Reserve actions.

By the book, the recent risk-off episode would result in a mechanical downgrade of the Trend Asset Allocation Model from bullish to neutral. But the markets have been extremely volatile. The MOVE Index, which measures the volatility of the bond market, has spiked to GFC levels. I am therefore waiting another week for the market to react and digest the FOMC decision to before changing the model reading to avoid any possible whipsaws.

In other words, it’s all about the Fed next week.
Disclosure: Long SPXL
The way I see it the stock market is extremely bifurcated. Last week the qqq’s (Nasdaq 100) had an outside week which is very bullish for the index. Growth stocks like MSFT, GOOG, NVDA and Apple are breaking out and could be the next leaders. The rest of the market as depicted by the Value Line is dragging. The issue now is whether the Nasdaq drags the market up kicking and screaming or the Value Line is the culprit to bring the market down to test its lows.
The safest bet to trade in my opinion is gold and the gold miners both fundamentals and technical support higher prices.
Complacency and The Wizard of Oz.
Ok maybe the yellow brick road is about gold and not Oz, but my point is about the curtain, when it is pulled back and the man behind it is revealed, well it’s the old Emperor has no clothes scenario.
What’s that got to do with complacency? Imagine you are a Fed Chair, any time in the last 100 years…big shot, you are the Fed chair, you have the power of the Fed behind you…any chance you might be complacent…hubris anyone?
This is the problem with complacency…oh that little noise is nothing…termites, wheels on the car, whatever…complacency feels nice, one feels safe, but one ignores the mistakes.
Then when something happens, well if you are complacent then at some emotional level it is not expected and so the complacency can vanish.
This is what I think is going on….The Fed thinks they can fix things, they can’t and when s#$t happens they will panic. It’s not the first time
So it’s all bluffing, because there is no way they will let 100s of regional banks fail if depositors move their money. The response to SVB etc just shows how committed they are to enduring pain.
We have become used to extremely low rates, to the point that when rates went negative, we were not freaking out, which again would have been wrong because being too early is the same as being wrong.
They will use another abbreviation for what they do, so don’t expect QE it will be something else but have the same effect.
It reminds me of Mutually Assured Destruction of the Cold War days when nobody was dumb enough to hit the red button.
So I expect them to guarantee all bank deposits for one year (because they expect maybe rates will have come down? or they can always extend? or whatever)…this will not lead us to prosperity.
As far as the regional banks being quiet, I think nobody wants to speak up…what happens if bank XYZ says, “Yeah things are rough for us too” and the depositors find out? It’s a confidence game.
Maybe the Fed will stay asleep at the wheel while a horrible crisis brews and things go down the toilet but for now we still have the response of March 2020 in the playbook…if things really crash we likely get a redo “to save the American economy and citizens”.
Remember AIG and it’s bailout? People criticize SVB and it’s foolish not buying interest rate swaps. If they had, would the counterparts been good for whatever number of billions? There would have been more likelihood of contagion…single car accident vs a 200 car pileup.
I am impressed that Cam sticks to his guns and is bullish on all 3 models. If the S&P breaks 4300 we have a series of higher highs and higher lows, which ofc could be a false dawn, but I think we get currency debasement because this is what has always happened ever since the Romans.
I am looking at gold to break to a new high, which would likely happen if the dollar index breaks the neckline of it’s H&S.
I talk too much.