Preface: Explaining our market timing models
We maintain several market timing models, each with differing time horizons. The “Ultimate Market Timing Model” is a long-term market timing model based on the research outlined in our post, Building the ultimate market timing model. This model tends to generate only a handful of signals each decade.
The Trend Model is an asset allocation model which applies trend following principles based on the inputs of global stock and commodity price. This model has a shorter time horizon and tends to turn over about 4-6 times a year. In essence, it seeks to answer the question, “Is the trend in the global economy expansion (bullish) or contraction (bearish)?”
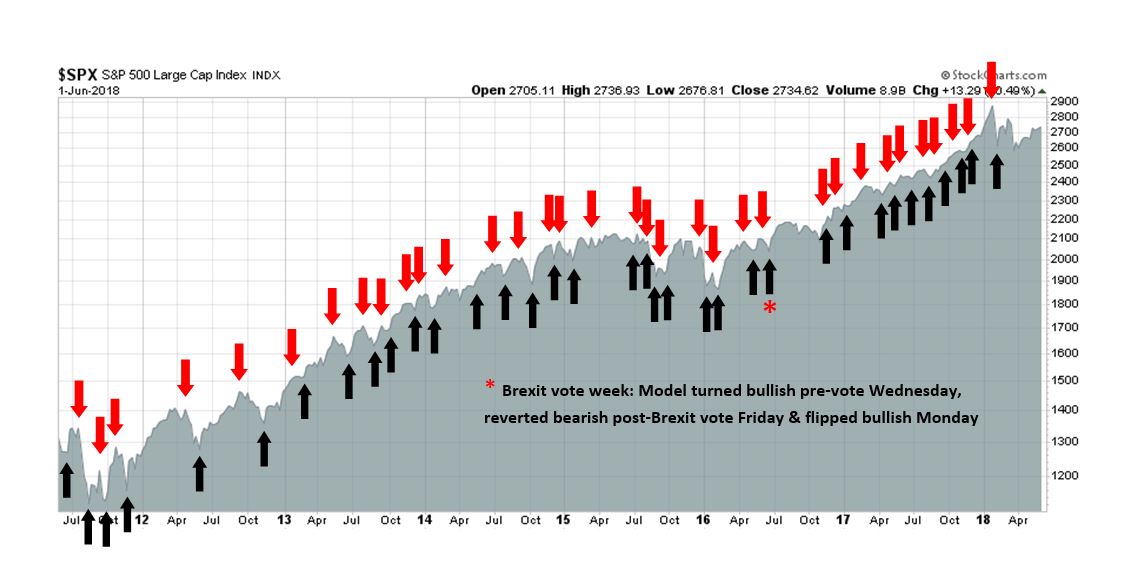
My inner trader uses the trading component of the Trend Model to look for changes in the direction of the main Trend Model signal. A bullish Trend Model signal that gets less bullish is a trading “sell” signal. Conversely, a bearish Trend Model signal that gets less bearish is a trading “buy” signal. The history of actual out-of-sample (not backtested) signals of the trading model are shown by the arrows in the chart below. The turnover rate of the trading model is high, and it has varied between 150% to 200% per month.
Subscribers receive real-time alerts of model changes, and a hypothetical trading record of the those email alerts are updated weekly here.
The latest signals of each model are as follows:
- Ultimate market timing model: Buy equities
- Trend Model signal: Bullish
- Trading model: Bullish
Update schedule: I generally update model readings on my site on weekends and tweet mid-week observations at @humblestudent. Subscribers receive real-time alerts of trading model changes, and a hypothetical trading record of the those email alerts is shown here.
What market timers won’t tell you
Market timers have a dirty little secret that they won`t tell you, “Bottoms are easy to call, but tops are hard.”
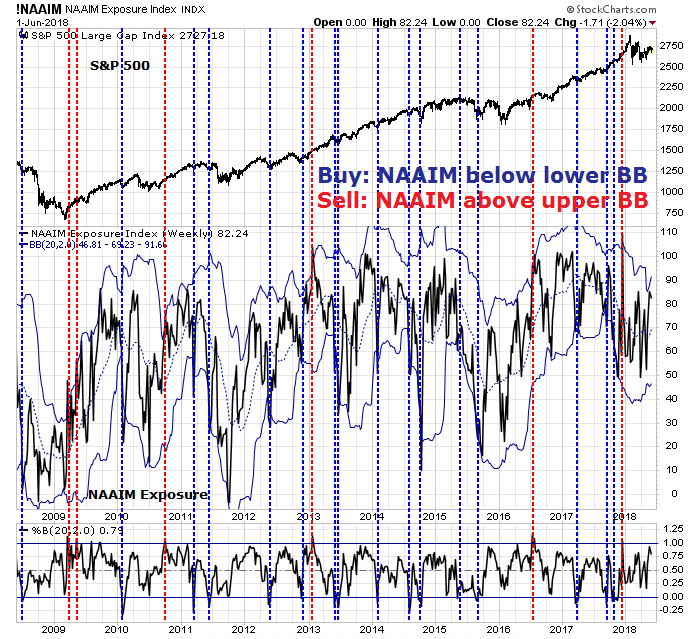
Consider the use of the NAAIM exposure index just as a typical example of a contrarian indicator. In the last 10 years, episodes when the NAAIM fell below its Bollinger Band (blue vertical line) have been good trading buy signals. While oversold markets can become more oversold, buy signals have marked periods of low downside risk. On the other hand, sell signals when NAAIM rose above its upper BB have not worked well.
The perspective is totally different from a business viewpoint. What market timers won’t tell you that it’s the doom and market crash narratives that get the clicks and the views. Mark Hulbert revealed that “bear markets and heightened volatility are good for business” of newsletter writers. In the two years leading up to the January top, stock prices went straight up:
Who needs a market timer during conditions like those? One leading stock-market timer I monitor told me that during the market’s blow-off stage between last November and the late-January peak, he lost 18% of his subscribers. He added that he’d never before experienced a drop in subscribers of similar magnitude — much less over so short a period.
Glenn Neely, editor of the NeoWave market-timing service, said 2016 and 2017 were some of the most difficult he’s experienced in a 30-year career.
With those factors in mind, I analyze some of the scare stories that have come across my desk in the last few weeks and show why they should not be reasons for panic:
- Eurozone crisis: Italy and Spain
- A looming junk bond Apocalypse
- A crowded long position in the equity bull trade
- Signs of complacency at the Fed
As the Wall Street adage goes, “Bottoms are events, while tops are processes.” Ignore “this will not end well” warnings with no obvious bearish trigger. Don’t be fooled by the clickbait stories of doom.

Eurozone crises are the best crises
The markets were spooked last week by fears of another looming eurozone crisis, first from Italy, then from Spain. But investors were in reality just served with another act of European theater.
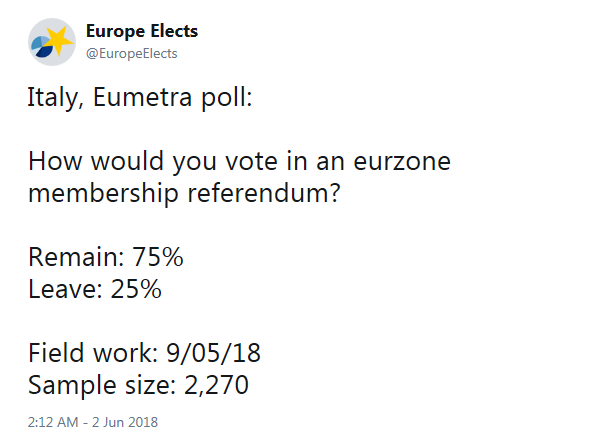
Just keep in mind opinion polls show that most Italians would like to remain in the euro. In the absence of eurozone breakup risk, we know how this plays out. The eurocrats will cobble a solution in the end.
The latest act of European theater parallels the events of last Greek crisis. The initiatives of the latest Italian government is highly reminiscent of the ideals of the SYRIZA government in Greece when it first achieved power. We know how that play turned out too.
As for Spain, just remember that Spain is not Italy. Its economic growth is about 3%. Madrid will comply with EU budget rules for the first time in years. In addition, any realistic alternatives to Rajoy will be pro-Europe.
I recently read the best perspective on the latest eurozone fright stories: Eurozone crises are the best crises! Let’s get the band back together!
“This will not end well”
While a eurozone banking crisis has the potential to crater the global financial system, a number of other “this will not end well” warnings have crossed my desk, indicating elevated risk levels but with no obvious bearish trigger.
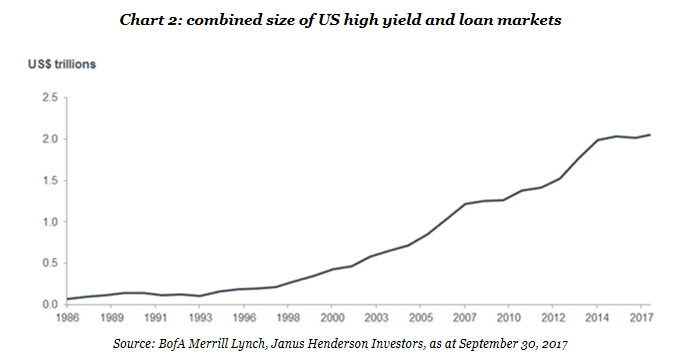
John Mauldin recently warned about a potential high yield train wreck. He observed that the size of the US high yield and loan markets has been rising rapidly.
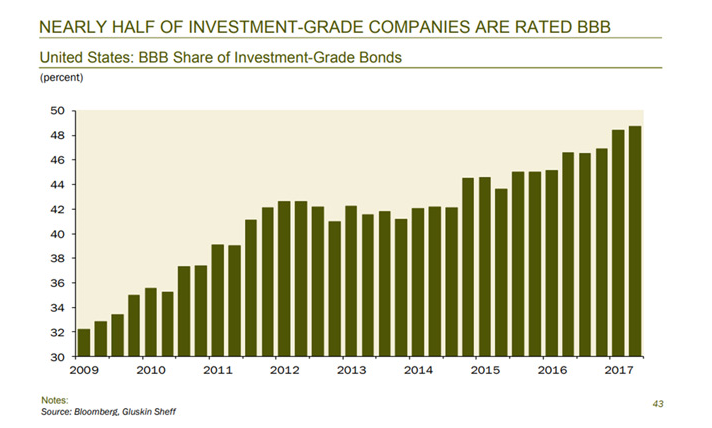
Mauldin also highlighted analysis from David Rosenberg of danger posed by deteriorating credit quality. Even within the investment grade (IG) category, nearly half of IG bonds are rated BBB, which is the lowest rating above junk.
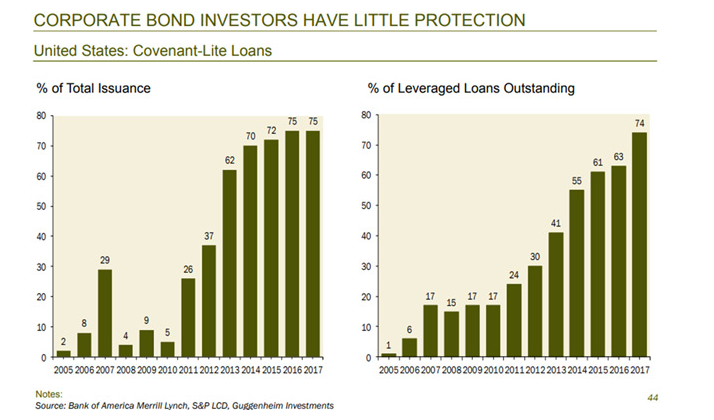
Moreover, covenant lite issues are hitting the market, which leave investors with little protection should financial conditions deteriorate significantly.
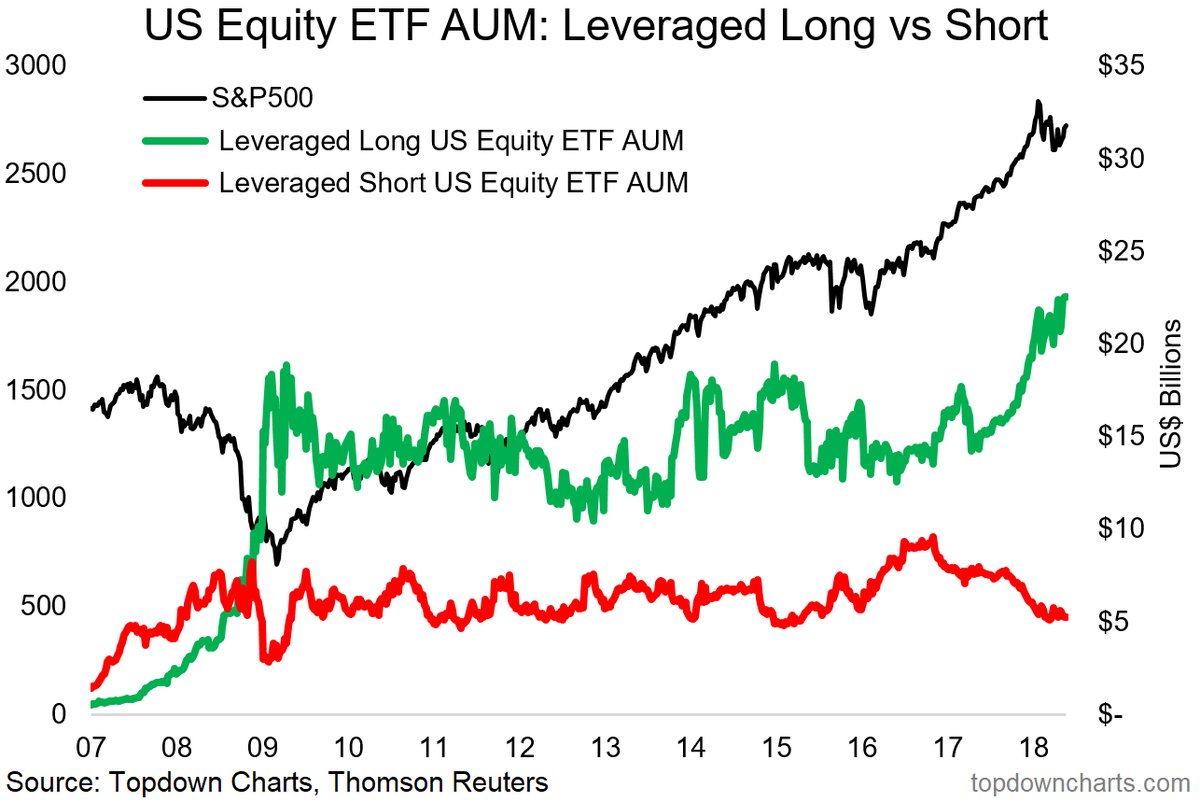
In a separate piece of analysis, Callum Thomas of Topdown Charts pointed out that leveraged long equity ETFs have surged to all-time highs, while leveraged short ETFs have been falling.
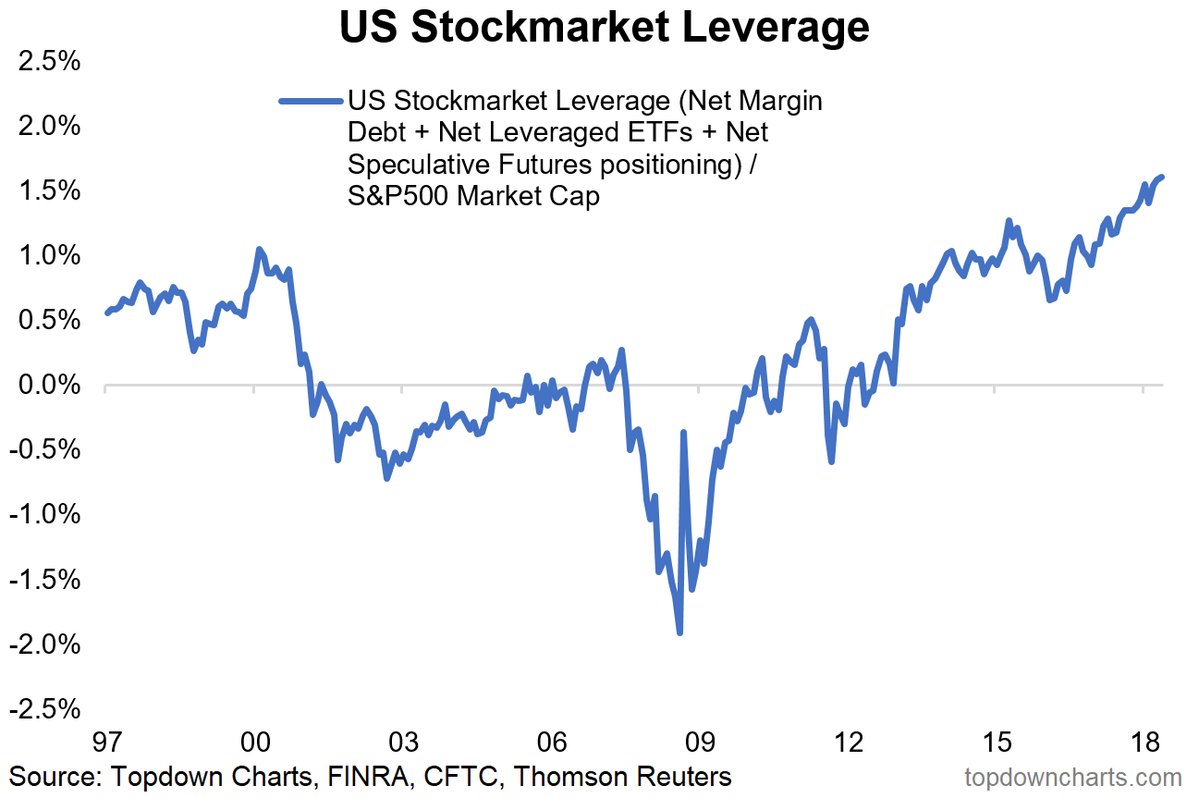
Thomas also found that stock market leverage, defined as net margin debt + net leveraged ETFs + net speculative futures positioning, is also at an all-time high.
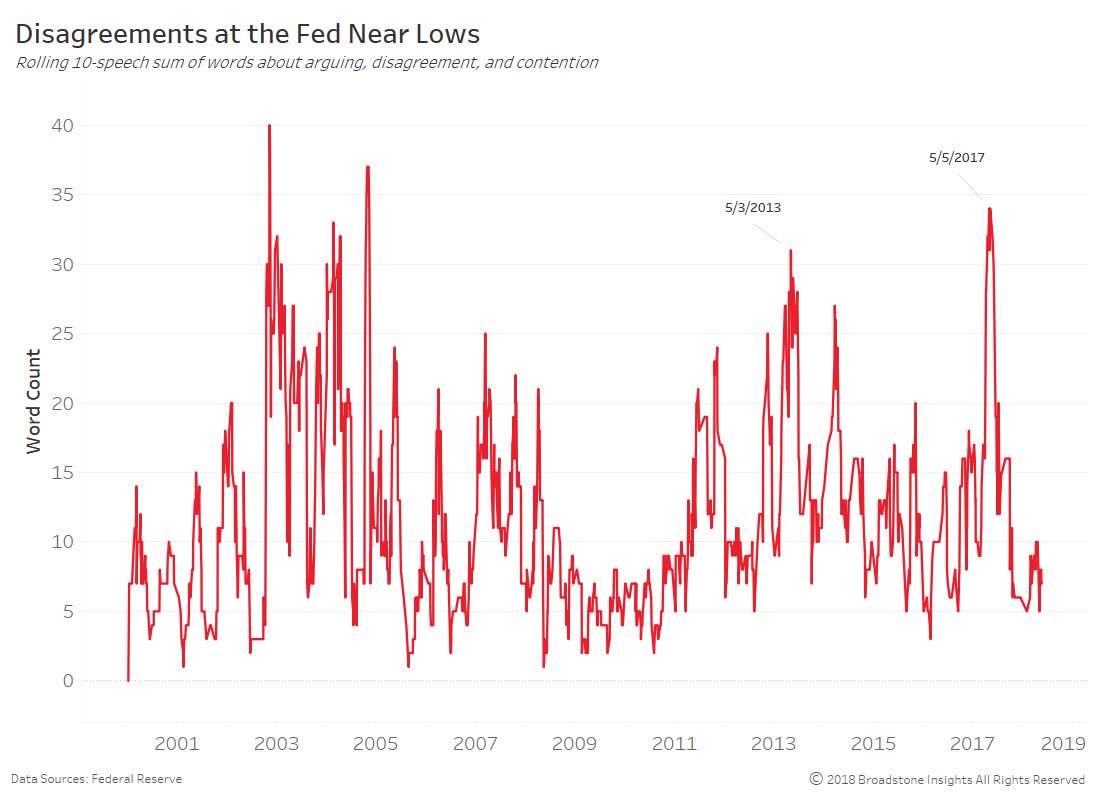
The bullishness has also migrated to Federal Reserve policy makers. Textual analysis of Fed minutes revealed that words about a strong economy have reached an all-time high.

At the same time, the level of disagreement at the Fed is very low. In effect, the Fed is becoming complacent about strong growth and groupthink is taking over.
What could possibly go wrong?
What’s the bearish trigger?
Keynes famously said that the markets can stay irrational longer than you can stay solvent. In my experience, “this will not end well” narratives can continue as risk levels stay elevated and markets rally. Such conditions are more indicative of heightened downside risk in a bear phase, but they are silent on the bearish trigger.
As a reminder, in my series “Things you don’t see at market bottoms”, I have stated repeatedly that, “My experience has shown that overly bullish sentiment should be viewed as a condition indicator, and not a market timing tool.” This series began in June 2017, about a year ago, and an equity bear hasn’t begun yet:
- Things you don’t see at market bottoms, 23-Jun-2017
- Things you don’t see at market bottoms, 29-Jun-2017
- Things you don’t see at market bottoms, bullish bandwagon edition
- Things you don’t see at market bottoms, Retailphoria edition
- Things you don’t see at market bottoms, Wild claims edition
- Things you don’t see at market bottoms, No fear edition
- Things you don’t see at market bottoms, Paris Hilton edition
- Things you don’t see at market bottoms, Halloween edition
- Things you don’t see at market bottoms, CFD edition
- Things you don’t see at market bottoms: Rational exuberance edition
- Things you don’t see at market bottoms: Retail stampede edition
- Things you don’t see at market bottoms: China edition
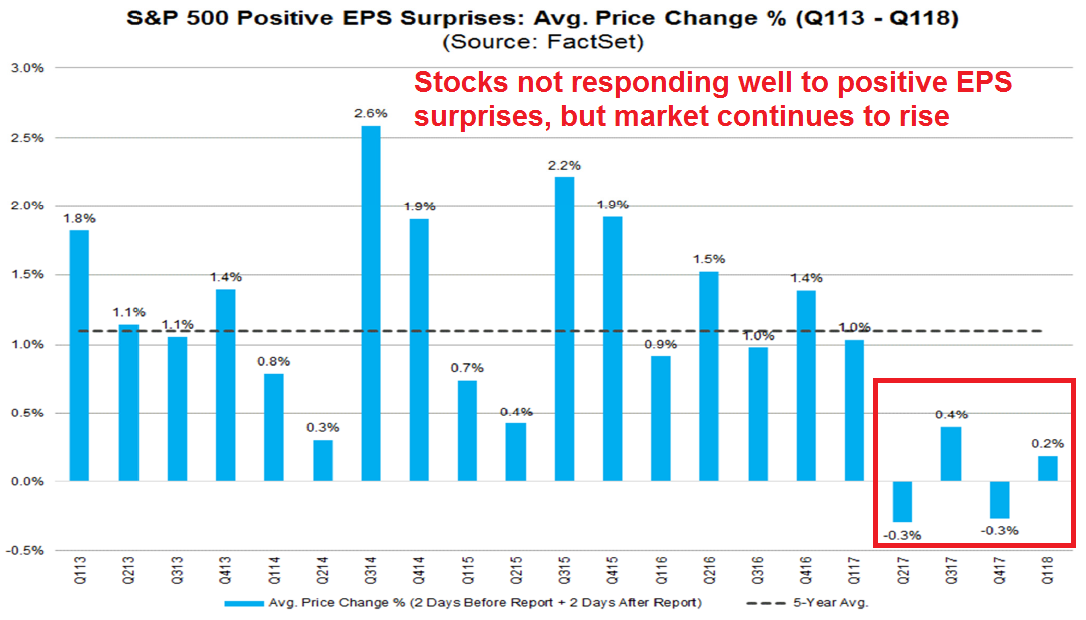
As an example, analysts have recently pointed to the lack of positive response to EPS beats. The latest update from FactSet reveals that companies that beat consensus EPS by 20% or less did not perform well.

Is that a reason to be bearish? Further analysis shows that stocks have been behaving this way for about a year. At the same time, stock prices are higher than they were a year ago.
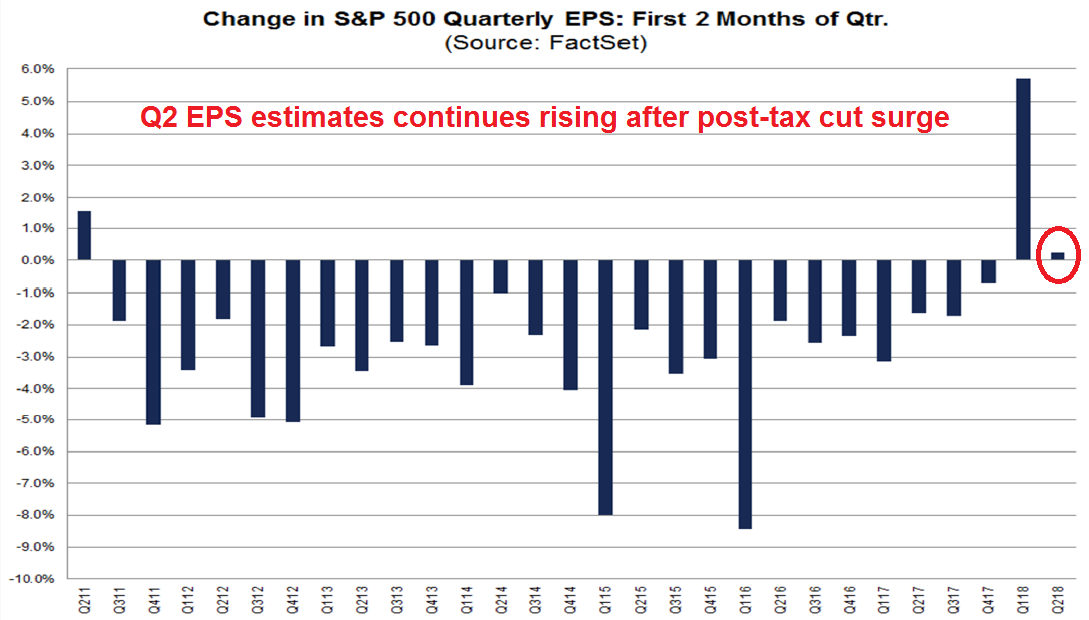
At the same time, the latest update from FactSet shows that forward 12-month EPS continues to rise. FactSet also reported that Q2 guidance is better than the historical average. Both of these factors are indicative of positive fundamental momentum.

Moreover, Q2 EPS estimates are rising, which is unusual. Historically, EPS estimates tend to start high because of overly optimistic analysts, and they drift down as reality sets in. As we close the book on Q1 and look ahead to the Q2 reporting season, EPS estimates are edging upwards.
Are you sure you want to be bearish?
Recessions = Equity bear markets
Ultimately, markets will not fall without a bearish trigger. History has shown that recessions have been bull market killers, and my approach is to combine fundamental and macro analysis with technical analysis to control downside risk. Once I have determined that recession risk is high, my inner investor uses the moving averages to define the levels where he de-risks his portfolio.

Here is what I am worried about. The first is Fed policy. The unemployment rate, as indicated by the May Jobs Report, fell to 3.8%. Jim O’Sullivan of High Frequency Economics observed that the current unemployment rate is already at the Fed’s projected year-end 2018 levels, indicating an increasingly tight labor market. Can the Fed really take its foot off the monetary brakes under such conditions?

Fed Governor Lael Brainard’s recent speech is equally concerning, where she downplayed the risks from a flattening yield curve. Brainard, who had been a dove, has turned more hawkish, and her views also highlight a growing schism between the Fed governors (who have permanent votes, more staff, and therefore greater power in determining monetary policy), regional Fed Presidents, who have voiced concerns about inverting yield curve.
It is important to emphasize that the flattening yield curve suggested by the SEP median is associated with a policy path calibrated to sustain full employment and inflation around target. So while I will keep a close watch on the yield curve as an important signal on how tight financial conditions are becoming, I consider it as just one among several important indicators. Yield curve movements will need to be interpreted within the broader context of financial conditions and the outlook and will be one of many considerations informing my assessment of appropriate policy.
At the current rate of deterioration, my monetary policy indicators will flash a recessionary warning in late 2018.
My second worry is the growing risk of a trade war (see Could a Trump trade war spark a bear market?). The latest Fed Beige Book shows that respondents are increasing concerned about a potential trade war.
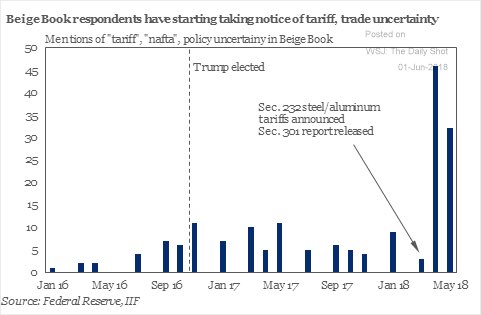
For now, it’s only a trade skirmish. The only question is how these conditions affects business confidence, and the pace of hiring and investment. Here is Mark Zandi of Moody’s (via Marketwatch):
“If all of the announced tariffs are actually implemented, it will [cut] 0.2% from real GDP growth. If that’s all it is, it won’t cause much of a slowdown,” Moody’s Analytics chief economist Mark Zandi said. “However, if the trade war is back on, and the Trump Administration slaps 25% tariffs on all Chinese and Mexican exports to the U.S., as [Trump] promised during the campaign, then yes, it would do serious economic damage. NAFTA would likely fall apart, and financial markets would begin discounting much worse. A recession would be a real possibility.”
The month ahead: A test for the bulls
The stock market went on a wild ride last week, and I was fortunate to have nailed my two short-term forecasts (see Offbeat Thursday and Friday forecasts). I took the “over” in the May Jobs Report, which came in well ahead of expectations. Moreover, good (economic) news continues to be good (stock market) news.
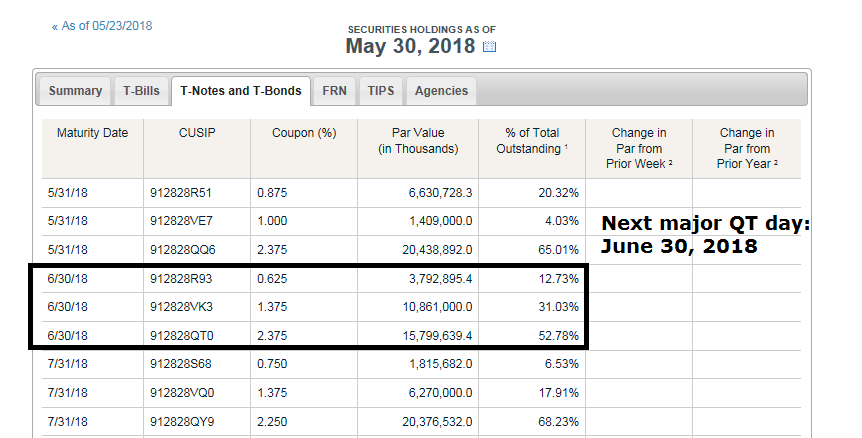
As well, last Thursday saw a significant QT day, where about $28b rolled off the Fed’s balance sheet. Past significant QT days in 2018 has seen stock market weakness and last Thursday was no exception. The jury is still out on QT day weakness as a trading indicator. Arguably, equity prices fell in reaction to the imposition of aluminum and steel tariffs on major American allies. On the other hand, the tariff news was known before the open, but stock prices did not significantly weaken until later in the trading day, which argues for a QT market effect. For readers following along at home, data from the New York Fed shows that the next significant QT day will be June 30, 2018.
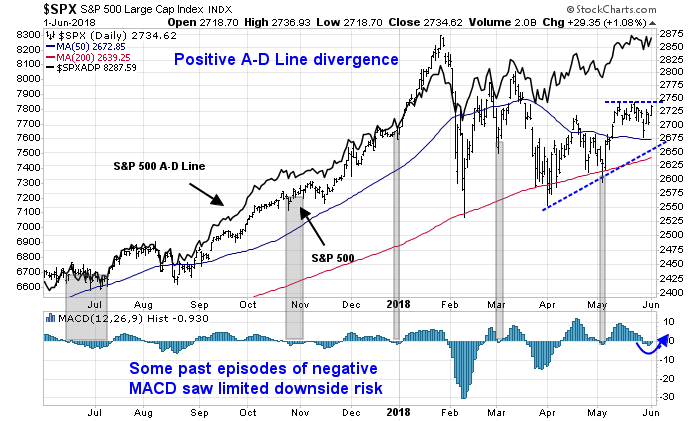
I also wrote last week that an analysis of the market using MACD using daily, weekly, and monthly time frames was revealing (see The hidden MACD message from the market). The MACD weakness on the daily chart appears to be resolving itself with only downside risk. We continue to see positive divergence from the Advance-Decline Line, with the next SPX resistance at 2640.
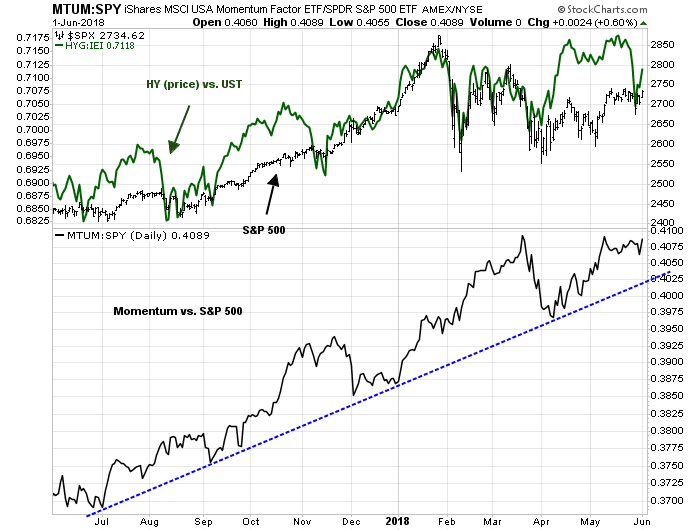
The coming week will be a test for bullish momentum. Risk appetite remains healthy. Market fears of a junk bond selloff is dissipating (top panel), and the price momentum factor remains in a relative uptrend.
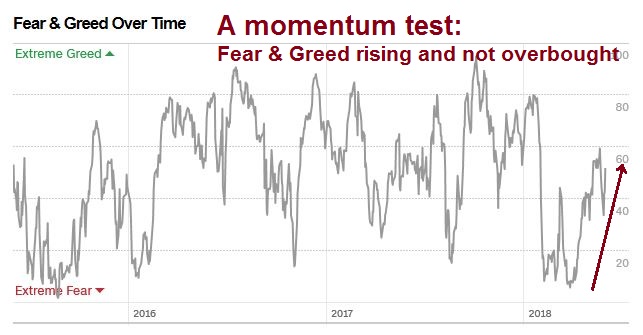
The Fear and Greed Index is rising, has a intermediate term momentum tailwind, and readings are only neutral and have room to increase further before it becomes overbought.
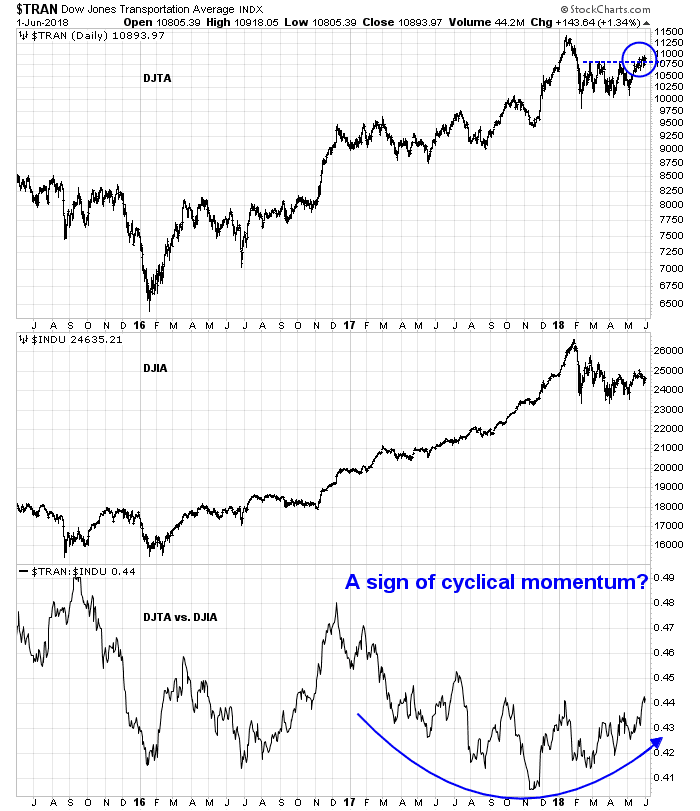
The signal from the DJ Transports is equally encouraging. Even as the DJIA struggles, the DJTA has broken out to fresh recovery highs and the DJTA/DJIA ratio is tracing out a saucer shaped bottoming pattern (bottom panel).
That said, the bulls need to get the job down in the next month or so. The NYSE McClellan Summation Index (NYSI) is becoming overbought, and the window for achieving new highs before the index rolls over is narrowing.

My inner investor remains bullish in anticipation of fresh index highs this summer. My inner trader added to his long positions on market weakness last week.
Disclosure: Long SPXL, TNA
In the last chart, don’t you mean to say that stochastics are becoming overbought?
The stochastics of NYSI that`s overbought. Same thing.
A bearish trigger is happening at the G7 conference. The gauntlet is being thrown down for an absolute trade war. For business it will be a massive lose-lose situation.
Globalization has been a great boost for companies who could manufacture in the cheapest areas. This also spread prosperity to billions of new consumers to buy their products.
The U.S. has the lowest unemployment rate in generations and the strongest economy but a President that is sacrificing it all for political points to the part of his base that is underachieving.
I believe we are going to head from a Trump environment of extreme economic nationalism to consumer product nationalism. That is disaster for U.S. based international brands. Watch for ‘Boycott American’ to start. Until Trump, buying an Apple iPhone, Nike runners or a McDonald’s burger were cool and upscale in foreign markets. Just watch the backlash roll out from a trade war, hurting big brands.
A simple thing like travel will be effected. A study found the new Chinese tourist industry’s most desired global destinations were Las Vegas and Disneyland. Expect that to change for them and other country’s tourists too.
International travelers have gone to Expedia for flights and book the cheapest. Watch in future as European travelers choose Lufthansa and pay a bit more than American Airlines to support ‘their’ company versus one of the nasty American company.
General Motors sells more cars in China than the U.S. As economic nationalism morphs into consumer product nationalism expect Chinese consumers to be anti-American cars. They will buy ‘their’ Chinese-made cars.
You get the picture.
Globalization has led to global prosperity and great business success. It has raised the living standards and buying power of billions of people in the developing world while flattening real incomes of the middle classes in America and other advanced economies. Income disparity in the developed world is much higher even as global average incomes have risen dramatically.
The politics are one thing but for the stock market the business results were clearly extremely good. This trade war will obviously pull the rug out from under that favorable business environment. This negative message of consumer nationalism will be spreading after this G6 plus One has ended and Trump has spoken his reactionary final message. It’s a shame and international tragedy.
Realised volatility is still somewhat elevated, i.e higher frequency of ups and downs. The stochastics won’t stay high for long.
Hi Cam, just wanted to share this SSRN article that ranks and evaluates some current market forecasters. Too bad they didn’t include you, but being hidden has some merits too 😀
https://papers.ssrn.com/sol3/papers.cfm?abstract_id=2944853