Preface: Explaining our market timing models
We maintain several market timing models, each with differing time horizons. The “
Ultimate Market Timing Model” is a long-term market timing model based on the research outlined in our post,
Building the ultimate market timing model. This model tends to generate only a handful of signals each decade.
The
Trend Asset Allocation Model is an asset allocation model that applies trend-following principles based on the inputs of global stock and commodity prices. This model has a shorter time horizon and tends to turn over about 4-6 times a year. The performance and full details of a model portfolio based on the out-of-sample signals of the Trend Model can be found
here.
My inner trader uses a
trading model, which is a blend of price momentum (is the Trend Model becoming more bullish, or bearish?) and overbought/oversold extremes (don’t buy if the trend is overbought, and vice versa). Subscribers receive real-time alerts of model changes, and a hypothetical trading record of the email alerts is updated weekly
here. The hypothetical trading record of the trading model of the real-time alerts that began in March 2016 is shown below.
The latest signals of each model are as follows:
- Ultimate market timing model: Buy equities (Last changed from “sell” on 28-Jul-2023)
- Trend Model signal: Neutral (Last changed from “bullish” on 26-Jul-2024)
- Trading model: Bullish (Last changed from “neutral” on 25-Jul-2024)
Update schedule: I generally update model readings on my site on weekends. I am also on X/Twitter at @humblestudent. Subscribers receive real-time alerts of trading model changes, and a hypothetical trading record of those email alerts is shown here.
Subscribers can access the latest signal in real time here.
Poised for a rebound
Numerous historical studies of volatility spikes have concluded that such episodes are good buying opportunities for stocks.
The accompanying chart shows just one example of what happens when the VIX Index surges above 45 and recycles below 30. The market has been higher every single time. The only question is whether the market re-tests its old lows.
If stock prices are poised for a rebound, the next question is the nature of the leadership of the ensuing rally.
The crowded trade reset
Let’s first begin with a review of the market backdrop.
Admittedly, psychology had become a little too giddy and was due for a reset. The Euphoriameter from Callum Thomas of Topdown Charts shows that sentiment had become a little too frothy and the recent market setback can be considered to be an opportunity for a welcome reset.
Longer term, growth stocks have been on a tear against value stocks since the GFC. The trend may have become excessive. The divergence between U.S. growth and value and EAFE growth and value became evident with the onset of AI investing mania in early 2023.
The recent risk-off episode may be the signal of a reset of the growth and value relationship.
The rotation continues
The accompanying chart shows the relative performance of the value and cyclical sectors of the S&P 500. All turned up when the S&P 500 topped out in early July.
By contrast, here is the relative performance of growth sectors. Only Communication Services have been flat against the S&P 500 in the past year. Technology and Consumer Discretionary, which are dominated by heavyweights Amazon and Tesla, turned down when the market topped in July.
In particular, the absolute and relative performance of technology stocks has been weak, and so is their relative breadth indicators (bottom two panels).
Growth stocks, as represented by the NASDAQ 100, aren’t sufficiently washed out to form a relative bottom (black line).
By contrast, a bottom-up review of deep value stocks is presenting greater buying opportunities. My Leveraged Buyout screen of non-financial stocks in the S&P 1500 (see How to buy a company with no money) revealed 38 candidates that pass the screen of buying the company with no more than 30% of the stock price and borrowing the rest, compared to 25 candidates at the end of July and 25 at the end of June.
The biggest surprise on the LBO list was the Tech Bubble favourite Cisco Systems, which is trading at a forward P/E of 12.7.
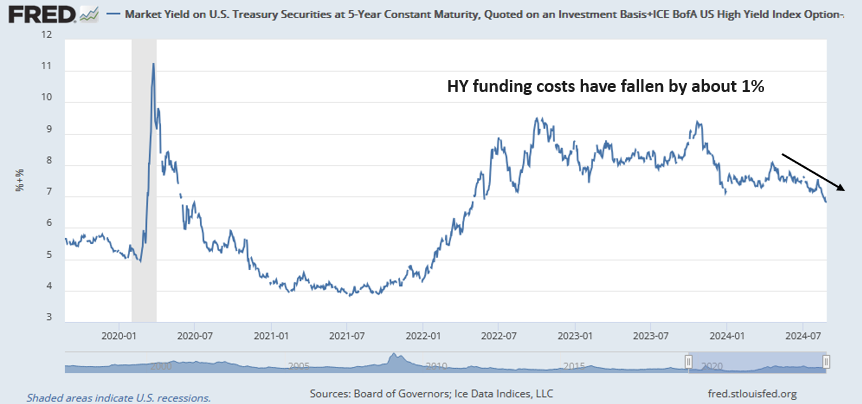
Small-cap stocks also look intriguing. If we use the relative performance of high yield (junk) bonds to their duration-equivalent Treasuries (black line) as a proxy for risk appetite, the small-cap/large-cap ratio (red line) began to diverge from high yield in early 2019 and recently fell to 20-year lows.
Tactically, small-cap indices have retreated back to their absolute and relative trading ranges after failed upside breakouts. Upside breakouts would be confirmations of renewed leadership by these stocks. I remain constructive.
Welcome signs of normalization
Since the recent volatility storm originated in the derivatives market, I am seeing welcome signs of normalization in the option market that lays the foundation for a stock market rebound in the week ahead.
The VVIX, which is the volatility of the VIX, has begun falling in line with the decline in the VIX. I interpret this as falling expectations of higher future volatility.
In conjunction with a falling VVIX, the term structure of the VIX has also normalized from inversion, indicating receding fear levels.
The SKEW Index, which measures the relative cost of tail hedges, rose above its 200 dma even as stock prices rebounded. Rising cost of downside protection in the face of market strength is a useful contrarian signal.
As always, there are no guarantees in trading, but these are constructive signs that the bulls are taking control of the tape. Look for an O’Neil Follow Through Day in the coming week for bullish confirmation. A follow through day can occur as soon as day 4 (last Friday) of a rally. It’s defined as the index rising 1% or more on higher volume than the previous day. The most powerful follow through days occur between day 4 and day 7 of the rebound.
In conclusion, the market is poised for renewed strength. A review of market leadership shows weakness by technology and other large-cap growth stocks. I believe the rotation from growth to value and from large caps to small caps will continue and these stocks will be the new leadership in the next leg up.
My inner trader continues to hold a long position in small caps. The usual disclaimers apply to my trading positions.
I would like to add a note about the disclosure of my trading account after discussions with some readers. I disclose the direction of my trading exposure to indicate any potential conflicts. I use leveraged ETFs because the account is a tax-deferred account that does not allow margin trading and my degree of exposure is a relatively small percentage of the account. It emphatically does not represent an endorsement that you should follow my use of these products to trade their own account. Leverage ETFs have a known decay problem that don’t make the suitable for anything other than short-term trading. You have to determine and be responsible for your own risk tolerance and pain thresholds. Your own mileage will and should vary.
Disclosure: Long TNA