Preface: Explaining our market timing models


The latest signals of each model are as follows:
- Ultimate market timing model: Buy equities (Last changed from “sell” on 28-Jul-2023)
- Trend Model signal: Bullish (Last changed from “neutral” on 28-Jul-2023)
- Trading model: Bullish (Last changed from “neutral” on 17-Jan-2024)
Update schedule: I generally update model readings on my site on weekends. I am also on X/Twitter at @humblestudent. Subscribers receive real-time alerts of trading model changes, and a hypothetical trading record of those email alerts is shown here.
Subscribers can access the latest signal in real time here.
Bearish capitulation
Last week, I suggested that the current market environment “argues for a buy the dip and sell the rip posture in trading”. When the S&P 500 fell a miniscule -1.8% on an peak-to-trough intraday basis, my models were registering signs of bearish exhaustion, which was a sign to buy the dip.
How could a -1.8% intraday drawdown spark such oversold extremes? One inter-market clue came from Asia, where Chinese and Hong Kong stocks cratered on bad news out of China. The Hang Seng Index skidded -4.1% on Wednesday to a new 52-week low, and there wasn’t a single advancing issue.

Jason Goepfert of SentimenTrader found that such episodes tended to resolve bullishly. It was therefore no surprise that the Hong Kong market rebounded the next day, and so did the S&P 500.

Back in the U.S., two of the components of my bottom spotting model flashed buy signals, and a third came within a hair of one. Historically, tradable bottoms have occurred whenever two or more components registered buy signals. The bullish components are the VIX Index, which spiked about its upper Bollinger Band indicating an oversold market; the NYSE McClellan Oscillator (NYMO), which fell to oversold levels; and TRIN, which rose to 1.95 Wednesday, which was just short of the 2.0 threshold that’s indicative of price-insensitive margin clerk and risk manager induced selling.

Hopefully, you bought the dip.
Fade the rally
The S&P 500 is tracing out a strongly bullish cup and handle breakout, which is an intermediate bullish pattern, but the short-term bull case is far from clear. That’s because the index is exhibiting a severe negative divergence on its 5-week RSI as it approaches its all-time high. While this doesn’t necessarily preclude further strength, the longevity of any bull move over the next few weeks may be in doubt.

In addition to the negative RSI divergence, I am concerned about the evidence of narrowing breadth and weakening bond prices, which were correlated to stock prices for much of their recent rally.

But respect the bounce
That said, it’s too early to short the market. Bears should respect the momentum of the price bounce. The NYSE McClellan Oscillator (NYMO) recycled from an oversold condition. Past episodes have seen NYMO recover to at least neutral before the relief rally petered out. While this is only a guesstimate, a typical bounce could see the S&P 500 reach slightly above 4900 before topping out.

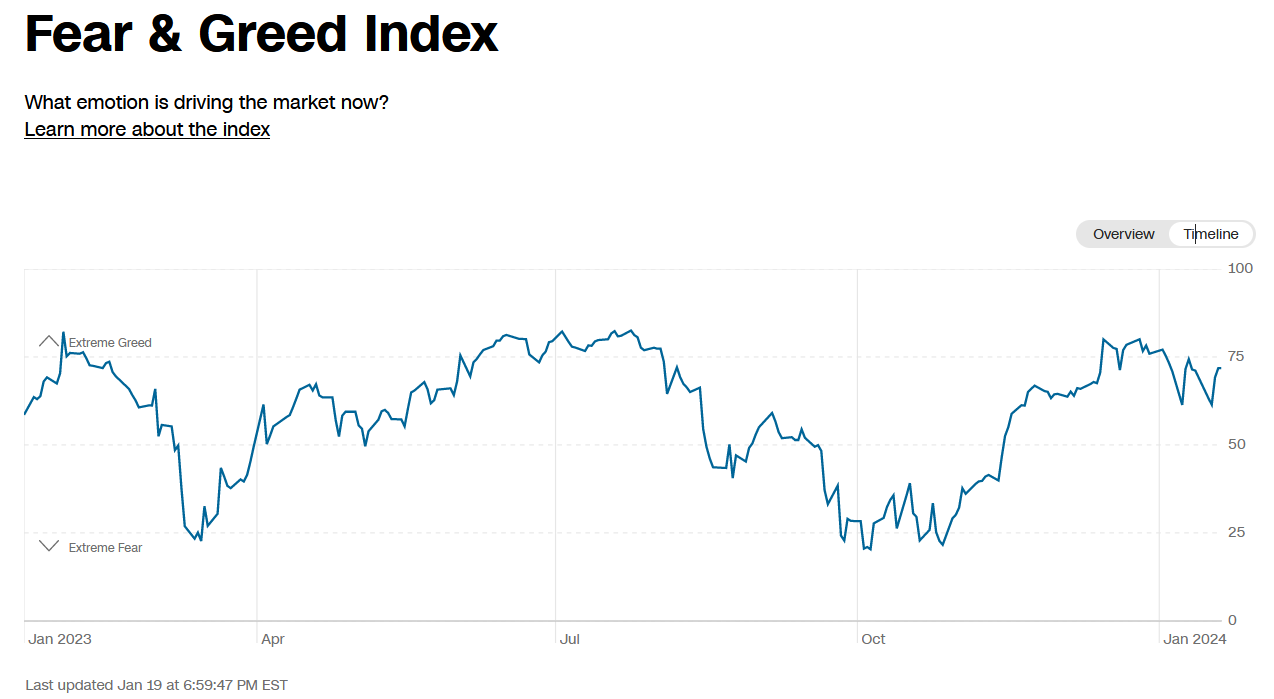
As well, the Fear & Greed Index is elevated but not extreme, indicating further upside potential.
I remain long-term bullish. The monthly MACD of the NYSE Composite turned positive, which is a buy signal with a strong track record.

Sources of risk
Investors face several sources of risk in the coming weeks. Fed Governor Christopher Waller virtually single-handedly pushed back against market expectations of a March rate cut. Waller made it clear that while rate cuts are coming into view, market expectations of the timing and pace of rate cuts are overdone.
Recent Fed decisions have shown themselves to follow market expectations. If policymakers disagree with the market consensus, it has shown a pattern of coordinated speeches from Fed speakers to correct the market’s views. Already, the odds of a March cut fell from over 70% to about 55% today and the consensus timing of a first cut has been delayed to May.


If one looks through a short time frame, what usually happens when the market makes an ATH is another ATH follows. In other words the bull lives. So the odds of an ATH being the top are low, not zero but low.
The problem of course is tolerating the volatility, and what if it is the ATH?
There are long trends and short trends, however when it is an ATH, the trend has to be up.
If you want to trade the top from the short side, take a way out of the money put position, then the shaking won’t bother you much. The put will likely expire worthless, but you won’t lose sleep. Otherwise we have to wait for a trend change sign. Anyways, bull markets are more fun, except for the shorts of course.
I would like to share some observation here. Tech is projected to grow EPS 15%, highest among all sectors, this year and has been very constant for the last 6 months. So obviously this growth is concentrated owing to AI adoption. The progression would be hardware, hyperscalers, and then enterprise software. Nvidia chief Jensen Huang visited Taiwan, where he was born, yesterday for the third time in 90 days. This shows you the AI infrastructure buildout is into high hear and accelerating. An example is the stock of SuperMicro, SMCI, which was up 36% in Friday’s session. This is a Taiwanese company based in Silicon Valley. I am pretty sure AMD chief Lisa Su will visit soon. She has been there twice in a short period of time. Back in US Arista Network and the old Dell are benefiting from the trend. But these companies all sourced from Taiwan. Obviously in semiconductor sector, GPU, memory, connectivity, and power management chips will be in high demand for several years. This is the second chance to make big money on hardware side. Hyperscalers are all very big company, e.g. MSFT, so growth rate would be smaller. The last would be enterprise software. One particular area is cyber security. This area has the potential to come out with very robust products. Market is discounting the probability.
Other than IT, medical tech and medical device and pharma have very high probability of amazing products and procedures and medicines. One company, Intuitive Surgical, is at the confluence. If it executes right they will be at the forefront of treatment procedures of several hard to treat ailments: addiction, Parkinson’s, Alzheimer’s, and others. It has been demonstrated that opening up blood and brain barrier for medicine to go thru and then treat with focused ultrasound targeting designated areas is very effective. The drug addiction cure rate is very high among test samples. It will be opening up to treat many health problems, medical of behavioral, which our brains have control of.