Exhibitions of powerful price momentum are rare. Since the market bottom in 2002, there have been eight occasions when the percentage of S&P 500 above their 50 dma has surged from below 15% to over 90% in a brief period. That latest episode occurred when stock prices soared off the bottom in October 2023. These price surges were usually resolved in either a short-term consolidation or setback, but the S&P 500 was invariably higher a year later with a 100% success rate.

The Magnificent Seven
No bottom-up technical scan of chart patterns would be complete without the analysis of the Magnificent Seven. I found that most of these stocks exhibited bullish patterns.
The star of the Magnificent Seven has to be NVIDIA (NVDA), which is in a well-defined uptrend and broke out to fresh all-time highs as investors have bid up the share price over the promise of AI-related demand for the company’s chips. As well, the stock staged double relative breakouts to new relative highs.

Close behind NVIDIA is Microsoft (MSFT), which is in both an absolute and relative uptrend.

While it is not in an uptrend, Meta Platforms (META) is a stock that’s exhibiting what will be a recognizable breakout from a long multi-month base, both on an absolute and relative basis.

The chart pattern of Amazon.com (AMZN) is less bullish, but nevertheless promising. The stock staged an upside breakout from a long base, but we have seen no relative breakout just yet.

Alphabet (GOOG, GOOGL) hasn’t staged upside breakouts just yet, but it is also testing resistance while exhibiting the now familiar saucer-shaped base.

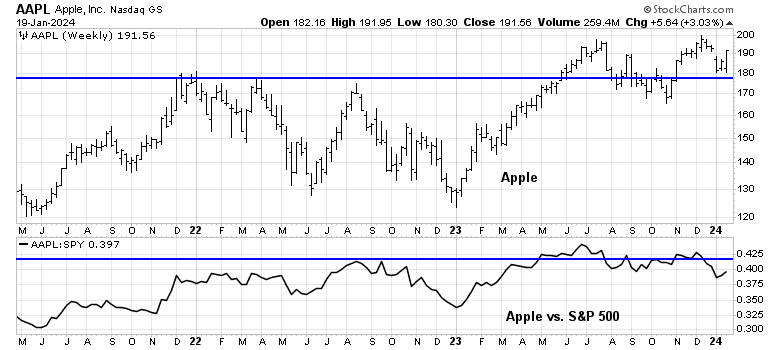
One laggard within the Magnificent Seven is Apple (AAPL). The stock staged an upside absolute breakout, but it’s trading under a key relative resistance level.
The worst chart of Magnificent Seven stocks is Tesla (TSLA), which struggled because of concerns over its China exposure.
The latest BoA Global Manager Survey showed that institutions believe long Magnificent Seven is the most crowded trade. While the trade may be crowded, megacap growth stocks may have further potential to run. The normalized relative returns of the NASDAQ 100 (black line) is only in the middle of its 12-month range. I interpret this to mean that AI-related excitement could drive these stocks much further than many people might expect.

Technology winners
In general, the technical scan has thrown off numerous bullish patterns in the technology sector. In particular, the semiconductor stocks have been standouts, starting with Broadcom (AVGO), which is in a well-defined absolute and relative uptrend.

Here is Lam Research (LRCX), which staged upside absolute and relative breakouts of saucer-shaped bases.

An honourable mention goes to Advanced Micro Devices (AMD), whose chart is not shown. AMD is testing absolute and relative resistance levels out of multi-month bases.
Nutanix (NTNX) also staged an absolute and relative breakout out of multi-month bases.

Qualys (QLYS) staged a definitive upside breakout on an absolute basis. However, it has pulled back from its relative breakout level and it’s re-testing a key resistance level (bottom panel).

Other technology stocks of note include Salesforce.com (CRM), which staged an absolute breakout, but remains below its relative breakout level.

Guidewire Software (GWRE), has a similar technical pattern of upside breakouts through absolute and relative resistance levels.

Shopify (SHOP) has also staged absolute and relative breakouts from long bases.

Lastly, here is Affirm Holdings (AFRM) within the technology sector, which staged an absolute breakout, but remains below its relative breakout level.

A strong consumer
I also found numerous technically strong stock patterns in the consumer discretionary sector, which is the sign of a strong consumer. In particular, selected apparel and footwear stocks have gone bonkers.
Abercrombie & Fitch (ANF) is in a well-defined absolute and relative uptrend.

Decker Outdoor (DECK) is exhibiting a similar absolute and relative uptrend.

An honourable mention whose chart is not shown goes to lululemon (LULU), which staged an absolute upside breakout through resistance but pulled back.
Booking Holdings (BKNG), a travel stock, is also in an absolute and relative uptrend.

Expedia (EXPE) has staged upside breakouts on an absolute and relative bases out of long bases.

These are all signs of a healthy consumer. Costco (COST) has staged an upside and relative breakout to an all-time high. While Walmart (WMT), whose chart is not shown, did breakout on an absolute basis, its relative performance is not as strong.

Important cyclical winners
My technical scan also revealed strength in important cyclicals such as housing. DR Horton (DHI), a homebuilding stock, is in an absolute and relative uptrend.

A similar price pattern can be seen in Toll Brothers (TOL), though the stock has pulled back and consolidated its gains in the past few weeks.

Price strength isn’t just confined to homebuilding stocks. Boise Cascade (BCC), a supplier of building products, has also broken out to all-time highs on an absolute and relative basis.

TopBuild (BLD) is also exhibiting a similar pattern of strong absolute and relative breakouts.

Among the cyclically sensitive industrial stocks, General Electric (GE) staged upside absolute and relative breakouts out of multi-month bases. The chart pattern that differs industrials from other bullish patterns is the breakout occurred in early 2023, which was earlier than the others that I highlighted in this publication.

Caterpillar (CAT), another globally sensitive industrial stock, staged a similar upside in early 2023, but chopped sideways since the breakout. This is nevertheless a constructive pattern.

Fastenal (FAST) is a useful industrial bellwether as it’s a distributor of industrial and construction supplies. The stock broke out of a long base in late 2023 and soared last week after its earnings report.

Among the banks, which are also cyclically sensitive, JPMorgan Chase (JPM) is a standout. It staged an absolute breakout in late 2023 out of multi-month bases to an all-time high, though the relative breakout, which occurred at the same time, exhibited less strength.

By contrast, most of the bank stocks skidded badly at the time of the Silicon Valley Bank debacle, but retained their support levels in December 2023.

Special situations
My technical scan is not meant to be comprehensive and I apologize if I missed your favourite stock. It was meant to be a bottom-up technical review to highlight sector and industry strength. With that caveat in mind, I would be remiss if I didn’t point out the strength in a couple of special situations in outlier industries.


David Hunter almost a year ago was saying that we were still in a bull market, that the S&P could go to 6000 or more and then collapse losing 80 to 90%. He kept saying bull markets don’t just end like 2022.
So we have to think 1929, or late 90s Nasdaq.
For now, we have a bull market A lot of times when there is a correction that then breaks out there is a symmetry of upside and downside, so from 4800 down to 3600, the upside is 6000 which is curiously what Hunter said long ago. Analogues are not reliable, but in 1998 we had LTCM, in 2020 we had covid. In 2000 the S&P dipped from 1400 to 1250, when it broke out it went to about 1550 before the bear took over and prices went definitively below the 1 year MA.
The good news is that the market should still have legs for several months…should…one never knows.
About 4-5 weeks ago, a post talked about financials as a high conviction idea. Today, financials barely get a thumbs up. Has your view changed?
It seems to me that the market is still being led by handful of stocks. AI related stocks are the major beneficiaries. If there is to be a cyclical upturn, several sectors should be showing uptrends. Think of financials, materials, consumer discretionary and industrials.
Market is pricing in six rate cuts and 12% earnings growth in 2024. Jury is still out.
Price momentum is strong, for sure. The music can stop anytime.
I think that financials should still be ok. JPM, V and MA (not shown) are strong leaders and would benefit if growth were to falter and leadership rotates to value.
I personally believe MSFT is a once in a lifetime opportunity. They are at the leading-edge of a transformational technology, large language generative A.I. that will be widespread quickly. It is early days. An interview with a MSFT exec in the office products area said it is bigger than the phone, the internet or the P.C. Bold, but Bill Gates says it’s the third transformative technology he has seen in his experience after his MSDOS for small computers and Steve Jobs smartphone. That is high praise from someone I trust.
Plus, they are first to make real money. They are hosting cloud computing of OpenA.I. and also selling Microsoft Copilot (OpenA.I. assistant) as an add-on to their 365 monthly Office package (Outlook, Word, PowerPoint, Excel). They even are adding a CoPilot key to their new keyboards. Bing, their browser will get a big boost using OpenA.I.
There will be lots of hype around this as companies add A.I. to products but adding it to a car or a refrigerator isn’t the same as changing your product offering for major improvement like MSFT and offering business customers (basically all businesses) great productivity enhancing tools that will be easier and easier to use.
What portfolio manager could not own the stock? What exec, investor or portfolio manager walking around Davos listening to the A.I. banter could not own it.
The forward PE is low 30s, normal for the stock and estimates are likely too low as they have been with Nvidia. Things are ramping up quickly.