Preface: Explaining our market timing models


The latest signals of each model are as follows:
- Ultimate market timing model: Buy equities (Last changed from “sell” on 28-Jul-2023)
- Trend Model signal: Bullish (Last changed from “neutral” on 28-Jul-2023)
- Trading model: Neutral (Last changed from “bullish” on 24-Jan-2024)
Update schedule: I generally update model readings on my site on weekends. I am also on X/Twitter at @humblestudent. Subscribers receive real-time alerts of trading model changes, and a hypothetical trading record of those email alerts is shown here.
Subscribers can access the latest signal in real time here.
A 2024 roadmap

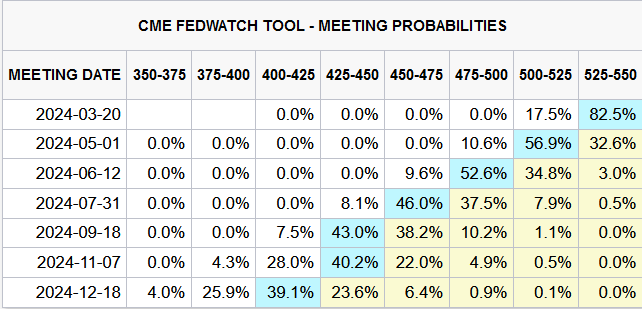
A May rate cut?
The timing of a May market rally is reinforced by the increasing likelihood of a rate cut in May. The Fed has made it clear that it doesn’t like to surprise the markets. The messaging from the January FOMC meeting is the rate cycle is turning and rate cuts are coming in sight, but not yet.
The timing of a stock market surge in May is reinforced by the historical pattern that stock prices rise dramatically after the first rate cut when there is no recession.

Remember, the Fed doesn’t just cut rates during recessions. In the current circumstances, hold rates steady as inflation falls, raises the real Fed Funds rate, which makes monetary policy increasingly restrictive. Powell said during the press conference that the Fed is confident inflation is falling, but it’s looking for “greater confidence”. The data doesn’t have to surprise to the downside, the disinflation trend just had to continue: “We’re looking at continuation of the good data that we’ve been seeing, and a good example is inflation.”

The key risk to the disinflation narrative is a re-acceleration of inflation. The most recent ISM Manufacturing survey shows an unexpected pick-up in manufacturing activity and prices. Goods inflation had been a major source of disinflationary pressure when supply chain bottlenecks normalized, but normalization has translated into renewed strength and upward price pressures.

The transitory disinflation narrative received a boost from the January Payroll report. Headline nonfarm payroll came in at 353,000, compared to an expected 187,000. Revisions in November and December added an additional 126,000 jobs compared to original reports.

The blockbuster jobs report will undoubtedly be revised based on some puzzling internals indicating weakness. The more volatile household survey showed a loss of 31,000 jobs, which follows the loss of 683,000 in December. In addition, average weekly hours fell from 34.3 to 34.1.

One piece of the puzzling jobs report can be found in my estimate of aggregate earnings (calculated as nonfarm payroll employment X average hourly earning of non-supervisory workers X average weekly hours). Even though I made some shortcuts in making the estimate, its growth rate is falling in lockstep with inflation.

These results allow some comfort with the consensus forecast of a May rate cut.
Prepare for near-term choppiness
Looking forward to the next few months I see a choppy market ahead.

As well, asset manager positioning is at a crowded long, which is contrarian bearish.

Market leadership isn’t broadening out, which is problematic in two ways. In the long run, negative breadth divergences are worrisome, but such divergences can take months to play out before prices top out. In the short run, narrow leadership magnifies the stock-specific risk of the leadership group.
To illustrate the point about the magnification of stock-specific risk affecting the index, five of the Magnificent Seven reported earnings last week. The market had positive reactions to two, Amazon and Meta, and negative reactions to three, Alphabet, Apple and Microsoft. Fortunately, for the bulls, the higher magnitude of the positive reaction of two stocks offset the aggregate reaction of the three stocks that disappointed investors, but the index could have easily turned down.

Friday’s rally was highly unusual inasmuch as this S&P 500 was up over 1% and made a new all-time high while the equal-weighted S&P 500 was flat on the day, which is a sign of extremely narrow leadership.

Jason Goepfert observed that Friday saw the rare instance of the S&P 500 was up over 1% but there were more losing than winning stocks on the day. A historical study shows that forward returns were weak under those conditions.

As well, keep an eye on the regional banks. The current New York Community Bancorp sparked downdraft is different from the one last March inasmuch as this could be the start of a credit crisis, compared to a duration mismatch problem in March. While market psychology believes the problem is contained for now, a breach of relative support (bottom panel) could be the spark for a larger drawdown in stock prices.


4 thoughts on “Get ready to buy in May…”
Comments are closed.
Cam
Presuming the above premise is correct, would there be an advantage to those portfolios that are heavily skewed towards magnificent seven and technology stocks by comparison to those with a higher proportion of value stocks or equal weighted portfolios?
NASDAQ extended short term. Correction risk. Rest of the market, not as much. We have a very bifurcated market.
OK. I shall hold current portfolio weights to a lower exposure to tech. Will add tech exposure as/if market corrects, a theme also echoed by Ravindra, yesterday. Your yesterday’s article on stocks under Trump 2.0 was timely, thought provoking and alarming. It does behoove one to raise portfolio weights of gold and precious metal stocks. The US has engaged in a major war every decade, starting from 1991, and I believe we are due for a new war here, soon.
Cam, is there a way to get a “live” version of the 50dma% chart you have displayed right above?
Thanks