Preface: Explaining our market timing models
We maintain several market timing models, each with differing time horizons. The “
Ultimate Market Timing Model” is a long-term market timing model based on the research outlined in our post,
Building the ultimate market timing model. This model tends to generate only a handful of signals each decade.
The
Trend Asset Allocation Model is an asset allocation model that applies trend-following principles based on the inputs of global stock and commodity prices. This model has a shorter time horizon and tends to turn over about 4-6 times a year. The performance and full details of a model portfolio based on the out-of-sample signals of the Trend Model can be found
here.
My inner trader uses a
trading model, which is a blend of price momentum (is the Trend Model becoming more bullish, or bearish?) and overbought/oversold extremes (don’t buy if the trend is overbought, and vice versa). Subscribers receive real-time alerts of model changes, and a hypothetical trading record of the email alerts is updated weekly
here. The hypothetical trading record of the trading model of the real-time alerts that began in March 2016 is shown below.
The latest signals of each model are as follows:
- Ultimate market timing model: Buy equities (Last changed from “sell” on 28-Jul-2023)
- Trend Model signal: Neutral (Last changed from “bullish” on 15-Nov-2024)
- Trading model: Bullish (Last changed from “neutral” on 19-Dec-2024)
Update schedule: I generally update model readings on my site on weekends. I am also on X/Twitter at @humblestudent and on BlueSky at @humblestudent.bsky.social. Subscribers receive real-time alerts of trading model changes, and a hypothetical trading record of those email alerts is shown here.
Subscribers can access the latest signal in real time here.
Is the honeymoon over?
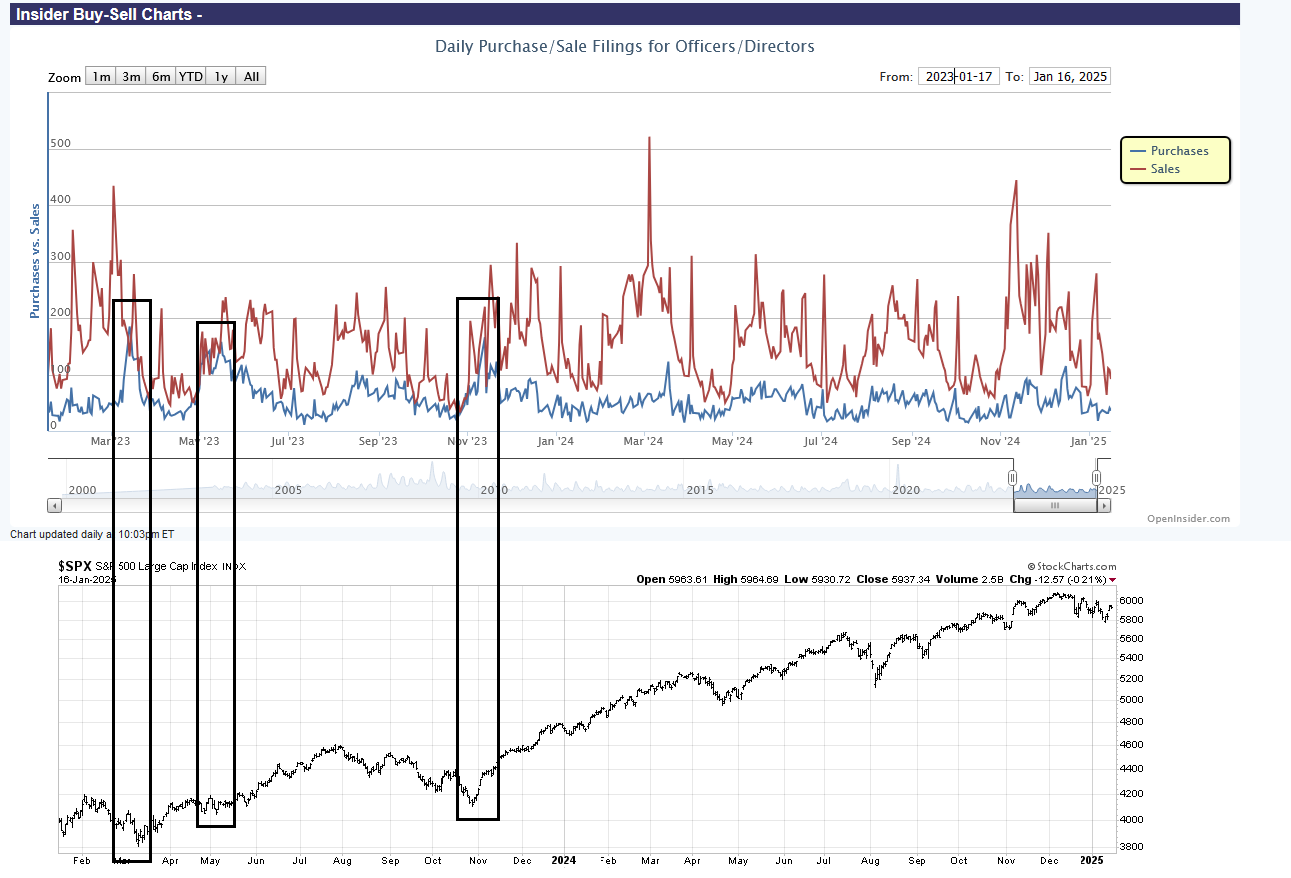
What’s rattling the stock market? The S&P 500 has been mired in a trading range that began in early November. It sold off in mid-December and flashed an extremely oversold reading on December 20. Subsequent rally attempts have failed and the index is testing its December lows. A definitive breakdown opens the door to a decline to the 200 dma at 5573.
Four weeks ago, I published an article entitled “The Public Embraces the Trump Honeymoon”. Under ordinary circumstances, a relief rally should be well underway by now. Is the honeymoon over? How patient should investors be with the bull case?
In search of a bearish catalyst
The stock market’s inability to rally argues that the market is concerned about another underlying risk factor that could lead to a deeper drawdown. If that’s the case, what’s the bearish catalyst?
For the time being, the decline in bond prices is driving the decline in stock prices. It’s possible that stock prices are responding to a deceleration in economic growth. The Citi Economic Surprise Index, which measures whether economic data is beating or missing expectations, has been falling. Such conditions should see bond yields decline, which would boost bond prices. Instead, bond yields have risen. That’s another head scratcher.
Another possible explanation for the risk-off tone is central banks are losing control of the bond market. Yields on the long end of the yield curve have been rising despite the general tone of monetary easing by central banks around the world.It’s just not Treasury yields. Yields in Europe have also risen and the carnage in U.K. gilts has been particularly acute. As well, Treasury yields soared Friday in reaction to the stronger-than-expected U.S. December Jobs Report.

The term premium, which measures how much investors demand to extend maturity, has been rising. In particular, the 10-year term premium (blue line) has risen faster than the 5-year term premium (red line) by reaching a high not seen in over a decade. By contrast, the 5-year term premium is not as acute by historical comparison.
Are these conditions reflective of rising inflation fears? The inflation factor trade of long inflation expectations and short the zero-coupon long Treasury has staged a dramatic breakout. The good news is it hasn’t exceeded the levels seen in October 2023.
Bond market sentiment shows elevated concerns about inflation, but readings are not stretched by historical standards.
None of this explains the stock market’s inability to rally from a deeply oversold condition.
One final possible explanation is the markets are concerned about the downside risk posed by the new Trump Administration. While the markets rallied in anticipation of Trump’s pro-growth policies and the promise of tax cuts, investors also have to contend with the bearish implications of a trade war, as well as the uncertainties of relations with allies such as Canada, Mexico, Greenland and Denmark, and Panama. And markets hate uncertainty.
It’s possible that the market is waiting for greater clarity.
Trust the models
In the end, I am inclined to trust the models in my tool kit that have shown a history of strong results from past buy signals.
One such model is my Bottom Spotting Model, which has shown a history of spotting tactical trading bottoms in the last five years. In the past, this model has triggered buy signals whenever two or more of the five components flashed buy signals. The five components are:
- The VIX Index spiking above its upper Bollinger Band.
- The VIX term structure inverts, which is an indication of fear.
- The NYSE McClellan Oscillator becomes oversold.
- TRIN spikes above 2, which is a sign of a “margin clerk” market indicating price-insensitive selling.
- The intermediate-term overbought/oversold indicator of the ratio of stocks above their 50 dma to stocks above their 150 dma falls below 0.5, which is an oversold extreme.
The five-year record of this model shows that there have been several occasions (circled) when the market weakened to test its previous lows. Outside of the COVID Crash (shown in pink) and one instance in 2022 (red arrow), the market has rallied after such signals.
Another model with a strong track record is the NAAIM Exposure Index, which measures the sentiment of RIAs who manage individual clients’ funds. The NAAIM Exposure Index flashes a tactical buy signal whenever it falls to the bottom of its 26-week Bollinger Band. Failures of these buy signals are few, and the study period includes episodes such as the GFC in 2008, the Greek Crisis in 2011 and COVID Crash in 2020.
What has this index doing now? It flashed a buy signal two weeks ago and the latest reading stabilized, indicating moderating fear.
In conclusion, markets have taken on a risk-off tone with few satisfactory bearish explanations. It’s possible that the combination of rising inflation fears and concerns about the lack of clarity over Trump’s policies is sparking the market’s cautious tone. I remain tactically constructive, as technical models with strong historical track records whose study periods include major catastrophic episodes argue that risk and reward are bullishly skewed. At worse, the current backdrop is a bond market tantrum and nothing like the GFC or COVID Crash. Other historical studies such from portfolio manager
Steve Deppe and
SentimenTrader also point to bullish market rebounds. Investors will see Q4 earnings season begin next week, as well as the CPI and PPI reports. A weaker than expected inflation report has the potential to dramtically change the bond market bearish narrative.
The key risk to the bullish assessment is Friday’s violation of support, if sustained, opens the door to a decline to the 200 dma at 5573. Bear in mind, however, the decline is occurring against a backdrop of positive divergences, as measured by the 5-day RSI and percentage of S&P 500 above their 20 dma.
By contrast, the violation of support by the Russell 2000 is less clear and definitive, though it is exhibiting positive divergences in a similar fashion.
From a technical perspective, the current risk-off episode looks like a plain vanilla bond market tantrum. The 30-year Treasury yield is encountering a resistance zone within the context of a rounded top formation.
My inner trader remains in his long S&P 500 position, but risk control will dictate the trigger of a stop-loss should price weakness continue. The usual disclaimers apply to my trading positions.