Preface: Explaining our market timing models
The latest signals of each model are as follows:
- Ultimate market timing model: Buy equities (Last changed from “sell” on 28-Jul-2023)
- Trend Model signal: Bullish (Last changed from “neutral” on 28-Jul-2023)
- Trading model: Neutral (Last changed from “bullish” on 23-May-2024)
Update schedule: I generally update model readings on my site on weekends. I am also on X/Twitter at @humblestudent. Subscribers receive real-time alerts of trading model changes, and a hypothetical trading record of those email alerts is shown here.
Subscribers can access the latest signal in real time here.
The bull isn’t done
Make no mistake, I am intermediate-term bullish on U.S. equities. The monthly MACD buy signal remains in force and there are no signs of any negative divergence that signals a major market top.
Beneath the hood, however, disturbing signs of that not all is well in the short run. Here are bull and bear cases.
The bull case
Let’s start with the bull case for stocks. It is said that there is nothing more bullish than a stock market that makes new highs. The current bull is still young by historical standards and should have much further to run.
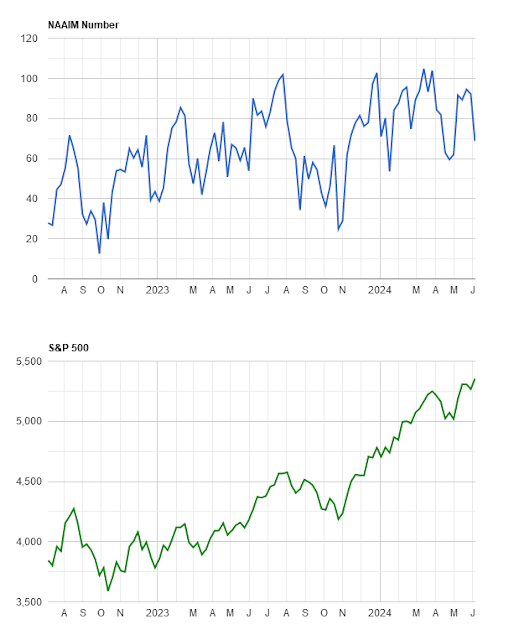
Sentiment readings are supportive of more gains. The latest NAAIM Exposure Index, which measures the sentiment of RIAs who manage individual investors’ funds, retreated from an excessively bullish reading to a neutral level.
The 10 dma of the CBOE put/call ratio rose steadily even as the S&P 500 rallied, which is a sign of skepticism of the market advance – another contrarian bullish signal.
Bearish cautionary signals
One of the most important “tells” of market direction is the relative performance of defensive sectors. If they outperform, it means that the bears are gaining control of the tape. The jury is still out on that score, but it is disturbing for the bull case that the relative performance of three of the four defensive sectors are bottoming and trading sideways even as the S&P 500 reaches all-time highs.
Equally concerning is the relative performance of most cyclical industries. With the exception of semiconductors, cyclicals have rolled over when measured against the S&P 500.
Jason Goepfert of SentimenTrader observed that the NASDAQ Composite made a record high even as 52-week lows exceeded 52-week highs. While the sample size is relatively small (n=10), the market has tended to resolve such conditions in a bearish manner. In light of the importance of NASDAQ growth stocks in the weight, this will pose severe near-term headwinds for the S&P 500.
Equally ominous is the appearance of a cluster of Hindenburg Omen signals for the NASDAQ. Single Hindenburg Omen signals tend to be insignificant, but clusters of omens have tended to precede downdrafts.
In addition, every formulation of the Advance-Decline Line is exhibiting negative divergences against the S&P 500.
None of these conditions are automatic sell signals as there are no bearish triggers. I was asked by several readers in the wake of my last post with bullish overtones if I was long the market in my trading account (see A well-telegraphed market advance). My answer isI interpret current conditions as a weak bull pushing price upward, but the market is fragile and can pull back at any time. My base case calls for stock prices to grind upward, albeit in a choppy manner over the next few weeks.


Another bullish factor is forward earnings estimates are rising strongly.