Preface: Explaining our market timing models
We maintain several market timing models, each with differing time horizons. The “
Ultimate Market Timing Model” is a long-term market timing model based on the research outlined in our post,
Building the ultimate market timing model. This model tends to generate only a handful of signals each decade.
The
Trend Asset Allocation Model is an asset allocation model that applies trend-following principles based on the inputs of global stock and commodity prices. This model has a shorter time horizon and tends to turn over about 4-6 times a year. The performance and full details of a model portfolio based on the out-of-sample signals of the Trend Model can be found
here.
My inner trader uses a
trading model, which is a blend of price momentum (is the Trend Model becoming more bullish, or bearish?) and overbought/oversold extremes (don’t buy if the trend is overbought, and vice versa). Subscribers receive real-time alerts of model changes, and a hypothetical trading record of the email alerts is updated weekly
here. The hypothetical trading record of the trading model of the real-time alerts that began in March 2016 is shown below.
The latest signals of each model are as follows:
- Ultimate market timing model: Buy equities (Last changed from “sell” on 28-Jul-2023)
- Trend Model signal: Neutral (Last changed from “bullish” on 15-Nov-2024)
- Trading model: Bullish (Last changed from “neutral” on 15-Oct-2024)
Update schedule: I generally update model readings on my site on weekends. I am also on X/Twitter at @humblestudent and on BlueSky at @humblestudent.bsky.social. Subscribers receive real-time alerts of trading model changes, and a hypothetical trading record of those email alerts is shown here.
Subscribers can access the latest signal in real time here.
The bulls seize control
The S&P 500 printed a bullish reversal last week. It began with a decline that was halted at the 20 dma and that’s just above a large price gap, followed by an outside reversal day when it exhibited a bullish engulfing pattern. The bullish reversal was confirmed when the index rose and filled a price gap that was acting as resistance.
The market action was a test for both bulls and bears. Gap fills, and how quickly they are filled, are a sign of the strength of the underlying trend. The filled upper gap is a signal that the bulls are seizing control of the tape once again.
Magnificent Seven leadership
Even as the S&P 500 struggled to fill the upside gap, the Magnificent Seven ETF (MAGS) signaled its leadership quality by filling the gap before the index. Moreover, MAGS has been in a relative uptrend since mid-October.
For traders, the market highlight of the week was the NVIDIA earnings report, which came in Wednesday after the bell. The stock has been in a well-defined uptrend that began in August and it’s now testing overhead resistance. The price reaction to the earning report turned out to be a non-event. Most notably, the stock has been roughly flat against the Magnificent Seven since early October, indicating that Magnificent Seven leadership is not just NVIDIA (bottom panel).
No breadth divergences
Under normal circumstances, Magnificent Seven leadership would be a sign of narrowing breadth, which would be a negative divergence and a warning of an unsustainable advance. Those concerns are alleviated by the sideways relative return pattern of the equal-weighted against the cap-weighted S&P 500 (middle panel) and the minor relative uptrend exhibited by the Russell 2000 in the past month (bottom panel).
An analysis of different Advance-Decline Lines shows that breadth is relatively healthy. Only the S&P 500 A-D Line has made an all-time high. The accompanying chart shows that breadth appears weaker as market cap decreases, as evidenced by the weaker performance of mid- and small-cap A-D Lines.
Another bullish data point can be found in the behaviour of risk appetite indicators. Both the relative performance of junk bonds (green line) and the relative performance of consumer discretionary to consumer staples (red line) is confirming the S&P 500 advance.
A possible sentiment warning
However, one key risk that appeared is a warning of excessively bullish sentiment from the option market, which is contrarian bearish. The 10 dma of the CBOE put/call ratio fell below its 1-standard deviation Bollinger Band, which has been a signal of a short-term top in the past.
However, other sentiment indicators, such as the AAII Bull-Bear spread, show a reading of 19.4, which is considered to be neutral and not wildly bullish.
Similarly, the NAAIM Index, which measures the sentiment of RIAs who manage individual investor funds, is elevated but well off the highs set in the last two years.
In conclusion, the S&P 500 arrested its decline at its 20 dma and exhibited a bullish reversal and this reversal was confirmed by bullish internals. My base case calls for a rally into year-end. The coming week is the start of the seasonally bullish period to year-end. One key risk is option sentiment is showing signs of froth, though other sentiment indicators remain in neutral territory.

My inner trader is staying bullish. The usual disclaimers apply to my trading positions.
I would like to add a note about the disclosure of my trading account after discussions with some readers. I disclose the direction of my trading exposure to indicate any potential conflicts. I use leveraged ETFs because the account is a tax-deferred account that does not allow margin trading and my degree of exposure is a relatively small percentage of the account. It emphatically does not represent an endorsement that you should follow my use of these products to trade their own account. Leverage ETFs have a known decay problem that don’t make the suitable for anything other than short-term trading. You have to determine and be responsible for your own risk tolerance and pain thresholds. Your own mileage will and should vary.
Disclosure: Long SPXL
The year is nearly over and the U.S. will see Donald Trump in the White House in 2025. Ryan Detrick’s analysis of historical equity returns found that stocks historically do better in the first two years of a president who was re-elected versus a new president in office. The key question is whether Trump 2.0 represents a re-election or a new term.
I unpack that question by focusing on the economic effects of Trump’s key initiatives, namely the TCJA tax cut extension, tariffs and immigration.
TCJA extension = Inflation?
Now that the Republicans have swept the White House, Senate and House, Trump is certain to push through legislation to extend the 2017 TCJA tax cuts that expire in 2025. He also made a series of tax cut promises on the campaign trail, such as no taxes on tips, overtime pay, social security benefits, car loan payments, and no federal taxes for police, fire fighters, military service members and veterans. As well, there is hope that the corporate tax rate would be cut further. At a minimum, the good news for CFOs is corporate tax rates are unlikely to rise.
The prospect of large increases in fiscal deficits is already rattling markets. Both the term premium (blue line), which is the spread investors demand to hold longer dated Treasuries, and inflation breakeven rates (red line) have risen.
The silver lining is that readings are near the top of historical ranges and inflationary expectations are not unanchored. Nevertheless, this is not good news for the bond market.
How inflationary are tariffs?
Trump campaigned on slapping 60% tariffs on all goods from China and 10% on all other countries. At first glance, such a proposal sounds highly inflationary, but the historical evidence indicates that tariffs may not be as inflationary as feared.
In 2018, the Trump Administration announced a 25% tariff on about half of the imports from China. The Chinese yuan fell about 10%, which roughly offsets all of the tariff effects. In effect, China absorbed the tariff increase through exchange rate depreciation.
A
Fed study found that the volume decline occurred in tariffed goods.
However, Trump’s efforts to re-shore production into the U.S. was unsuccessful. Imports shifted to other countries in response.
In a
different study, Fed economists modeled the effects of a tariff increase on economic activity and inflation in September 2018. To make a long story short, the study suggested that the Fed could decline to react to tariff-induced inflation under two key assumptions. First, inflation expectations have to stay anchored, and the pass-through of the cost shocks is short lived.
Undoubtedly, the Fed will be monitoring how the term premium and inflation breakeven rates evolve.
Stephen Miran, Senior Strategist at Hudson Bay Capital, made an intriguing proposal on how the Trump Administration could implement tariffs (see A User’s Guide to Restructuring the Global Trading System). He estimated that a 10% across-the-board tariff and a 10% appreciation of the USD as a currency offset would amount to a 0.3–0.6% increase in inflation.
Miran offered the following steps to mitigate tariff effects. First, he proposed a gradual tariff implementation policy, much like the steps taken during the 2018–2019 trade war. Tariff increases would be conditioned on “credible forward guidance, similar to what is used by the Federal Reserve across a range of policies, to guide expectations. The U.S. Government might announce a list of demands from Chinese policy—say, opening particular markets to American companies, an end to or reparations for intellectual property theft, purchases of agricultural commodities, currency appreciation, or more.”
In addition, he suggested forming a coalition of willing countries to create a trade wall around China by “putting countries into different groups based on their currency policies, the terms of bilateral trade agreements and security agreements, their values and more. Per Bessent (2024), these buckets can bear different tariff rates, and the government can lay out what actions a trade partner would need to undertake to move between the buckets.”
What about the strengthening USD, which makes U.S. exports less competitive?
Here, Miran suggested a Mar-a-Lago Agreement, in the manner of the Plaza Accord, to weaken the greenback. Participants would be encouraged to sell their Treasury assets to weaken the USD, offset by U.S. issuance of 100-year century bonds. This is the part of the proposal that sound the most dubious.
Immigration and deportation
Another key part of the Trump platform is restriction of immigration. In fact, he promised a mass deportation of undocumented immigrants from the U.S.
The Peterson Institute estimated the effects of Trump’s major promises in a
study. It modeled the effects on GDP and inflation of light (1.3 million people) and severe deportation (8.3 million), as well as different tariff rates and the revocation of Fed independence. Surprisingly, the largest effect on GDP was deportation. The magnitude of the effect of deportation is significantly higher than either tariffs or the revocation of Fed independence.
Axios reported that the two industries with the largest share of undocumented immigration employment are construction and agriculture. Deportation will create labour shortages, spark wage inflation and push up food prices.
For investors, mass deportation heightens the cyclical risk of the stability of the construction industry. Housing has been a key long-term indicator of economic health and any downturn could foreshadow a recession. Keep an eye on the relative performance of homebuilding stocks, which had been outperforming the S&P 500 in a choppy fashion since 2022. Elevated mortgage rates, which could be exacerbated by rising inflationary expectations that push up bond yields, along with rising labour costs from deportations, could sink this industry.
Investment conclusions
Looking to 2025, capital market returns are likely to be more uncertain than they have been in the past. The degree of dispersion in the range of forecasts is wider than usual. On one hand, Stephen Miran made the case that the effects of Trump tariffs could be relatively benign. On the other hand, Marketwatch reported that BCA Research set the probability of a U.S. recession at 75% in response to Trump’s victory.
There will be some losers, namely bonds, and construction stocks because of their sensitivity to both rising rates and heightened labour costs from deportation.
As for the stock market, the S&P 500 is trading at a forward P/E of 22, which is high relative to its own history and significantly higher than the level when Trump first took office in 2017. The good news is earnings estimates are rising and economic indicators don’t show significant recession risk. The bad news is earnings growth will have to bear most of the burden if stock prices were to advance.
Equity investors will have to weigh the balance of risks. Upside potential can be found in corporate tax cuts and deregulation. The sources of downside risk are trade wars and the negative effects of deportations on short run economic growth. For what it’s worth, the stock market may have a Trump Put in place. Various news outlets, such as the
NY Times, have reported that “Trump is seeking a Treasury secretary who will carry out his unconventional plans while still having the credibility to keep markets buoyant”. In other words, support his tariff plan and keep stock prices rising. Trump’s pick for Treasury, Scott Bessent, seems to fit that bill.
Mid-week market update: The decline in the S&P 500 seems to have been arrested at its 20 dma (blue line). The next question is which price gap gets filled first. A fill of the upside gap (in grey) would be positive for the bull case, while a fill of the downside gap (in pink) would indicate that the bears have seized control of the tape.
As investors await the market’s verdict, here are some clues on how the future may develop.
Magnificent Seven
The Magnificent Seven seems to be leading the market upward again. While the S&P 500 shows upside and downside gaps, there is no outstanding upside gap in the Magnificent Seven ETF (MAGS), which has been in a relative uptrend since mid-October.
Magnificent Seven leadership usually translates into narrow market leadership, which would be cautionary flag. An analysis of the relative performance of the equal-weighted S&P 500 and Russell 2000 shows that smaller stocks are either flat or slightly outperforming the S&P 500, which is a healthy sign for the bull case.
The NVIDIA elephant
Then there’s the NVIDIA elephant in the room, which is scheduled to report earnings after the bell today. Without trying to forecast what might happen in the short-term, here are some big picture thoughts on NVIDIA.
First, the current AI mania sentiment cycle is not yet fully mature compared to the Tech Bubble of the late 1990’s. The stock price of Cisco Systems, which had been the internet darling of the day, had become disconnected from its earnings. By contrast, the stock price of NVIDIA is still keeping pace with its earnings.
To be sure, the pace of AI sales growth is expected to decelerate in the coming months. Hyperscaler capex is expected to grow in 2025 and 2026, but growth won’t happen at the same torrid pace as the past.
The bears will argue that this is a sign of impending disappointment. As well, we are already seeing accounting tricks, such as large company X investing a significant sum into an AI startup, and the AI startup turns around to use those funds to pay the parent investor for cloud and other services, which grows the parent’s revenues and valuation.
The bulls will argue that if this is indeed a bubble, which it probably is, we haven’t seen the low-quality IPOs and nonsensical deals that come to market as everyone rushes to cash in on the bubble. I can recall a peak internet mania episode during the privatization roadshow of ENEL, the Italian electric utility. ENEL was forced to sell off several power generation plants for anti-monopoly reasons. At the same time, the company had announced an initiative to build a fibre optic cable network using their existing cable infrastructure. The CEO was asked at an institutional roadshow in Boston the reasoning behind the fibre optic network plan. The replay was, “Well, we had to do something with the EBITDA we lost from selling the power generation plants.”
The room fell silent. The level of excess today is nothing link the late 1990’s.
From a tactical perspective,
Renaissance Macro pointed out NVIDIA is their “buyer’s frenzy” indicator is flashing cautionary signs of excessive optimism going into the latest earnings report. Even then, the record of this indicator shows that too much bullishness has tended to resolve in flat price reactions, rather than large downdrafts.
My inner trader remains bullishly positioned. The NVIDIA report is a coin flip whose results I cannot call. But the stock is in a well-defined uptrend. Even if it were to disappoint today, its relative performance against the Magnificent Seven has been flat (bottom panel), and the stock market can continue to rise into year-end even under those circumstances.
As well, you can tell about the nature of market psychology the way it reacts to news. Equity futures fell overnight Monday when Russia rattled its nuclear sabre when it unveiled a news doctrine lowering the threshold for first use (see
NY Times article for details). The market recovered during the day to close positive. Had it been ready to fall, the downdraft would have been far worse.
The usual disclaimers apply to my trading positions.
I would like to add a note about the disclosure of my trading account after discussions with some readers. I disclose the direction of my trading exposure to indicate any potential conflicts. I use leveraged ETFs because the account is a tax-deferred account that does not allow margin trading and my degree of exposure is a relatively small percentage of the account. It emphatically does not represent an endorsement that you should follow my use of these products to trade their own account. Leverage ETFs have a known decay problem that don’t make the suitable for anything other than short-term trading. You have to determine and be responsible for your own risk tolerance and pain thresholds. Your own mileage will and should vary.
Disclosure: Long SPXL
Preface: Explaining our market timing models
We maintain several market timing models, each with differing time horizons. The “
Ultimate Market Timing Model” is a long-term market timing model based on the research outlined in our post,
Building the ultimate market timing model. This model tends to generate only a handful of signals each decade.
The
Trend Asset Allocation Model is an asset allocation model that applies trend-following principles based on the inputs of global stock and commodity prices. This model has a shorter time horizon and tends to turn over about 4-6 times a year. The performance and full details of a model portfolio based on the out-of-sample signals of the Trend Model can be found
here.
My inner trader uses a
trading model, which is a blend of price momentum (is the Trend Model becoming more bullish, or bearish?) and overbought/oversold extremes (don’t buy if the trend is overbought, and vice versa). Subscribers receive real-time alerts of model changes, and a hypothetical trading record of the email alerts is updated weekly
here. The hypothetical trading record of the trading model of the real-time alerts that began in March 2016 is shown below.
The latest signals of each model are as follows:
- Ultimate market timing model: Buy equities (Last changed from “sell” on 28-Jul-2023)
- Trend Model signal: Neutral (Last changed from “bullish” on 19-Jul-2024) [correction
- Trading model: Bullish (Last changed from “neutral” on 15-Oct-2024)
Update schedule: I generally update model readings on my site on weekends. I am also on X/Twitter at @humblestudent and on BlueSky at @humblestudent.bsky.social. Subscribers receive real-time alerts of trading model changes, and a hypothetical trading record of those email alerts is shown here.
Subscribers can access the latest signal in real time here.
Why gold will beat stocks
Looking ahead to 2025, I am reiterating my bullish call on gold from a long-term viewpoint. The recent pullback represents a buying opportunity in the metal from an asset allocation perspective.
Going back to 1980, we can see several distinct gold bull-bear cycles. Gold topped out at 850 in early 1980 and began a bear market that bottomed in 1985. It traded sideways and made a second bottom in 1999 and broke out to new recovery highs in 2004 and topped in 2011. It subsequently broke out again at 2,100 in early 2024. More importantly, it is tracing out saucer-shaped multi-year bases against different regional equity indices. The gold/Dow ratio is the weakest owing to the strength of U.S. stocks, but it is nevertheless distinctive. The Gold/EAFE ratio (all ratios are in USD) is about to stage a relative breakout, and the gold/EM ratio has marginally broken out of a 12-year base.
These technical patterns argue for a bullish commitment to gold for 2025 and beyond for all investors in all major currencies from an asset allocation perspective.
A detailed technical picture
Here is another long-term technical reason to be bullish. Not only did gold prices stage upside breakouts in USD, but also in all major currencies. The accompanying chart shows long-term breakouts to all-time highs in selected currencies, and even in the Swiss Franc (CHF), which is considered to be a “hard” currency.
The bottom panel shows the silver/gold ratio as an indicator of speculation in precious metals. The last major gold peak was accompanied by a spike in this ratio, which is not in evidence today. Sentiment readings are not in place for a major gold top.
The accompanying chart shows a close-up of the recent corrective action in gold. The violation of the rising trend line in USD is concerning, but gold did not violate the rising trend line in most other currencies, except for CNY. Arguably, the recent spike in the silver/gold ratio in October was a sign for traders that sentiment had become overly frothy and a pullback was due. Nevertheless, the overall technical structure of price action remains bullish and the correction should be regarded as a buying opportunity.
The end of disinflation?
Gold is useful as a diversifier in a portfolio because it’s a hedge against unexpected inflation. Bloomberg columnist John Authers recently made the point that the latest October CPI report is showing signs that the disinflation trend is fading. Different measures of CPI are above the Fed’s 2% target and they may have stopped falling (see
Inflation Needs Subtlety Right Now. It’s Getting Trump). In particular, Authers observed, “Both core services excluding shelter (the Fed’s so-called supercore, which has been given much emphasis over the last couple of years) and shelter ticked up very slightly and remain above 4%”.
Authers went on to cite CPI diffusion analysis by TS Lombard’s Steven Blitz showing that the pace of disinflation has slowed and turned up.
As well, there may be signs that the pace of increase in average hourly earnings are accelerating.
Taken together, the data probably don’t justify another rate cut next month. However, the Fed has a dual mandate. The latest employment figures showed weakness, and so on balance the path of least resistance is to cut again, but only by 25 basis points. Further, there’s a general expectation in the market that another cut is coming, and it might be dangerous to disappoint those hopes when the post-election markets are already volatile.
Fed Chair Powell agreed with Auther’s assessment. He signaled in a
speech that the Fed may not need to cut rates at the December FOMC meeting: “We are moving policy over time to a more neutral setting…we will carefully assess incoming data, the evolving outlook, and the balance of risks.
The economy is not sending any signals that we need to be in a hurry to lower rates.” [Emphasis added]
All of these trends are in place even before Trump takes office and none of them are attributable to his policies. Trump’s program of raising tariffs, extending tax cuts, and his stated intention of interfering with the Fed’s conduct of monetary policy is inflationary (see my analysis
Revisiting the Trump Trade). Even as gold prices corrected, inflation expectations, as measured by the 5-year breakeven rate, have been rising.
Waiting for the bottom
Tactically, I am waiting for the gold correction to bottom. Here is what I am watching.
Jason Goepfert at SentimenTrader that gold has tended to bottom when it falls 2% below its 50 dma, which just happened now. Will history repeat?
Another way of spotting a possible corrective bottom is to monitor the technical conditions of gold mining stocks. Gold Miners (GDX) are in a clear corrective phase and their 14-day RSI is oversold. The gold miner-to-gold ratio is near the bottom of its historical range, but readings are not at levels seen at recent bottoms. In addition, I would watch for percentage bullish to decline into, or at least near, the oversold zone before becoming turning tactically bullish.
Lastly, keep an eye on the USD Index. The Dollar rallied in the wake of Trump’s victory to the top of a range that began in 2023 and technical conditions appear extended. If it were to be rejected at resistance, a decline would be a tailwind for gold prices as the two tend to be inversely correlated.
In conclusion, gold prices have staged multi-year breakouts in multiple currencies, indicating a long-term bullish outlook. In addition, gold is on the verge of staging relative breakouts against global equity markets that point to multi-year outperformance ahead. The macro outlook calls for a re-acceleration of inflation, which is also positive for gold. Investment-oriented accounts should be accumulating gold in anticipation of superior returns in the years ahead.
Equity trading outlook
Looking to the week ahead, my inner trader is giving the bull case the benefit of the doubt and he is staying in his long S&P 500 position. The S&P 500 formed a probable bearish island reversal (box) last Friday, though the sharp drop could be attributable to option expiry hedging flow, and the index reached its downside target Friday (dotted line). The market remains in an uptrend, with potential support at the solid blue rising trend line, with secondary support at the breakout level (grey support zone). My inner trader’s line in the sand is the rising trend line. A breach of the line would be a stop-loss signal.
The usual disclaimers apply to my trading positions.
I would like to add a note about the disclosure of my trading account after discussions with some readers. I disclose the direction of my trading exposure to indicate any potential conflicts. I use leveraged ETFs because the account is a tax-deferred account that does not allow margin trading and my degree of exposure is a relatively small percentage of the account. It emphatically does not represent an endorsement that you should follow my use of these products to trade their own account. Leverage ETFs have a known decay problem that don’t make the suitable for anything other than short-term trading. You have to determine and be responsible for your own risk tolerance and pain thresholds. Your own mileage will and should vary.
Disclosure: Long SPXL
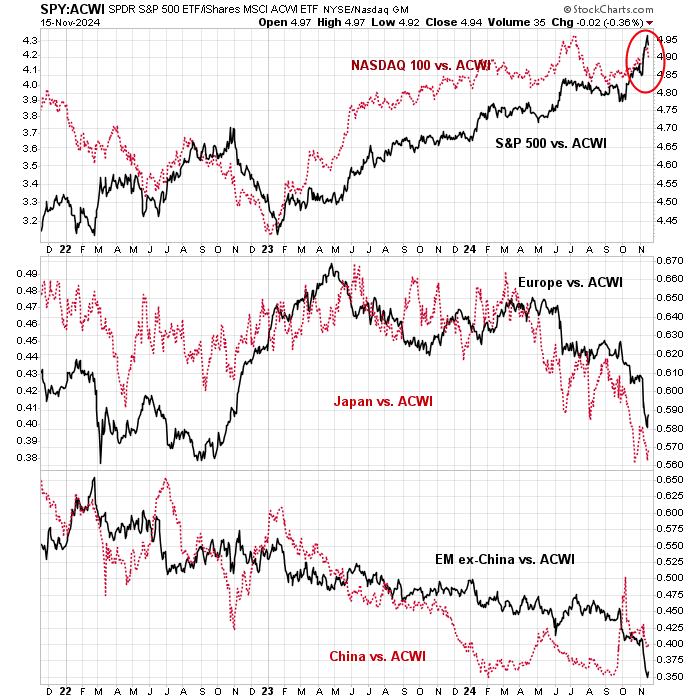
U.S. equity prices rose strongly in the wake of Trump’s victory. As the accompanying shows, both the S&P 500 and NASDAQ 100 surged on a relative basis, while other regions tanked.
Donald Trump promised to Make America Great Again. While he may have accomplished that task in the short run for U.S. stocks, can he do the same for all equities?
European and Asian weakness
Even as the S&P 500 and NASDAQ stocks soared to all-time highs, the price action for the rest of the world doesn’t look as bullish.
In Europe, both the Euro STOXX 50 and FTSE 100 are flat to down as both indices are trading below their respective 50 and 200 dma, indicating a loss of price momentum.
Over in Asia, the relative performance of Asian markets are also flat to down. Don’t expect global leadership to emerge out of Asia, especially in light of the well-known economic headwinds that faces China.
Commodity prices, which are market-based signals of global cyclical strength and Chinese cyclical strength in particular, are not showing any signs that a strong reflationary cycle is under way. The cyclically sensitive copper/gold and base/metal gold ratios (bottom panel) have traded sideways since August.
My Trend Asset Allocation Model applies trend-following principles to global equity and commodity markets to arrive at an overall risk appetite signal. It is therefore no surprise that the Trend Model is showing a neutral reading under these circumstances.
Can America stand alone?
The U.S. is the only exception to the sideways pattern of major markets around the world. Both the S&P 500 and NASDAQ stocks recently reached all-time highs. In other words, America stands alone, at least from the viewpoint of stock prices.
Can the bull continue? Here are the bull and bear cases.
The bull case is simple. Equity bulls care about two things: earnings growth and the cost of capital. Tax cuts will boost earnings growth. Deregulation could ignite the animal spirits in the markets. Specifically, less regulation should provide boosts for the technology, financial and energy sectors.
Falling interest rates lowers the cost of capital. The Fed began its rate cut with a half-point cut in October, followed by a quarter-point in November. Estimates of the neutral rate vary and range between 3% and 4%. Indicating there is more room for rates to fall.
Fiscal policy is stimulative and there are no signs of a recession on the horizon. The U.S. economy is firing on all cylinders. Real GDP growth is about 3%. The unemployment rate is about 4%. The AI revolution will boost productivity. Economic momentum is positive, as measured by the rising Economic Surprise Index, which measures whether economic statistics are beating or missing expectations.
What’s not to like?
The bear case rests mostly on valuation concerns. The S&P 500 is trading at a forward P/E of 22, which is highly elevated relative to its own history.
This is nothing like Trump 1.0 of 2017. When Trump first won the White House, the S&P 500 forward P/E was about 17. The corporate tax rate was 35% on its way to 21%, which was not expected by the market. The debt/GDP ratio was 98%.
Today, the S&P 500 trades at a forward P/E of 22. An extension of the TCJA, even with tweaks, is mainly a cancellation of an increase in the corporate tax rate. The debt/GDP ratio is 124% and expected to go even higher.
Trump’s tariff plan is not a free lunch. There will be retaliation. In addition, the interaction of TCJA and tariffs have had some unexpected results. While Trump’s tariff plan is to incentivize companies to re-shore manufacturing to the U.S., Brad Setser observed the enactment of TCJA sparked a surge in EU pharmaceutical exports, probably the results of strategies that offshored the production of drugs intended for the U.S. market to low-tax Ireland.

Moreover, tariffs are expected to be inflationary, which will tie the Fed’s hands in its easing cycle. As for Trump’s plan to incentivize companies to re-locate manufacturing facilities back to the U.S., the devil is in the details of any plan. Consider the decisions facing corporate boards that contemplate a plan to invest in manufacturing the U.S., or any location. Investment involves costs, which is relatively well-known, and an uncertain payoff. The risk/reward ratio has to be sufficiently favourable for a board to undertake such a decision. As well, companies have to consider secondary factors, such as the availability of trained labour, the productivity of the labour, and the existence of a supply chain ecosystem. After years of hollowing manufacturing, supply chains and trained personnel disappear. Technological leadership doesn’t just magically happen overnight.
This is a useful framework to think about how a re-industrialization process may play out. Investors need to consider a range of possibilities and how the demands of capital markets may drive corporate investment initiatives.
Cautious, but not bearish
Despite these risks, I am not bearish, but intermediate-term cautious on U.S. equities.
Stock prices depend on earnings growth and corporate funding costs. For now, forward 12-month earnings estimates are rising – and these figures were mostly taken before the election results were known.
While valuation concerns are valid, here are a range of possibilities of how earnings may change under Trump. Examples of conventional investment bank analysis from BoA and Goldman Sachs projects that cutting the corporate tax rate to 15% would boost S&P 500 EPS by 4%. All else being equal, today’s forward P/E of 22 would fall to 21.
Uber-bull Ed Yardeni raised his S&P 500 targets to 6100 for year-end 2024, 7000 to year-end 2025 and 8000 for year-end 2026. He raised his S&P 500 2025 and 2026 EPS from $275 to $290 and from $300 to $320, compared to a current consensus of $275 and $308, respectively, based on the promise of a corporate tax cut, deregulation and faster productivity growth. Similarly, Yardeni’s projections lower the forward P/E from 22 to 21.
Moreover, I am not seeing any signs of funding cost headwinds for stock prices. The accompanying chart shows estimates of the extremes of fund costs, as represented by junk bond yield spreads plus the 5-year Treasury rate (blue line) and the actual junk bond yields (red line). Overlaid on top of these yields is the NASDAQ 100 (black line), which is a proxy for the leading-edge public companies in the U.S. In the past two cycles, major NASDAQ bear markets were accompanied by increases in funding cost, which is not in evidence today.
In the short run, animal spirits are dominant in the U.S. I recently pointed out that the S&P 500 was testing the upper end of a rising trend line, and it was likely to pause and consolidate its gains. With the caveat that the NASDAQ Composite and the Russell 2000 have already overrun their rising trend line resistance, a projection of the S&P 500 trend line until year-end comes to about 6300, which could be an upside target should the combination of a FOMO buying stampede and Treasury liquidity flood continues.
Seth Golden came to a similar conclusion based on a study of post-election returns.
In conclusion, U.S. equities have surged in the wake of Trump’s electoral victory while stock markets in the rest of the world have been flat to down. While the combination of narrowing global leadership and elevated U.S. valuation are concerns, I remain cautious but not bearish on the U.S. and global equity markets. Fundamental and macro momentum are strong, and there are no signs of reversal in funding costs.
However, should the S&P 500 reach about 6300 by year-end, valuation pressures could put downward pressure on equity prices in 2025.