Preface: Explaining our market timing models

My inner trader uses a trading model, which is a blend of price momentum (is the Trend Model becoming more bullish, or bearish?) and overbought/oversold extremes (don’t buy if the trend is overbought, and vice versa). Subscribers receive real-time alerts of model changes, and a hypothetical trading record of the email alerts is updated weekly here. The hypothetical trading record of the trading model of the real-time alerts that began in March 2016 is shown below.

The latest signals of each model are as follows:
- Ultimate market timing model: Buy equities (Last changed from “sell” on 28-Jul-2023)
- Trend Model signal: Bullish (Last changed from “neutral” on 28-Jul-2023)
- Trading model: Bullish (Last changed from “neutral” on 16-Apr-2024)
Update schedule: I generally update model readings on my site on weekends. I am also on X/Twitter at @humblestudent. Subscribers receive real-time alerts of trading model changes, and a hypothetical trading record of those email alerts is shown here.
Subscribers can access the latest signal in real time here.
Key drivers
What are the key drivers of stock prices? There are some factors to keep an eye on:
- Interest rates;
- Geopolitical risk; and
- The earnings outlook.
The accompanying chart shows the market progress of the first two factors. The 7-10 year Treasury ETF (IEF) is staged an upside breakout of a narrow range that began in mid-February. The USD, which is tied to interest rate differentials in the short run, has also break down out of a similar trading range. These are constructive signs that the interest rate environment is benign. Geopolitical risk indicators like oil and gold prices are in retreat, which are signals of a narrowing risk premium on the market.

Fed policy not hawkish
The good news is the Fed hasn’t taken a hawkish pivot. At the May post-FOMC press conference, Jerome Powell pushed back against the odds of a rate hike:
JEANNA SMIALEK. Thanks for taking our question, Chair Powell. I wonder, obviously Michelle Bowman has been saying that there is a risk that rates may need to increase further, although it’s not her baseline outlook, I wonder if you see that as a risk as well, and if so, what change in conditions would merit considering raising rates at this point?
CHAIR POWELL. So I think it’s unlikely that the next policy rate move will be a hike. I’d say it’s unlikely. You know, our policy focus is really what I just mentioned, which is how long to keep policy restrictive. You ask what would it take, I think we’d need to see persuasive evidence that our policy stance is not sufficiently restrictive to bring inflation sustainably down to 2 percent over time. That’s not what we think we’re seeing, as I mentioned, but something like that is what it would take. We’d look at the totality of the data and answer that question that would include inflation, inflation expectations, and all the other data too.
JEANNA SMIALEK. Would that be a reacceleration in inflation?
CHAIR POWELL. Well, I think again, the test, what I’m saying is, if we were to come to that conclusion that policy weren’t tight enough to achieve that. So it would be the totality of all the things we’d be looking at. It could be expectations, it could be a combination of things, but if we reach that conclusion and we don’t see evidence supporting that conclusion, that’s what it would take I think for us to take that step.

The market remains on edge because of an acceleration in wage rates. The Employment Cost Index (ECI), which measures both wages and benefits, came in at 1.2% for Q1, which was higher than the expected 1.0%. Q1 unit labour costs also came in at a hot 4.7%, ahead of an expected 3.6%. The April Jobs Report shows a welcome cooling in the labour market. The headline employment was softer than expected at 175,000 and, more importantly, average hourly earnings also missed Street expectations.

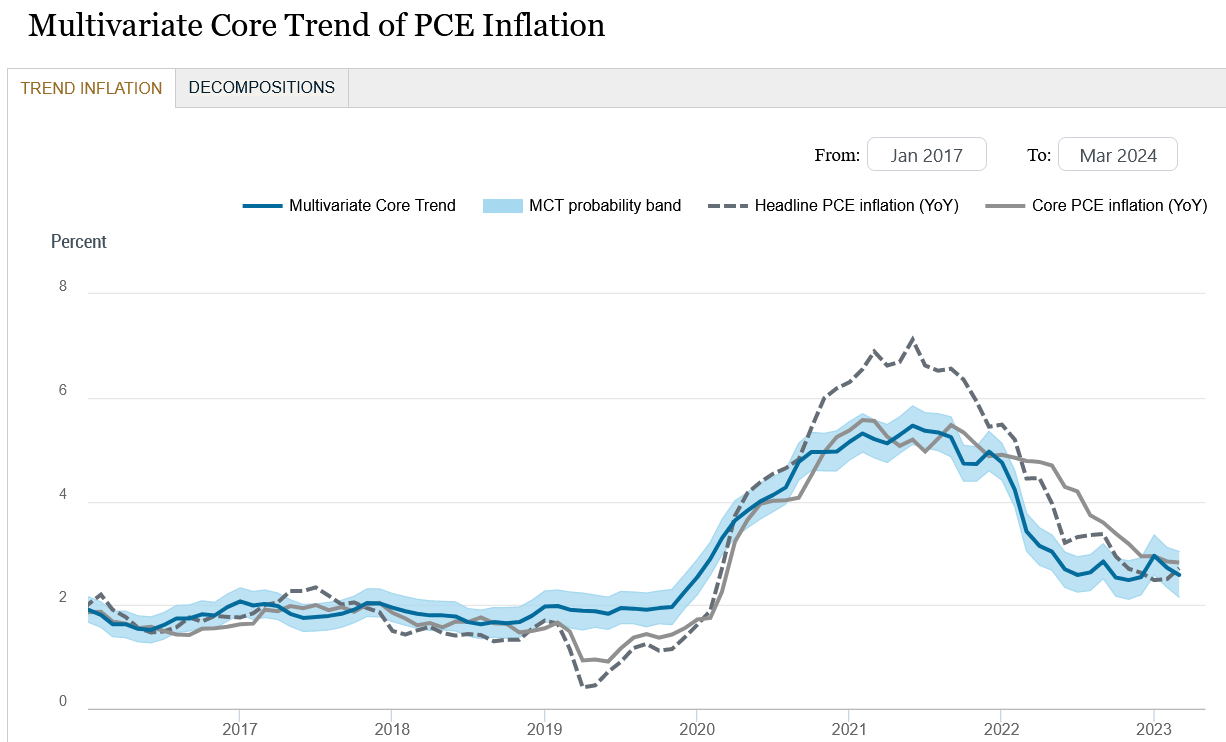
In addition, the New York Fed’s Multivariate Core Trend Inflation, which is an indicator of inflation persistence, fell to 2.6% in March.
In reaction to the softer than expected April Jobs Report, the market is discounting two rate cuts in 2024, with the first occurring at the September FOMC meeting.

Constructive earnings outlook
With Q1 earnings season in full swing, earnings reports have generally been better than expected. The EPS beat rate is 77%, which is equal to the 5-year average of 77% and ahead of the 10-year average of 74%. More importantly, forward 12-month EPS estimates are rising.

This means that the recent market downdraft was driven by P/E compression and not earnings fundamentals, which have been improving. As the forward-looking inflation outlook seems to be decelerating and the Fed is not hawkish, this should lead to a stabilization in P/E ratios and possible P/E expansion, which would be positive for stock prices.
There is even more bullish macro news. Recession Alert found that the net percentage of 39 OECD countries with rising leading economic indices (LEIs) and the net percentage of 39 central banks that are easing rates are powerful leading indicators of U.S. stock prices with a 7-10 month lead at an r-squared of 0.57.

Signs of healing
In the short run, the technical structure of the market is pointing to healing, which is a signal that the correction may be coming to an end.

Risk appetite indicators present a mixed but slightly bullish picture. The ratio of high beta to low volatility stocks is tracking the S&P 500, but high yield bond relative performance has been flashing a minor positive divergence.

Lastly, investors shouldn’t be overly worried about the negative seasonality effects of “sell in May and go away”. Callum Thomas at Topdown Charts found a distinct difference between May–October seasonality during bull and bear markets. Notwithstanding the bullish reasons that I have already cited for higher stock prices, as long as the S&P 500 stays above its 200 dma, you can consider this to be a bull market.

The one short-term blemish to the bullish outlook is a continued deterioration in banking system liquidity, which could put a lid on any stock price rally and possibly even spark a re-test of the recent lows.

The S&P 500 faces an important short-term test in the coming week. The index rallied to test its 50 dma resistance and it’s in a heavy resistance zone. The bulls need to see some upside follow through. Stay tuned.

In conclusion, a review of the main short-term drivers of stock prices, namely interest rates, geopolitical risk and the earnings outlook, are all pointing to higher stock prices. As well, short-term technical indicators such as breadth and momentum are also bullish. The key risk to this bullish outlook is a continued deterioration in banking system liquidity that could pose headwinds to stock prices.
I would like to add a note about the disclosure of my trading account after discussions with some readers. I disclose the direction of my trading exposure to indicate any potential conflicts. I use leveraged ETFs because the account is a tax-deferred account that does not allow margin trading and my degree of exposure is a relatively small percentage of the account. It emphatically does not represent an endorsement that you should follow my use of these products to trade their own account. Leverage ETFs have a known decay problem that don’t make the suitable for anything other than short-term trading. You have to determine and be responsible for your own risk tolerance and pain thresholds. Your own mileage will and should vary.
Disclosure: Long SPXL
Re earnings for Q1, revenue beats are running only at 61% compared to 69% for last five years. The eps beats are matching five year average.
Which sectors are beating? That would be helpful to know and what are the forecasts for the next 3-4 quarters?
https://static.seekingalpha.com/uploads/2024/5/5/saupload_Screenshot_2024-05-05_at_4.24.42_PM.png
Pure data crunching. Data of last 20 years.
1. growth over value: May – Aug
2. AAPL: big upside May – Oct
The simple one-indicator: $NYSI: bottomed around 150 and RSI14 about to recover over 30. Most likely a small rebound in indices. VIX is low, favorable environment.