Preface: Explaining our market timing models
We maintain several market timing models, each with differing time horizons. The “Ultimate Market Timing Model” is a long-term market timing model based on the research outlined in our post, Building the ultimate market timing model. This model tends to generate only a handful of signals each decade.
The Trend Model is an asset allocation model which applies trend following principles based on the inputs of global stock and commodity price. This model has a shorter time horizon and tends to turn over about 4-6 times a year. In essence, it seeks to answer the question, “Is the trend in the global economy expansion (bullish) or contraction (bearish)?”
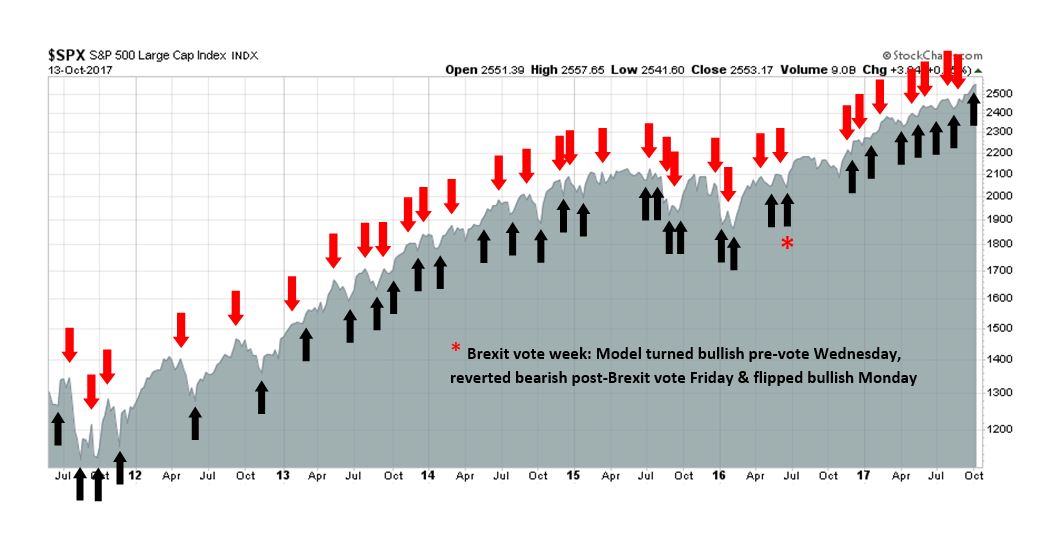
My inner trader uses the trading component of the Trend Model to look for changes in the direction of the main Trend Model signal. A bullish Trend Model signal that gets less bullish is a trading “sell” signal. Conversely, a bearish Trend Model signal that gets less bearish is a trading “buy” signal. The history of actual out-of-sample (not backtested) signals of the trading model are shown by the arrows in the chart below. Past trading of the trading model has shown turnover rates of about 200% per month.
The latest signals of each model are as follows:
- Ultimate market timing model: Buy equities
- Trend Model signal: Bullish
- Trading model: Bullish
Update schedule: I generally update model readings on my site on weekends and tweet mid-week observations at @humblestudent. Subscribers will also receive email notices of any changes in my trading portfolio.
The challenges of a late cycle bull
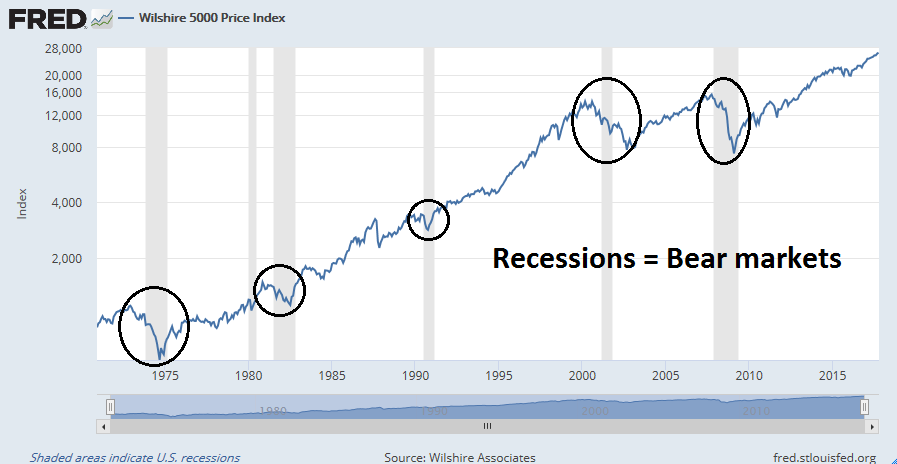
I have been making the point that the American economy is in the late stages of an expansion. This presents some investment challenges as an inflection point may be near. As the chart below shows, while every equity downdraft has not signaled a recession, every recession has seen an equity bear.
The question is, “How far away are we from a recession?” I try to answer that question this week by focusing on three components of the economy using the leading indicators in my Recession Watch Monitor:
- The household sector;
- The corporate sector; and
- Monetary conditions.
Further, I analyze the nowcast of the economy and the market outlook from both macro and technical viewpoints. The market may be setting for a scenario where stock prices melt-up, followed by a market crash of unknown magnitude.
Signs of a late cycle expansion
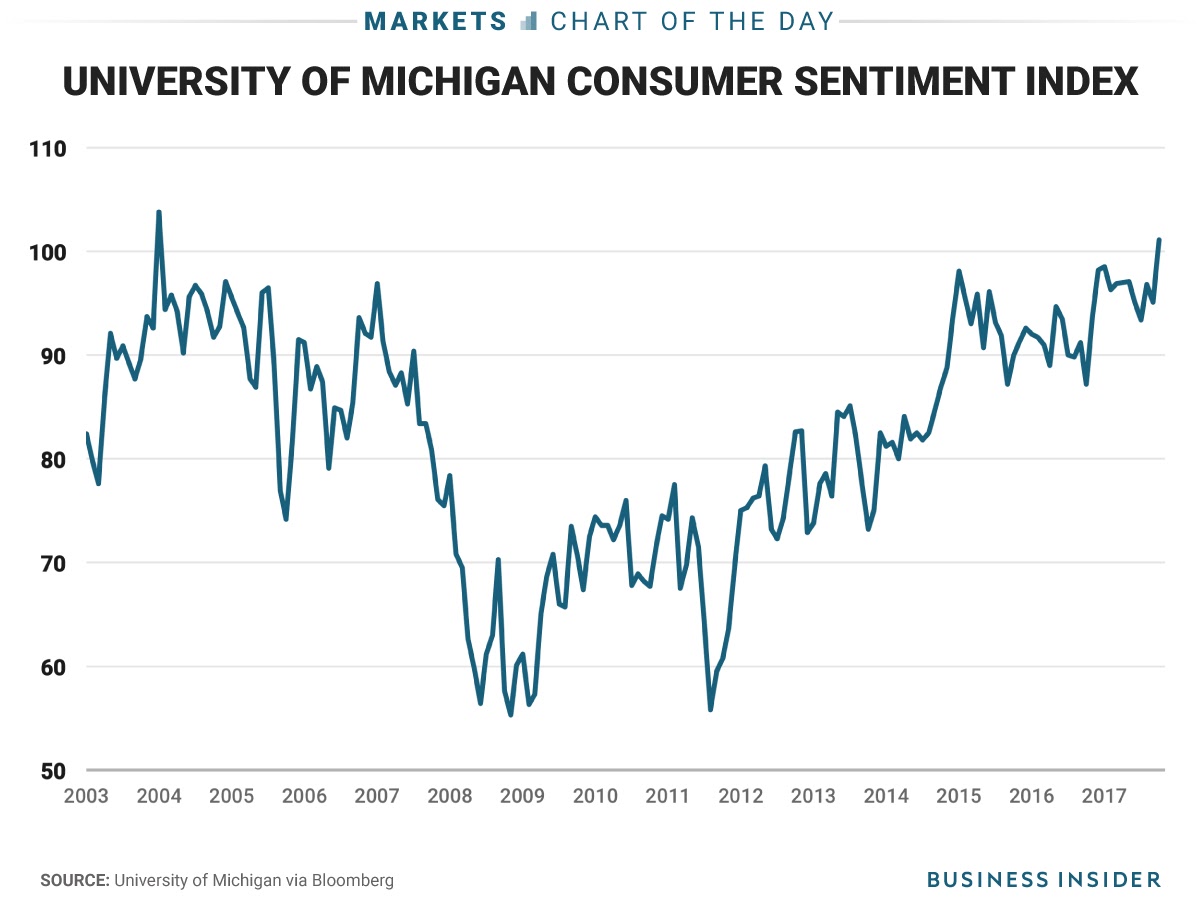
The market was pleasantly surprised on Friday by the better than expected retail sales figure, and tamer than expected CPI release. As well, consumer sentiment surged to a new cycle high.
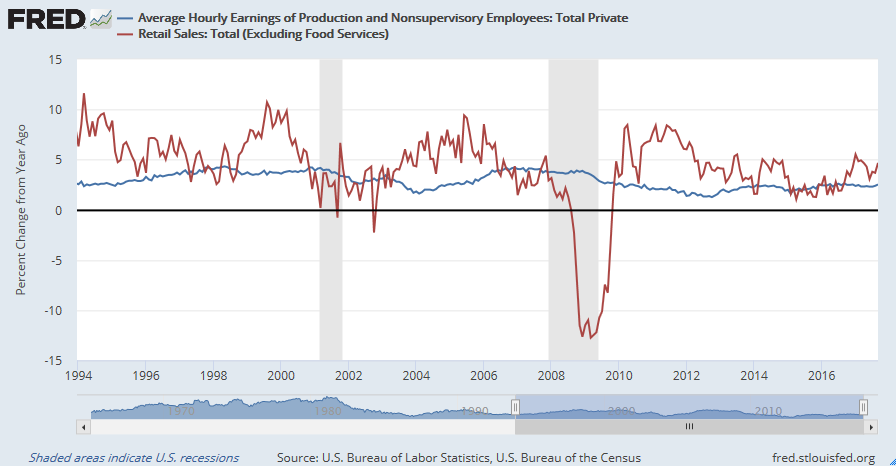
While Friday’s data represents good news in the short term, the combination of strong retail sales (red line) and the lack of wage growth (blue line) means that the household sector will eventually have trouble supporting consumer spending at the current pace.
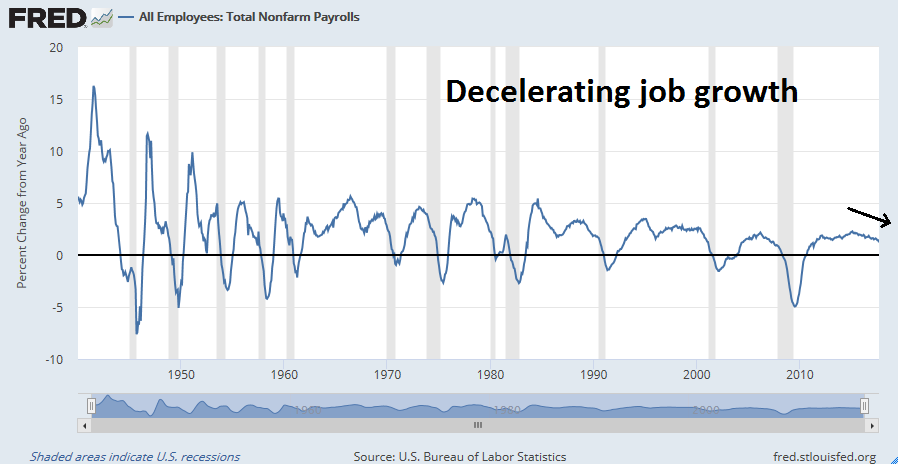
There are a number of ways that the household sector can cope. More members of the household can find jobs. Employment statistics remain strong, though the pace of improvement is decelerating. While a deceleration in non-farm payroll employment is not a warning of recession, it does indicate that the economy is well past the mid-cycle phase of its expansion.
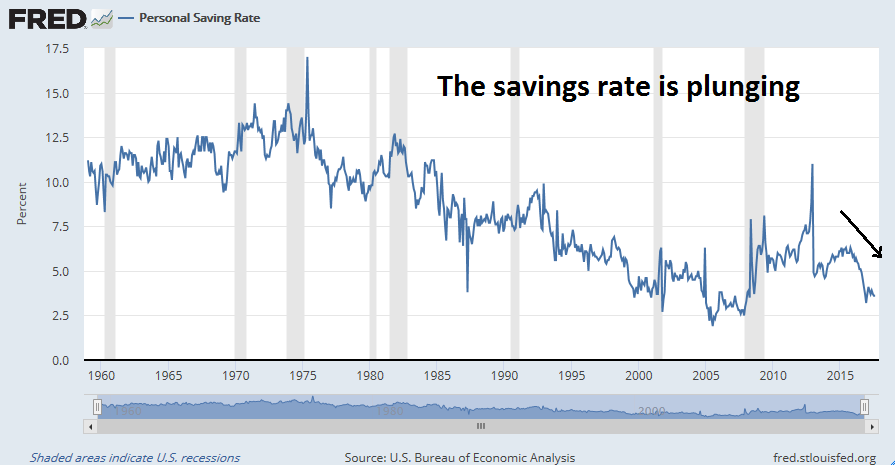
Another way the household sector can keep on spending is by cutting back its savings rate.
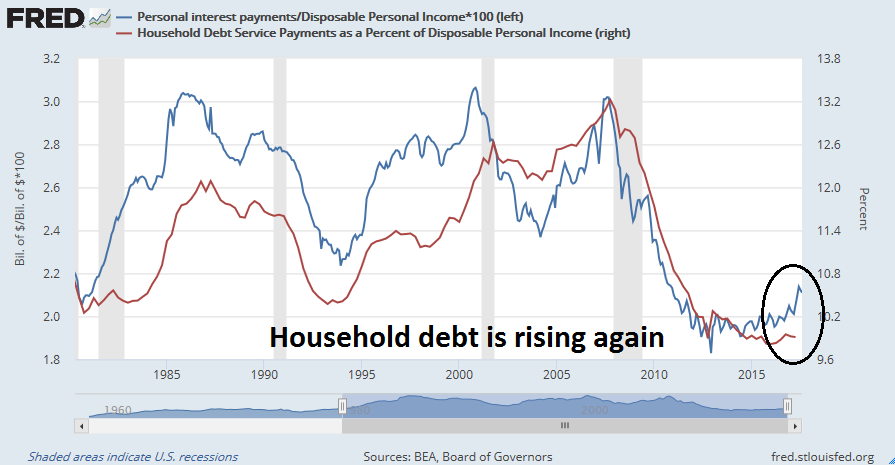
Finally, households can take on more debt as a last resort to maintain spending patterns. I call this the “keeping up with the Joneses” effect. As the chart below shows, household debt levels are rising again after deleveraging in the wake of the last financial crisis.
The stresses are already showing up in big ticket consumer durable purchases. Auto sales appear to have peaked for this cycle, though the latest spike is probably related to the replacement of hurricane damaged vehicles.

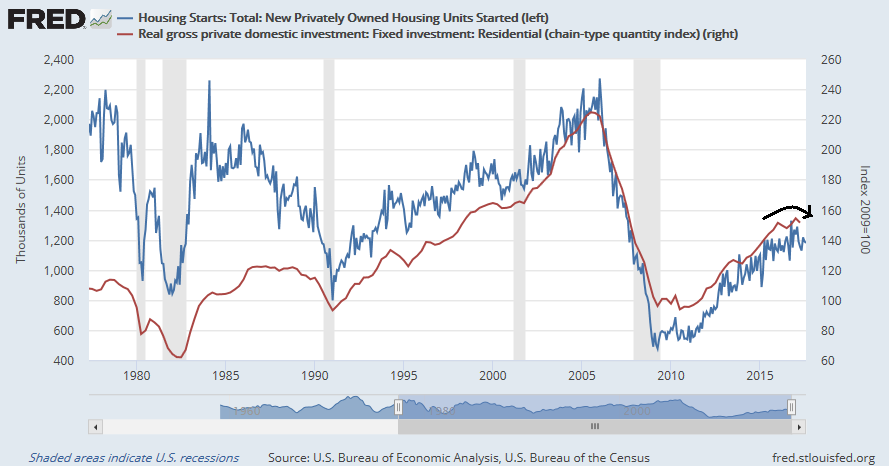
The housing sector, which is an important cyclical part of the economy, has also peaked for this expansion.
In summary, while headline retail sales remain strong, internals reveal signs of underlying weakness. By themselves, none of these indicators are signals to hit the panic button. They are just signs of a late cycle expansion.
Rising corporate stress
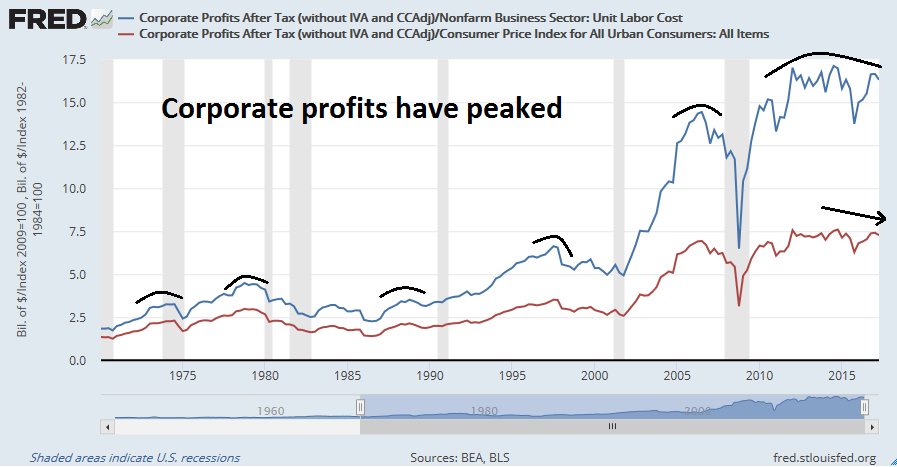
The corporate sector is another story. NIPA corporate profits have peaked for the current expansion and they are starting to roll over.
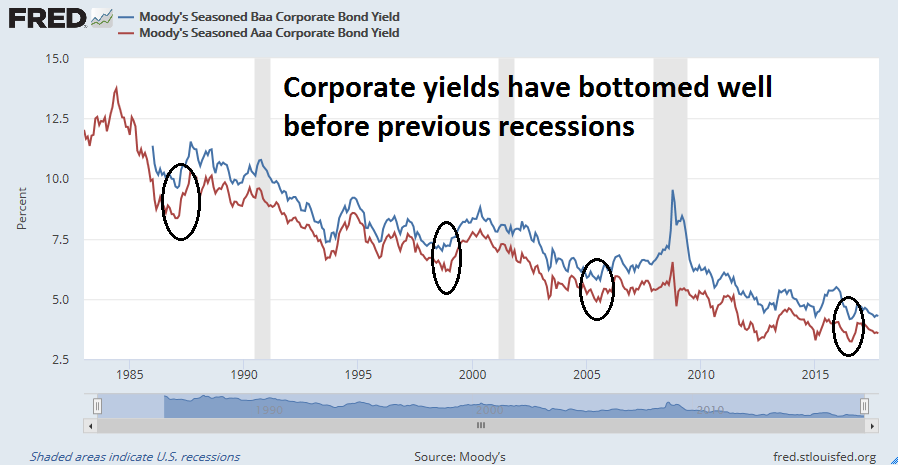
As well, the debt financing costs of corporations have bottomed for this expansion. Corporate bond yield bottoms have generally occurred ahead of past recessions.
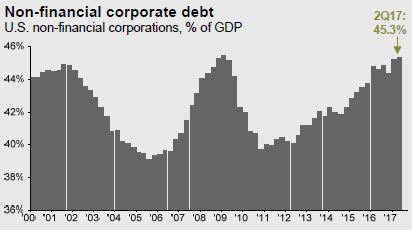
The corporate sector has also re-levered its balance sheet to levels seen at past cycle peaks. The combination of consumer spending poised to turn down, peaks in corporate profits, and bottom in debt financing costs makes the companies vulnerable to a downturn.
Still, these are not reasons to hit the panic button just yet. They just represent a “this will not end well” investment thesis, with no obvious clues on timing.
An easy Fed
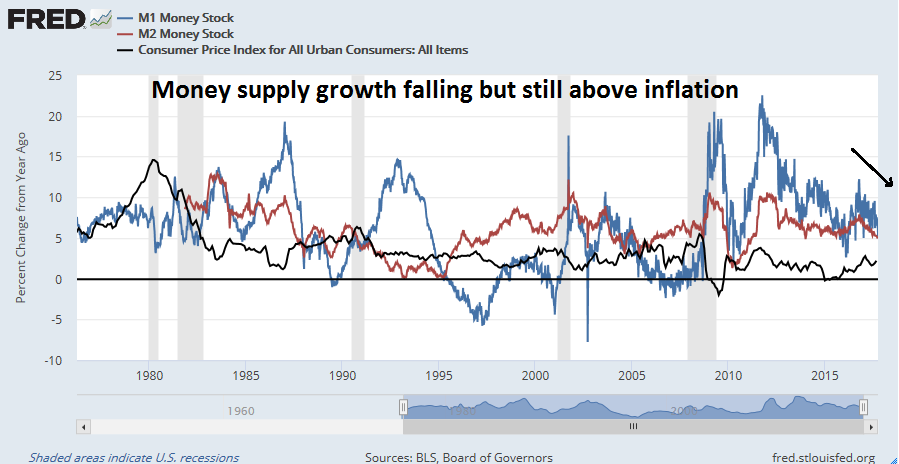
The one single factor that is still holding up the US economy is Fed policy. Despite the Fed’s professed desire to normalize rate, monetary policy remains loose. As the chart below shows, real money supply growth is falling but still positive. If history is any guide, nominal money growth has fallen below CPI inflation (black line) ahead of recessions in the past.
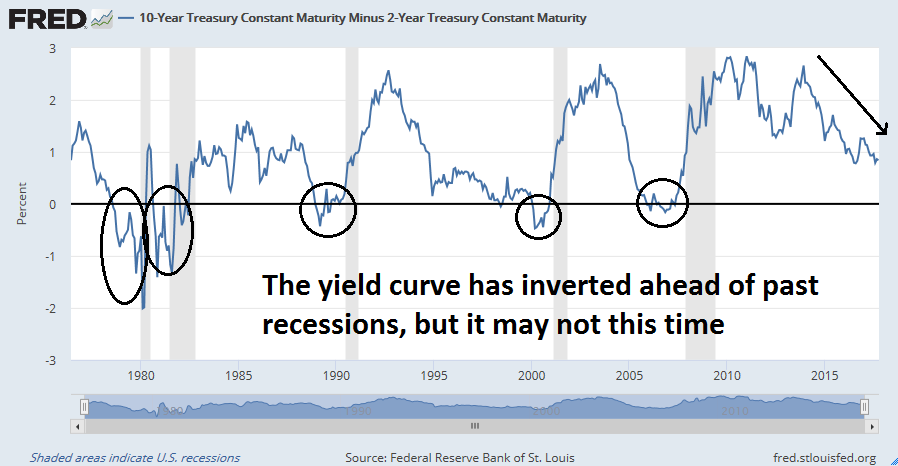
In addition, the yield curve has not inverted. An inverted yield curve has been a surefire signal of recession in the past. The possibility exists that the yield curve may not invert this time because of the Fed’s balance sheet normalization program. By the Fed’s own estimates, its QE programs flattened the yield curve by about 100 bp. The reversal of that program should have a steepening effect on the yield curve, and therefore this indicator may not be as effective recessionary signal as it had been in the past.
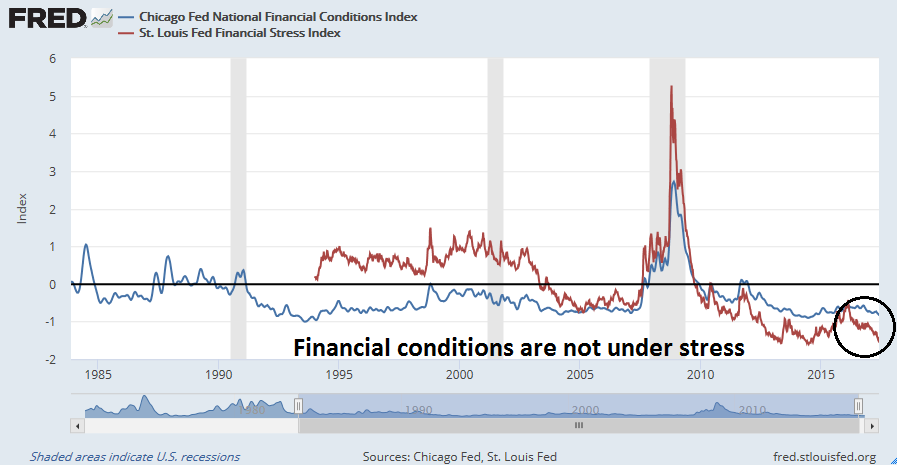
Financial conditions are not showing much signs of stress. This underscores New York Fed president Bill Dudley’s point that, as long as financial conditions are not stressed, the Fed should continue to normalize monetary policy.
Future Fed policy as wildcard
In effect, the future trajectory of Fed policy will be the wildcard for determining capital market returns. That is where a lot of policy uncertainty comes in.
It is said that the Trump administration will announce the nomination for the Fed chair in the next few weeks. By all accounts, Janet Yellen is unlikely to be re-appointed. The two front-runners are said to be Jerome Powell and Kevin Warsh. It appears that Donald Trump will look for three qualities in a Fed chair. In no particular order, they are:
- Deregulation bias
- Easy money bias
- Personal chemistry and loyalty
No candidate is perfect and ticks off all the boxes. Kevin Warsh is well-connected and he is likely to score well on the “personal chemistry” criteria. and if anyone is able to offer Trump personal loyalty, it would be Warsh. He is the son-in-law of major Republican contributor and Estée Lauder heir Ronald Lauder. Warsh believes in aggressive deregulation of the financial sector, but his speeches reveal him to be a rules-based monetary hawk. Wall Street would view a Warsh appointment as a negative, as the consensus view is he has a history of being behind the curve on monetary policy. A Warsh Fed is likely to introduce a higher degree of volatility to the US economy. For more, see this devastating takedown of Warsh by Sam Bell.
By contrast, Jerome Powell is viewed as the compromise candidate. Jerome Powell is a Republican technocrat and unlikely to offer Trump his personal loyalty. He has shown himself to be mildly in favor of further deregulation. A Powell Fed would represent continuity with the Yellen Fed’s direction in monetary policy. The markets would view a Powell nomination as an equity bullish outcome.
Regardless of what happens, it is important to look behind the headlines of a Fed chair nomination. The Fed in 2018 is likely to be more hawkish than the Fed in 2017. As I pointed out last week (see Is 3% for 6 months enough to take equity risk?), not only is the Fed chair unknown, there are three vacant seats on the Fed’s Board of Governors out of a total seven seats. Virtually all Fed governor candidates favor rules-based approaches to monetary policy, which would put the Fed a more hawkish path than it is today. As well, the rotation of votes among regional Fed presidents indicate a more hawkish shift, from Evans and Kashkari to Meester and Williams. If you think that there is a gulf between the Fed’s dot plot and market expectations of monetary policy today, wait until the full composition of the FOMC is known.

If the Fed turns significantly more hawkish, that’s when investors should batten down the hatches. That will be the signal of an inflection point for the economy and the markets.
Nowcast vs. forecast
For investors, navigating a potential turning point like this is problematical. The nowcast of the economy, such as consumer confidence and retail sales, are bright, but leading indicators are deteriorating. I agree with New Deal democrat’s latest weekly assessment of economic conditions:
After several months of boring sameness, the weekly indicators are beginning to show a change in trend. The short leading indicators are literally ALL positive. Coincident indicators except for LIBOR are also all positive. The present and near future economy looks stronger than at any time I can recall during this entire expansion (although job growth is decelerating and wage growth is still paltry).
But enough of the long leading indicators (including monthly and quarterly ones) have deteriorated to neutral or even negative for me to downgrade the longer term outlook to neutral. The change in real M2 may prove ephemeral, as the oil-fired surge in inflation abates, But on the other hand, even nominally, M2 has been decelerating. As usual, I will remain entirely data driven.
As one example of upbeat nowcast condition, the most recent update of Q3 earnings season is positive. Even though 6% of index components have reported, John Butters at Factset pointed out that both the earnings and sales beat rates are well above historical averages, and forward 12-month EPS continues to rise.
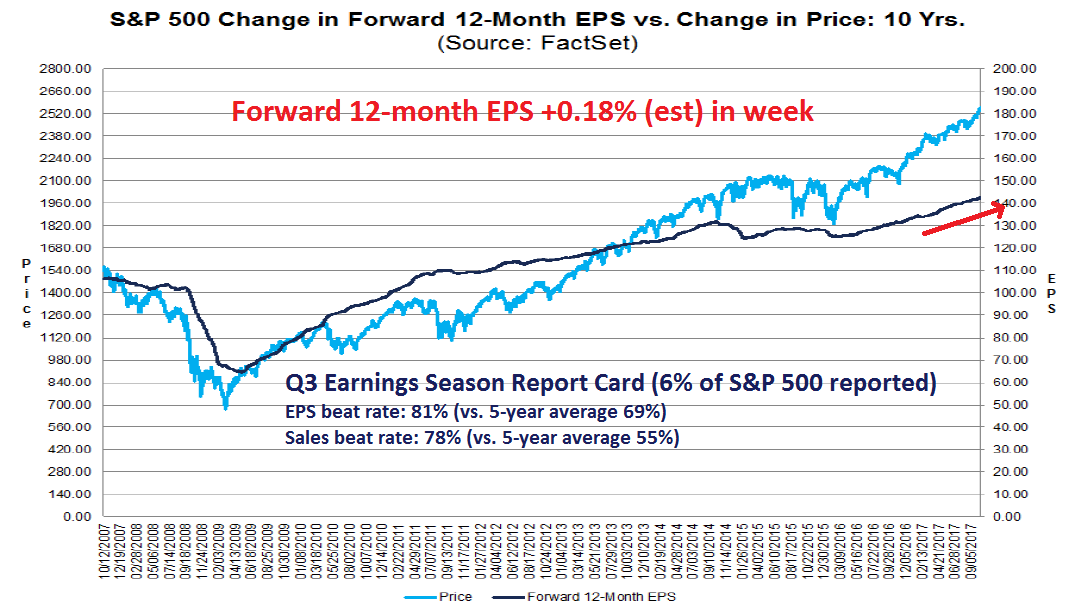
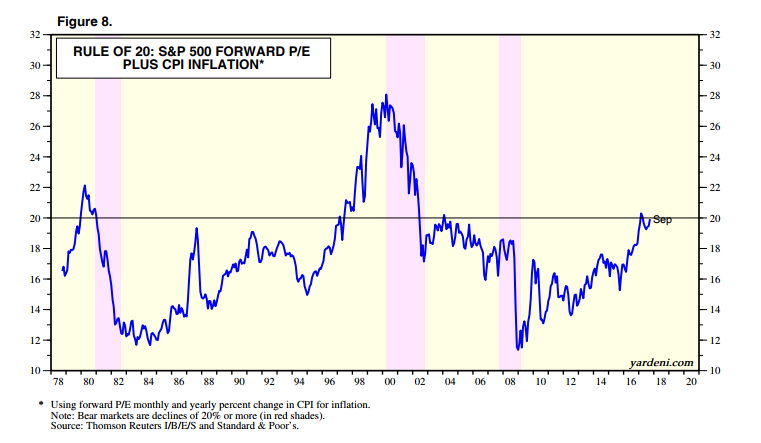
That said, Butters also stated that “the market is not rewarding earnings beats”, which is a warning flag of investor psychology. In addition, the forward P/E is now 18.0. Combined with a headline CPI of 2.2%, the sum of the two violates Ed Yardeni’s “Rule of 20“, which states that the market is at risk of stalling when the sum of the two exceeds 20.
Possible melt-up and crash
CNBC recently reported that Ed Yardeni put the probability of a market melt-up, followed by a market crash at 55%. Such a scenario is well within the realm of possibility.
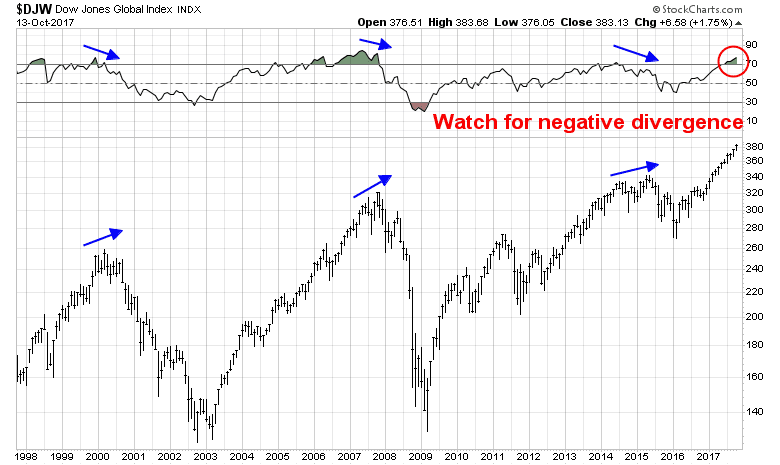
Here is what I am watching from both an intermediate term and shorter term basis. The US equity market has been buoyed by evidence of synchronized global growth, and it will be difficult for stocks to decline without signs of deterioration around the world. Past global equity tops have seen negative RSI divergences, which has not occurred.
If global stock markets were to make a cyclical top, the most likely scenario would see a correction, followed by a rally to test the old high or make a marginal new high which is unconfirmed by RSI. That pattern was evident even during the Tech Bubble melt-up. Current conditions show that while the index is overbought on RSI, we have not seen the first correction yet. So it’s far too early to panic.
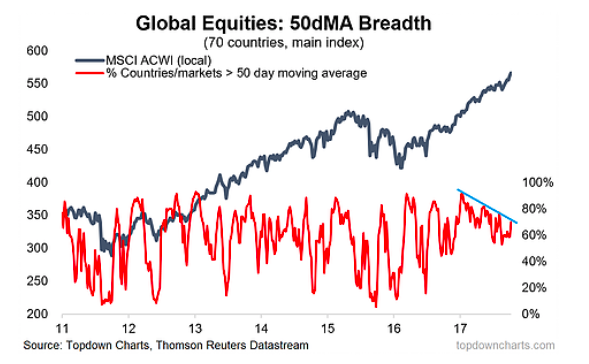
At the same time, Callum Thomas of Topdown Charts observed that global market breadth is deteriorating. Keep in mind, however, that breadth deterioration is an inexact sign of a market top. It can take months for breadth to top out before the broader averages actually does.
In the shorter term, I pointed out that the combination of the SPX trading above its weekly upper Bollinger Band and overbought on RSI-14 made it vulnerable to a pullback (see Peak small cap tax cut euphoria?). Such corrections have been relatively mild, in the order of 2-5%. While the market remains overbought, and we have not seen the sell signal yet when the weekly RSI falls below 70. To be sure, the RSI indicator cannot stay elevated forever and a retreat can occur at any time.

Should the market continue to grind upwards and stay overbought, the melt-up and crash scenario comes into play. The sentiment backdrop for a major top is already in place. As a reminder, I have detailed extensively in the past how sentiment is getting overly froth with my series “Things you don’t see at market bottoms”.
- Things you don’t see at market bottoms, 23-Jun-2017
- Things you don’t see at market bottoms, 29-Jun-2017
- Things you don’t see at market bottoms, bullish bandwagon edition
- Things you don’t see at market bottoms, Retailphoria edition
- Things you don’t see at market bottoms, Wild claims edition
- Things you don’t see at market bottoms, No fear edition
- Things you don’t see at market bottoms, Paris Hilton edition
- Things you don’t see at market bottoms, CFD leverage edition
My inner investor remains constructive on equities. Even though the trading model is flashing a buy signal, my inner trader is stepping aside as he does not believe the risk-reward is in his favor. He is waiting for market weakness to buy the dip.
We are at a wonderful ball, where the champagne sparkles in every glass and soft laughter falls upon the summer air. We know at some moment the black horsemen will come shattering through the terrace doors, wreaking vengeance and scattering the survivors. Those who leave early are saved, but the ball is so splendid no one wants to leave while there is still time, so everyone keeps asking, ‘What time is it?’ But none of the clocks have hands.
—The Money Game by Adam Smith