Preface: Explaining our market timing models
We maintain several market timing models, each with differing time horizons. The “Ultimate Market Timing Model” is a long-term market timing model based on the research outlined in our post, Building the ultimate market timing model. This model tends to generate only a handful of signals each decade.
The Trend Model is an asset allocation model which applies trend following principles based on the inputs of global stock and commodity price. This model has a shorter time horizon and tends to turn over about 4-6 times a year. In essence, it seeks to answer the question, “Is the trend in the global economy expansion (bullish) or contraction (bearish)?”
My inner trader uses the trading component of the Trend Model to look for changes in the direction of the main Trend Model signal. A bullish Trend Model signal that gets less bullish is a trading “sell” signal. Conversely, a bearish Trend Model signal that gets less bearish is a trading “buy” signal. The history of actual out-of-sample (not backtested) signals of the trading model are shown by the arrows in the chart below. Past trading of the trading model has shown turnover rates of about 200% per month.

The latest signals of each model are as follows:
- Ultimate market timing model: Buy equities
- Trend Model signal: Bullish
- Trading model: Bullish
Update schedule: I generally update model readings on my site on weekends and tweet mid-week observations at @humblestudent. Subscribers will also receive email notices of any changes in my trading portfolio.
A lukewarm buy signal
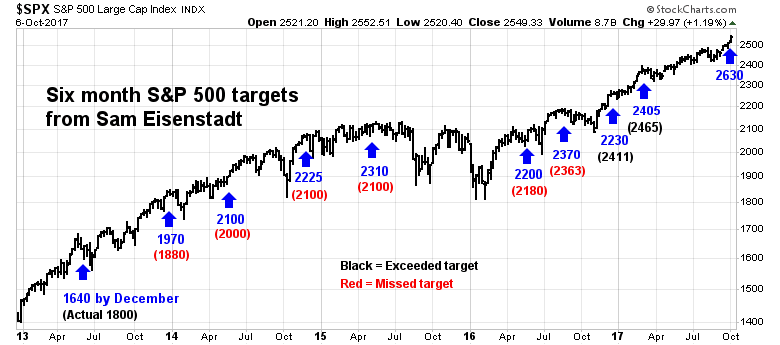
Mark Hulbert recently updated the market forecast of former Value Line research director Sam Eisenstadt. Eisenstadt has had a remarkable record of forecasting equity returns, according to Hulbert.
The reason to take this projection seriously is Eisenstadt’s track record. Consider a statistic known as the r-squared, which measures the degree to which one data series predicts or explains another. If the first series perfectly predicted the second, the r-squared would be 1.0; if the first series had absolutely no predictive ability the r-squared would be zero.
For the data plotted in the chart below, the r-squared is 0.31, which is significant at the 95% confidence level that statisticians often use when determining if a pattern is genuine. Though you might be disappointed that this r-squared isn’t higher, you should know that most of the models that get attention on Wall Street and in the financial press have r-squareds that are far lower—if they’re not actually zero.

Eisenstadt`s latest six month SPX forecast is 2620 to 2640, which represents a gain of about 3%. The chart shows Eisenstadt`s forecasts, as documented by Hulbert, since 2013. The forecast levels are shown in blue, with the actual below (black if the market beat his target, red if it missed).
Hulbert wrote that Eisenstadt has two critical inputs to his forecast, both of which are mildly bullish:
Eisenstadt constructs his model to include all factors he has found to have an ability to project the stock market’s subsequent six-month return. Though his model is proprietary, Eisenstadt has told me that two of the more important inputs are low interest-rates and market momentum. Both factors are mildly positive right now.
No forecast is complete without some understanding of the risks to the forecast. When I peek under the hood of the Eisenstadt’s model, interest rates and momentum represent sources of both risk and opportunity to the market. Investors will have to judge for themselves whether a potential 6-month gain of 3% is worth the risk.
Can interest rates support stock prices?
Warren Buffett recently stated that equities remain attractive, but interest rates represent the most important factor in determining valuation.
“The most important thing is future interest rates,” Buffett said. “And people frequently plug in the current interest rate saying that’s the best they can do. After all, it does reflect the market’s judgment. And the 30-year bond should tell you what people are willing to put out money for 30 years and have no risk of dollar gain or dollar loss at the end of the 30-year period. But what better figure can you come up with? I’m not sure I can come up with a better figure. But that doesn’t mean I want to use the current figure, either.”
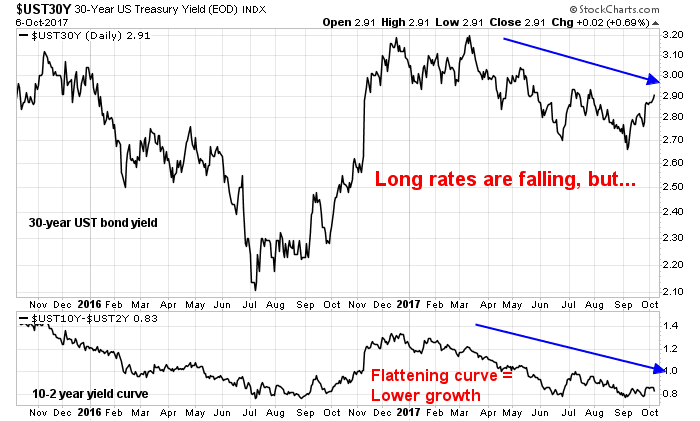
The current rate environment is a good news and bad news story. Long rates are falling, which is supportive of equity valuations. On the other hand, the yield curve is flattening, which is a signal that the bond market expects slower growth.
The key question for equity valuations then becomes a question of how interest rates will change in the future. Current market expectations for Fed Funds envisages a Federal Reserve that is considerably more dovish that the September dot plot.

There has been much speculation about the identity of the next Fed chair, and whether the new chair will be dovish or hawkish. While the news of who gets nominated will get the headlines, the more important dynamic is the composition of the FOMC next year. The rotation of voting regional Fed presidents is going to see the replacement of doves (Kashkari and Evans) with hawks (Williams and Meester). Moreover, there are three vacancies (not counting Janet Yellen if she doesn’t get re-appointed) at the Federal Reserve Board of Governors out of a total of seven seats. Randal Quarles, who was just confirmed by the Senate as vice chair for bank regulation, is known to have hawkish views. Virtually all rumored potential nominees are known to be rules-based Republicans with views who are more hawkish than the current board.
The current Fed’s expectations calls for a December rate hike, with three more quarter point hikes next year. Notwithstanding the views of any new Fed chair, a more hawkish Fed could see four or more hikes in 2018, and it is difficult to see how the 2018 FOMC could become more dovish than the 2017 FOMC. That translates to a negative rate surprise in either late 2017 or early 2018.
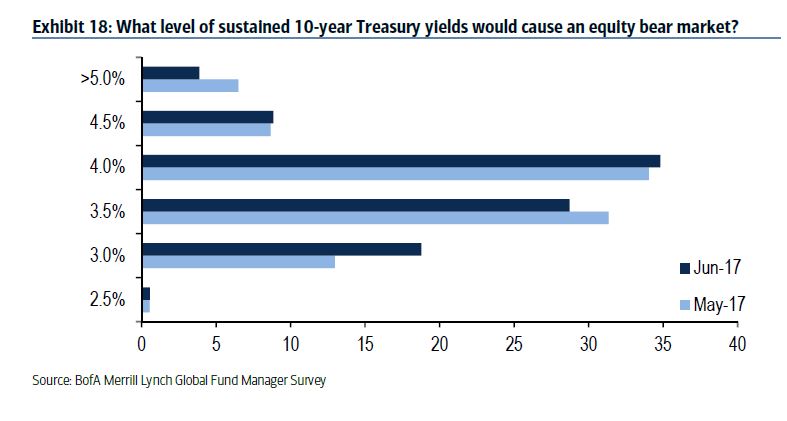
That said, the equity market still has a safety cushion. The June 2017 BAML Fund Manager Survey (last time the question was asked) indicated that institutional equity investors are unlikely to panic unless 10-year yields rises to 3.5-4.0%, which is slightly over 1% from current levels.
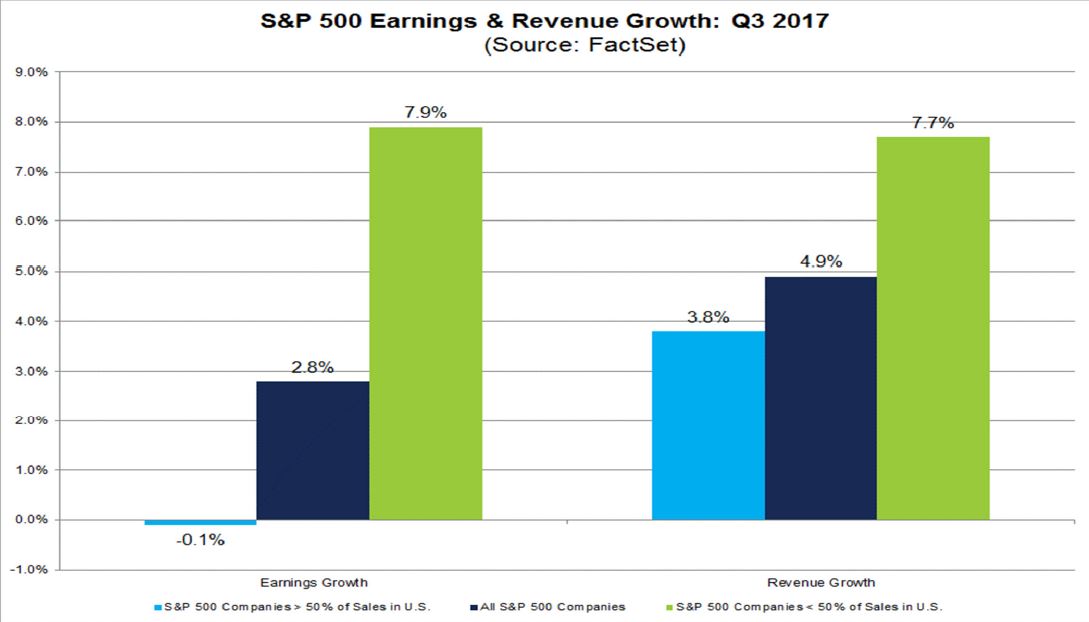
However, the more hawkish tone from the Fed has strengthened the USD, which is likely to pose a headwind to the earnings of large caps with foreign operations.

John Butters at Factset pointed out that companies with greater foreign operations are seeing much better earnings and sales growth than ones with a domestic focus.
For now, all of these concerns are 3-6 months in the future. The current environment is dominated by positive momentum, which is causing a surge in stock prices.
Strong momentum
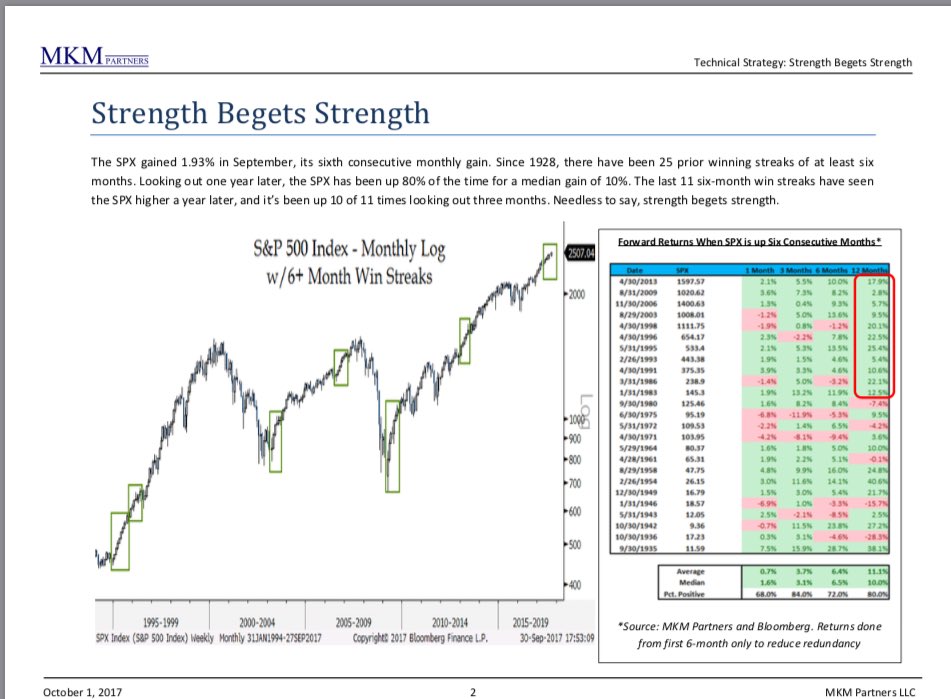
There is no doubt that both the stock market and the US economy is enjoying strong positive momentum. Virtually all of the major market averages have seen new all-time highs last week. As Jonathan Krinsky pointed out, strength begets more strength.
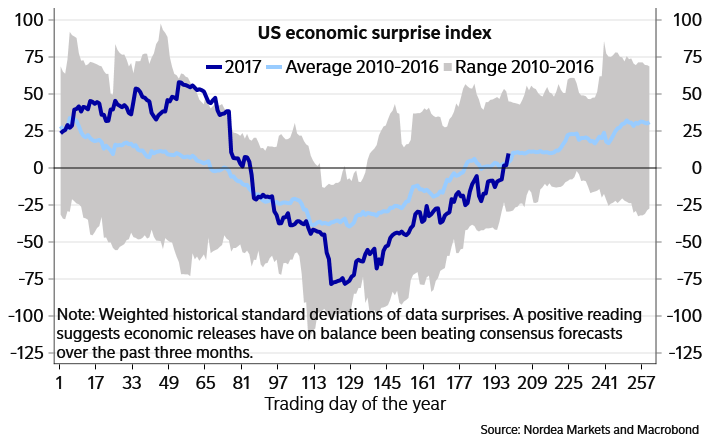
As well, top-down macro indicators have been stronger than expected. The Citigroup Economic Surprise Index, which measures whether economic releases are beating or missing expectations, have regained the zero line and it is entering a period of positive seasonality.
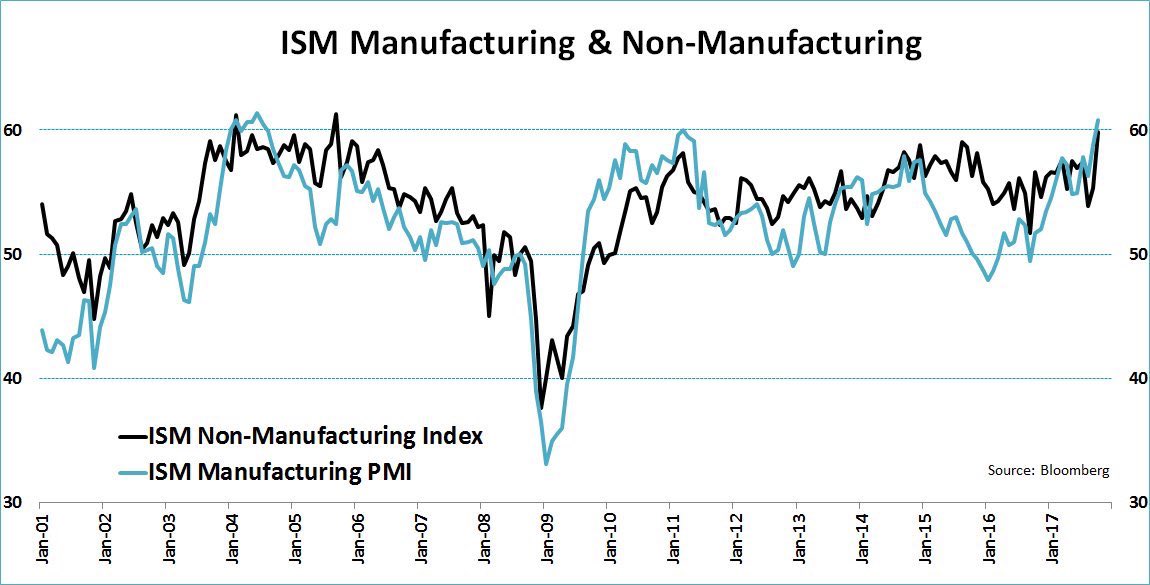
Examples of positive surprises included continued strength in both ISM Manufacturing and Services.
As well, the latest update of earnings expectations from Factset shows that forward 12-month EPS continue to grind upwards, indicating positive fundamental momentum from Wall Street.

Too far too fast?
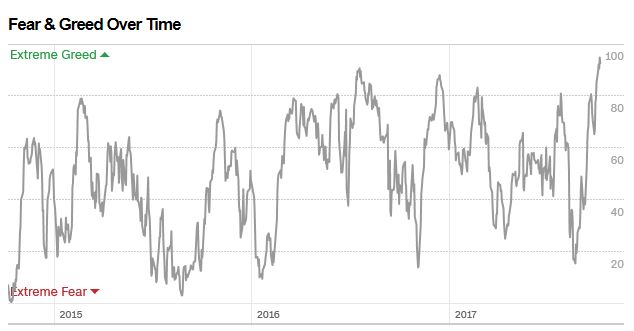
Despite the onslaught of positive price, macro, and fundamental momentum, the recent risk-on stampede calls into question of how much has been discounted by the market. The Fear and Greed Index is now at a nosebleed 92, which represents a minor retreat from last Thursday’s close of 95. How much more upside is there?
Kevin Muir, writing at The Macro Tourist, believes that sentiment has turned so much that the pain trade is now down. (Incidentally, I was bullish six months ago.)
Think back six months. Do you remember all the warnings from the legendary hedge fund managers about the impending stock market doom? Paul Tudor Jones, Scott Minerd, Larry Fink, Seth Klarman, the list is long but distinguished. At the time I penned It’s too easy to write bearish pieces. Even in late summer, gurus like Gundlach were bragging about the 400% he would make on his S&P 500 put purchases – Billionaire Bears. Given the atmosphere, I knew posts about the coming collapse would be greeted with tons of words of encouragement. Yet if I wrote something about the stock market continuing higher, crickets… Or worse yet, remarks about my cluelessness regarding the problems in the global financial system. I didn’t think stocks were going higher because everything was roses, no in fact just the opposite. Stocks were being pushed higher because everything was so FUBAR’d. Central Bank balance sheet expansion was pushing risk assets higher, and for the longest time, everyone wanted to fade it.
Fast forward to today. Even the most ardent bears have given up and embraced the idea Central Bank buying will push stocks higher. Investors that were previously doom and gloomers are now speaking of blow off-tops. I can hear the capitulation in their voices. No more brave predictions of the coming collapse. Instead, meeker forecasts of a high volume runaway euphoria. There are no bears left. None. Not a soul.
The bears have been replaced by gloating bulls that are openly bragging about how high the S&P 500 futures will gap up Sunday night. They are mocking the bears with taunts of how much money will they lose fighting the rally. They joke about buying the dip, which increasingly is becoming more and more nothing more than a couple of downticks.
I might not know much, but I know the Market Gods do not take kindly to that sort of behaviour. What was that quote from Bernard Baruch? “The main purpose of the stock market is to make fools of as many men as possible.”
Muir points to contrarian indicators such as the latest cover of The Economist as a bearish indicator.
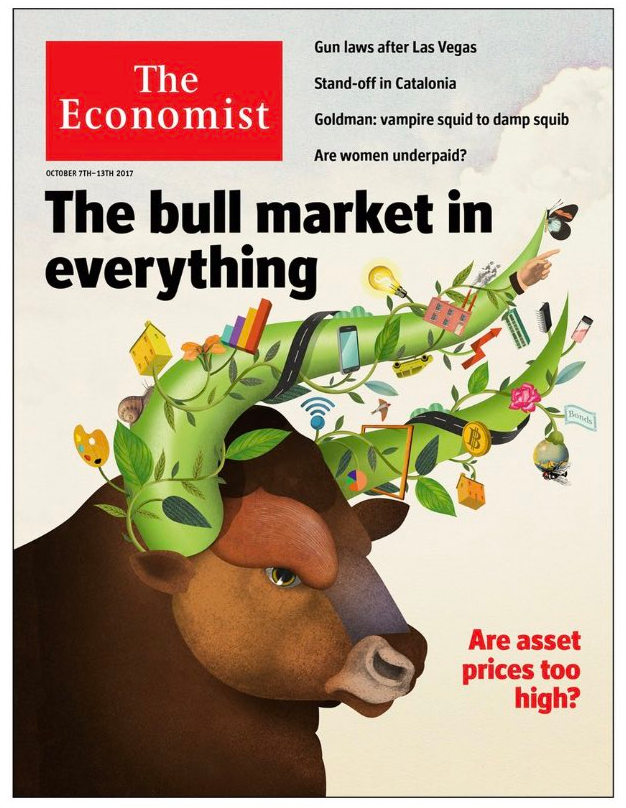
Remember the last time this happened?
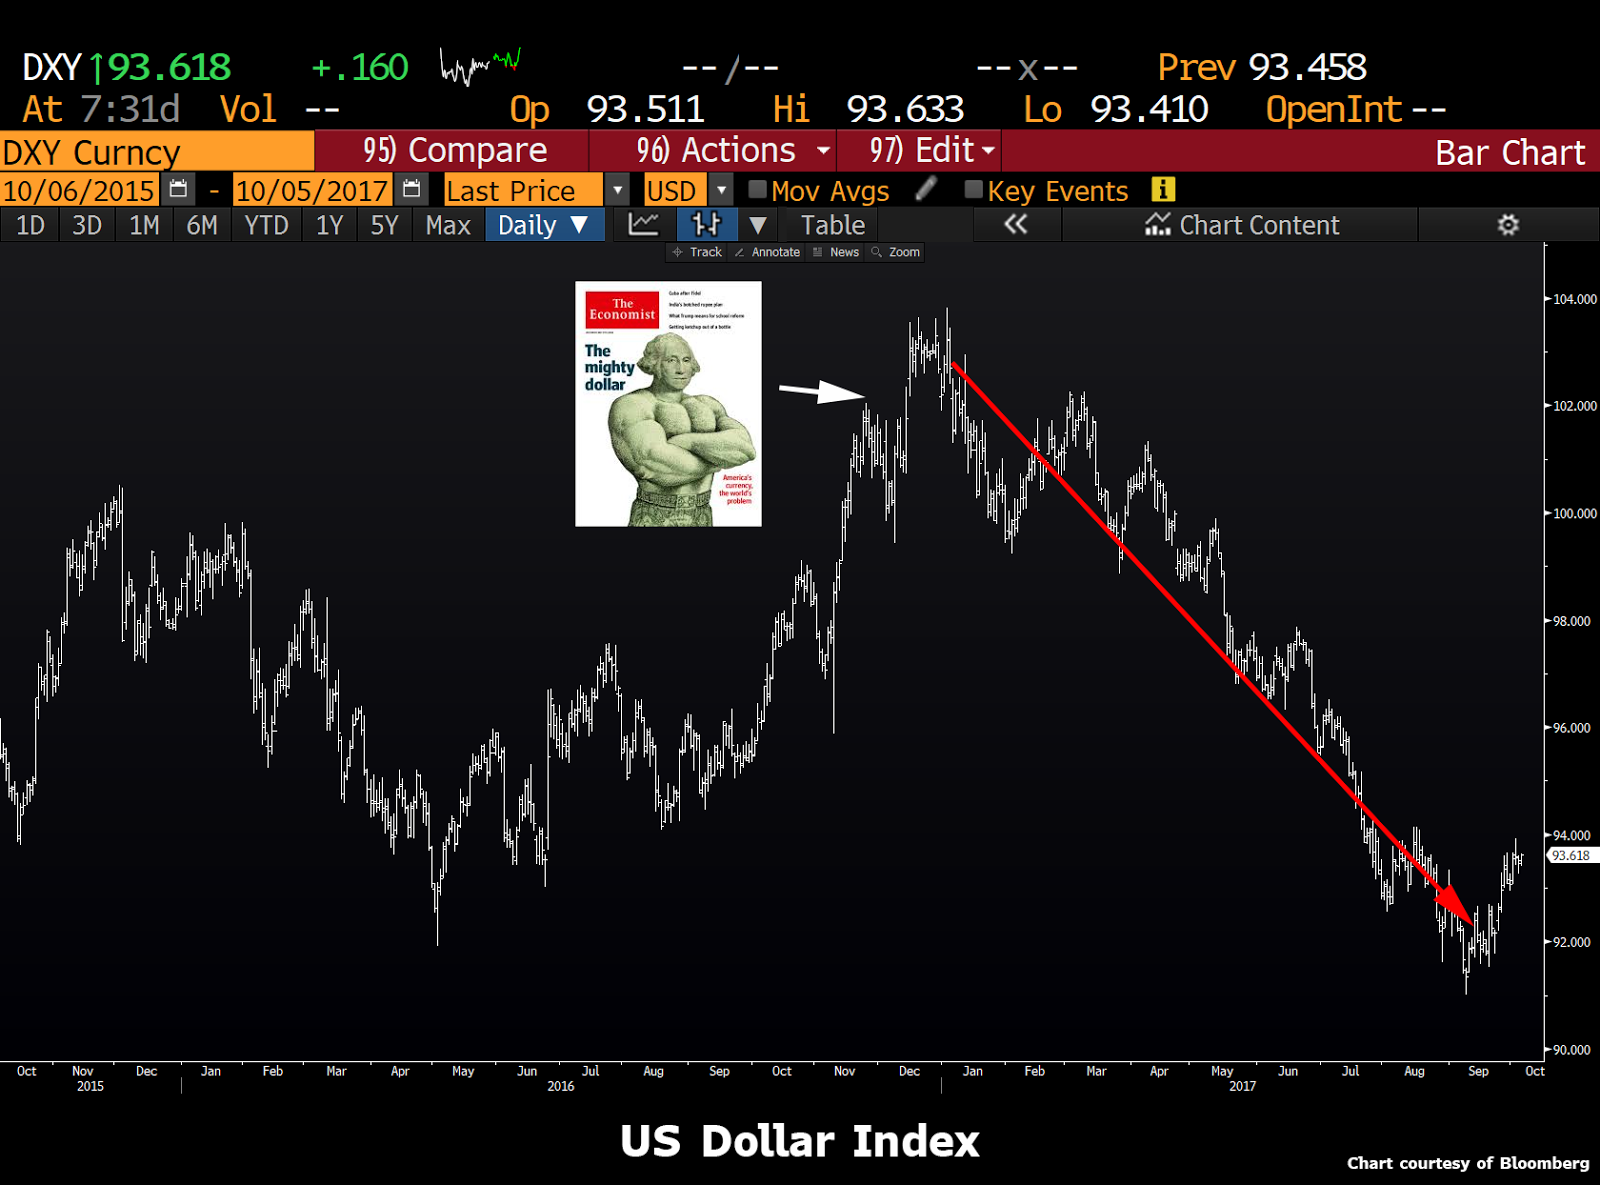
To be sure, a past study cited by the Buttonwood blog at The Economist found that Economist cover indicators work well as a contrarian indicator at a one year horizon, but have little or no utility in the short run.
Interestingly, their analysis finds that after 180 days only about 53.3% of Economist covers are contrarian; little better than tossing a coin. After 360 days, the signal is a lot more reliable—68.2% are contrarian. Buying the asset if the cover is very bearish results in an 18% return over the following year; shorting the asset when the cover is bullish generates a return of 7.5%.
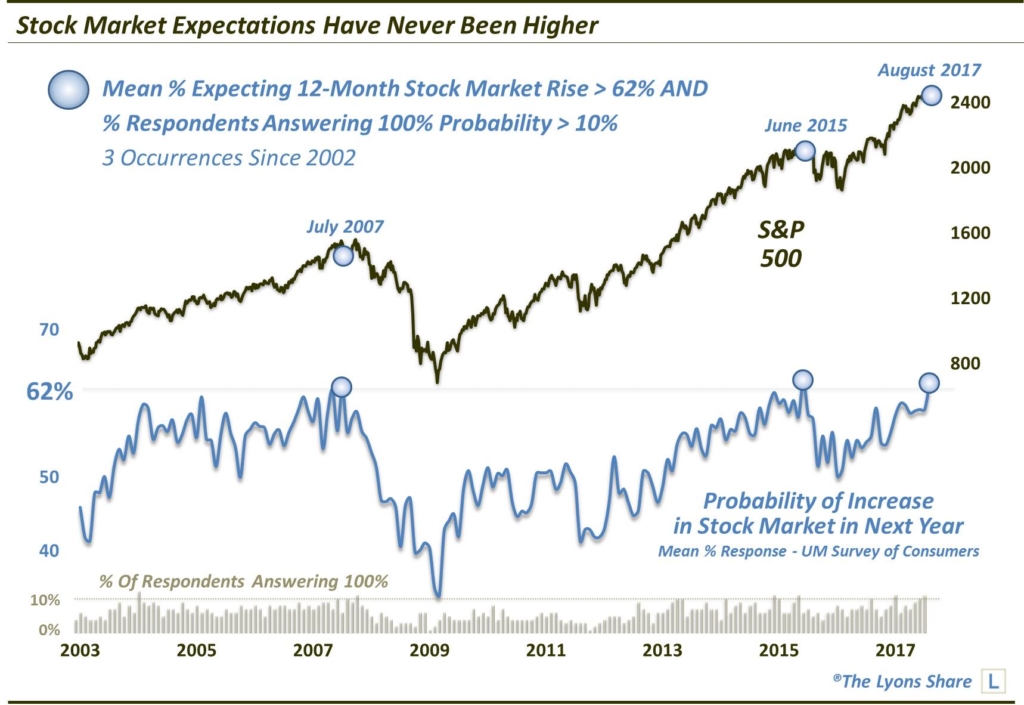
Dana Lyons also pointed out that the University of Michigan Survey indicated a historically high level of bullishness. Such episodes have not ended well in the past.
The slow stochastic of the NYSE Common stock Summation Index is now overbought. In the past, the market advance has tended to stall when readings reached these levels.

For short-term traders, Tom McClellan warned that the lack of market volatility, as measured by the McClellan Oscillator, could be indicative of near-term market weakness.
Party now, pay later?
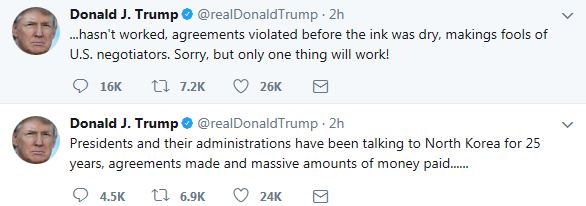
The combination of positive momentum, overbought conditions, and excessive bullishness suggests a market that is likely to either consolidate or pull back from current levels. In light of the powerful momentum backdrop, dips should be bought, barring some unexpected exogenous event, such as the one alluded to by Donald Trump’s “calm before the storm” remark. That remark was followed by potentially ominous tweets about North Korea.
My base case scenario calls for a brief period of consolidation or correction, followed by a rally into year-end. Stock prices could conceivably temporarily overshoot Eisenstadt 2620-2640 target before stalling and pulling back to the low 2600 area.
My inner investor remains constructive on stocks. He has taken some profits and rebalanced his portfolio back to investment policy target weights. My inner trader covered all shorts last week. He is waiting for a dip to buy back in. Despite the trading system’s “buy signal”, the market is too extended to get too long right now.
The most important market happening will be the appointment of Fed Chairman and Governors soon. If a rules-based group gets appointed, expect a ramping up of interest rates and a strong possibility of a 1937-style mini-crash.
I would urge investors to each have a rules-based exit strategy.
Let me share a valuable lesson I’ve learned. After a bear market, investors look back and wish they had used stop loss or moving average selling strategies. They then use them for the next few years in the new bull market and it costs them a fortune in lost gains. They abandon the practice just about the time the market peaks and they go down in flames in the next bear.
The lesson is, use these strategies at the appropriate times. I’ve not used an objective exit strategy since the GFC. Now I have. Last week I put in a moving average (100 day weighted average) sell in for QQQ and FDN two of my biggest winners. We are still in and they might keep rising for six months but I will sell for my client portfolios and buy inverse ETFs with the proceeds (also inverses for the first time since the GFC).
It’s the season to protect our gains in the intermediate and longer term portions of our portfolios.
Cam
Thanks for the tap on the shoulder, warning of frothy market sentiment.
Ken, thanks for how not to use moving averages blindly, as an exit strategy. Battening the hatches seems like a good defensive position, through inverse funds or as Cam has done, raise cash on the books.
October has a bad reputation of being a dour month, but is also a “bear slayer” as the next quarter that follows is usually positive (and prior two months have worse reputation than October). That said, the rule is not always true.