How would you feel if the average doctor was right 55% of the time? What if a “superstar” doctor, the one whose new patient waiting list stretched out for 1-2 years, was right 60-70% of the time?
That’s how thing work in investing. A “good” quantitative factor, or system, is often acceptable if it has a 55% success rate. If you get a 65% success rate, you are a superstar. Some systems have success rates of less than 50%, but the average value of their wins dwarf the average value of their losses.
Finance quants are often said to suffer science envy. They employ scientific techniques to find alpha, but they do it in an environment where the signal-to-noise ratio is very low. Let`s not kid ourselves, we know what day traders, swing traders and system traders really do.

By contrast, the signal-to-noise in the sciences tend to be higher. Viewed in isolation, that can be a cautionary tale for all quant researchers and systems traders who think that they may have found their path to riches.
The trouble with science
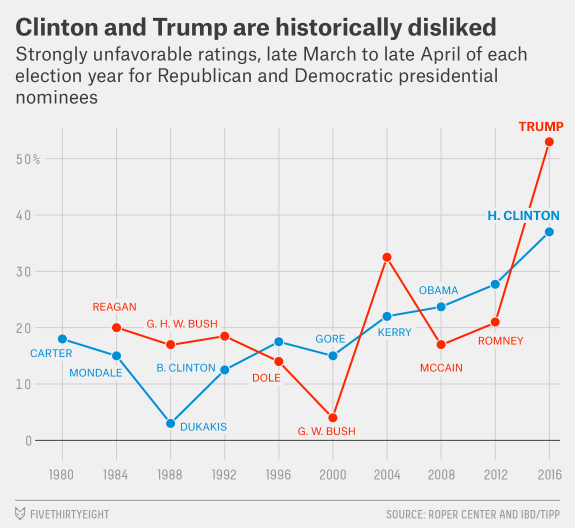
The signal-to-noise ratio in the sciences may not be as high as idealized. A recent article in FiveThirtyEight shows that science has serious problems of its own:
If you follow the headlines, your confidence in science may have taken a hit lately. Peer review? More like self-review. An investigation in November uncovered a scam in which researchers were rubber-stamping their own work, circumventing peer review at five high-profile publishers. Scientific journals? Not exactly a badge of legitimacy, given that the International Journal of Advanced Computer Technology recently accepted for publication a paper titled “Get Me Off Your Fucking Mailing List,” whose text was nothing more than those seven words, repeated over and over for 10 pages. Two other journals allowed an engineer posing as Maggie Simpson and Edna Krabappel to publish a paper, “Fuzzy, Homogeneous Configurations.” Revolutionary findings? Possibly fabricated. In May, a couple of University of California, Berkeley, grad students discovered irregularities in Michael LaCour’s influential paper suggesting that an in-person conversation with a gay person could change how people felt about same-sex marriage. The journal Science retracted the paper shortly after, when LaCour’s co-author could find no record of the data.Taken together, headlines like these might suggest that science is a shady enterprise that spits out a bunch of dressed-up nonsense. But I’ve spent months investigating the problems hounding science, and I’ve learned that the headline-grabbing cases of misconduct and fraud are mere distractions. The state of our science is strong, but it’s plagued by a universal problem: Science is hard — really fucking hard.
In most cases, scientific researchers are not out to perpetrate fraud, but they have a bias towards positive results. Negative results doesn’t get you published. No one pats you on the back because you didn’t find the cure for cancer. No papers, or few papers, translates to no academic tenure.
Moreover, different perspectives and different approaches can yield different conclusions. Consider the following study where a researcher asked other research teams to study the question of whether soccer referee rulings are affected by a player`s skin color. Even though the different teams were all given the same data set, they reached a variety of conclusions:
Nosek’s team invited researchers to take part in a crowdsourcing data analysis project. The setup was simple. Participants were all given the same data set and prompt: Do soccer referees give more red cards to dark-skinned players than light-skinned ones? They were then asked to submit their analytical approach for feedback from other teams before diving into the analysis.
Twenty-nine teams with a total of 61 analysts took part. The researchers used a wide variety of methods, ranging — for those of you interested in the methodological gore — from simple linear regression techniques to complex multilevel regressions and Bayesian approaches. They also made different decisions about which secondary variables to use in their analyses.
Despite analyzing the same data, the researchers got a variety of results. Twenty teams concluded that soccer referees gave more red cards to dark-skinned players, and nine teams found no significant relationship between skin color and red cards.

What`s the signal-to-noise ratio in this study?
The variability in results wasn’t due to fraud or sloppy work. These were highly competent analysts who were motivated to find the truth, said Eric Luis Uhlmann, a psychologist at the Insead business school in Singapore and one of the project leaders. Even the most skilled researchers must make subjective choices that have a huge impact on the result they find.
But these disparate results don’t mean that studies can’t inch us toward truth. “On the one hand, our study shows that results are heavily reliant on analytic choices,” Uhlmann told me. “On the other hand, it also suggests there’s athere there. It’s hard to look at that data and say there’s no bias against dark-skinned players.” Similarly, most of the permutations you could test in the study of politics and the economy produced, at best, only weak effects, which suggests that if there’s a relationship between the number of Democrats or Republicans in office and the economy, it’s not a strong one.
The important lesson here is that a single analysis is not sufficient to find a definitive answer. Every result is a temporary truth, one that’s subject to change when someone else comes along to build, test and analyze anew.
Even the most earnest researcher have to make choices about the metrics of what determines success. The analytical choices that they make have direct effects on the conclusions of their study.
I don`t know
The problem is even more acute for finance researchers. Not only are they burdened with a high signal-to-noise ratio, their analytical biases will often lead them down the wrong path. That’s why models that perform well in backtests, or for short periods, suddenly blow up for no apparent reason.
While we all try our best, Charlie Biello wrote that the best three words that an investment analyst can say are “I don’t know”:
I
Don’t
Know
These three words, almost never uttered in this business, are far and away the most critical to long-term investment success.
Why?
Because the future and markets are unpredictable, and having the humility to admit that is very hard for us to do. We’re simply not wired that way and instead suffer from the behavioral bias of overconfidence. Which is to say we overestimate our own abilities when it comes to sports, trading, driving or anything else.
Which is the better indicator?
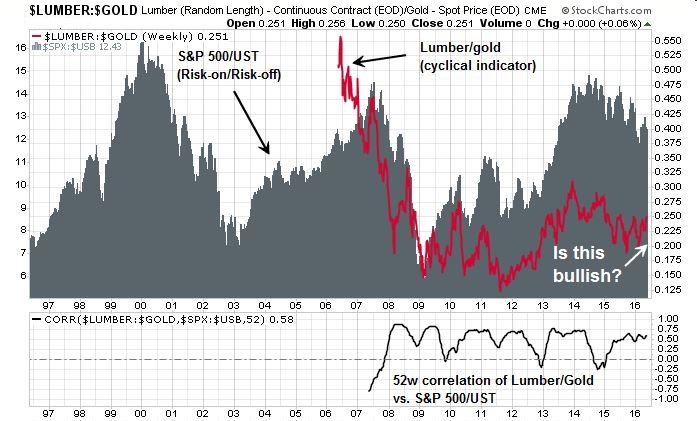
I am not here to pick on Biello, as I have the utmost respect for his work, but consider this example relating to the prize winning paper that he co-authored with Michael Gayed where they found a significant relationship between the lumber/gold ratio and stock prices:
The unique combination of Lumber and Gold is an intermarket relationship that has been anticipatory of future economic activity and risk appetite across asset classes outside of commodities. We find that when Lumber is leading Gold over the prior 13 weeks, expansionary conditions predominate and volatility tends to fall going forward. Such an environment is favorable to taking more risk in a portfolio or “playing offense.” We also find that when Gold is leading Lumber over the prior 13 weeks, contractionary conditions predominate and volatility tends to rise. In this environment, it pays to manage risk in a portfolio or “play defense.”
Here is a chart of the lumber/gold ratio (red line) against the stock/bond ratio (grey area bars) as a risk-on/risk-off measure. The bottom panel shows the rolling 52-week correlation between the two variables, which has been consistently high and positive over the last 10 years. As the lumber/gold ratio is starting to turn up, can we interpret this development as a bullish signal for stocks and risky assets?
Here is the same chart, using the copper/gold ratio. Both copper and lumber can be considered to be measures of economic cyclicality. The copper/gold ratio has a longer history and the rolling 52-week correlation is very similar to the one from the lumber/gold chart above.
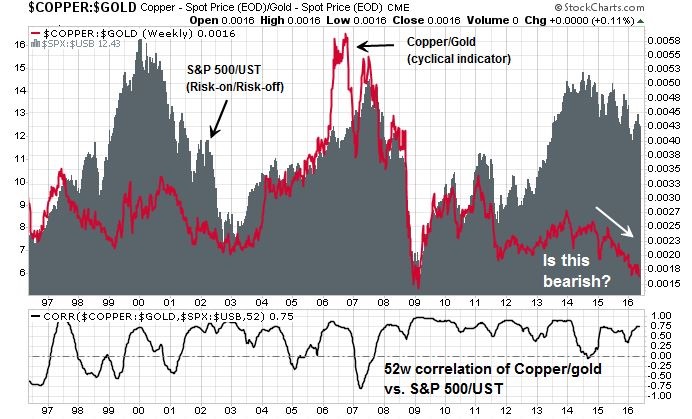
While the lumber/gold ratio has turned up and flashed a bullish signal, the copper/gold ratio continues to decline and can be interpreted bearishly. Which indicator is right? Which one should we believe?
I don’t know.
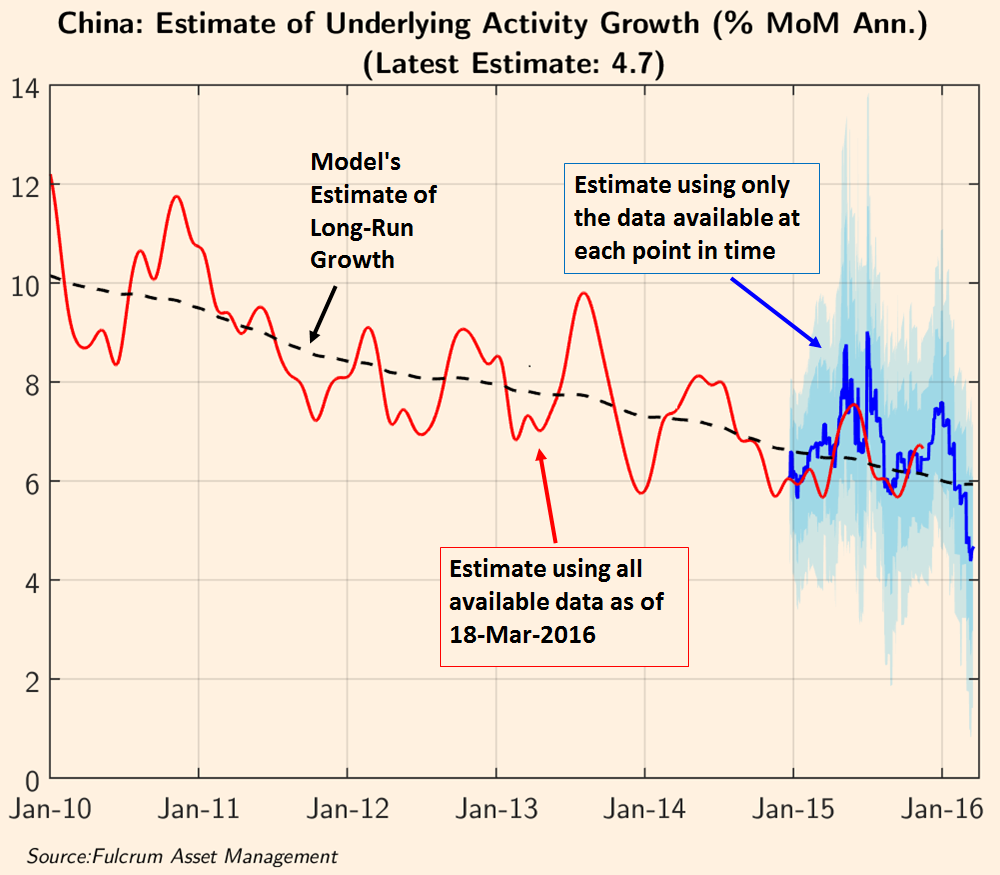
Another way to reconcile these two charts is to theorize that lumber prices are more affected by US housing demand, while copper prices are more global and currently more affected by Chinese demand. While lumber is signaling a US rebound, copper is signaling further deceleration in Chinese growth.
Is that interpretation correct? If we were to accept that premise, what is the most likely path for stock prices?
I’m not sure.
Think of this story a cautionary tale for all quantitative researchers and systems traders. Just when you think that you found the Holy Grail of investing or trading, you will be wrong in some way. Treat your results with skepticism. Diversify your models, as any single model or indicator will be wrong.
Be humble before the market gods, or they will make you humble in the end.