The last time I published a post in a series of “things you don’t see at market bottoms” based on US based investor enthusiasm was in June. Sufficient signs have emerged again for another edition.
As a reminder, it is said that while bottoms are events, but tops are processes. Translated, markets bottom out when panic sets in, and therefore they can be more easily identifiable. By contrast, market tops form when a series of conditions come together, but not necessarily all at the same time. My experience has shown that overly bullish sentiment should be viewed as a condition indicator, and not a market timing tool.
Past editions of this series include:
- Things you don’t see at market bottoms, 23-Jun-2017
- Things you don’t see at market bottoms, 29-Jun-2017
- Things you don’t see at market bottoms, bullish bandwagon edition
- Things you don’t see at market bottoms, Retailphoria edition
- Things you don’t see at market bottoms, Wild claims edition
- Things you don’t see at market bottoms, No fear edition
- Things you don’t see at market bottoms, Paris Hilton edition
- Things you don’t see at market bottoms, Halloween edition
- Things you don’t see at market bottoms, CFD edition
- Things you don’t see at market bottoms: Rational exuberance edition
- Things you don’t see at market bottoms: Retail stampede edition
- Things you don’t see at market bottoms: China edition
- Things you don’t see at market bottoms: Giddinesss revival edition
I reiterate my belief that excessively bullish sentiment may not signal the top of the equity market, but investors should be aware of the risks of an environment in which sentiment has become increasingly frothy.
Booming consumer confidence: Artisanal brooms edition
Chalk this story up to booming consumer confidence. Vox featured a story about artisanal brooms that cost up to $350 apiece.
I bought my plastic broom in the frenzied cleaning portion of my last apartment move. The amount of time and energy I expended trying to decide which broom to buy lasted the duration of my walk to the local Duane Reade, plus the short trip to the cash register. It cost maybe $10.
This is one corner of the American broom market: the unromantic, inexpensive corner many of us are familiar with. For the same price, you could also go to Home Depot and get a humble, conventional version made from broom corn, the straw-like plant also known as sorghum that yellows as it ages. But work your way up the pricing scale — and onto the websites of artists and individuals who make brooms by hand — and you’ll find gangly brooms made from found wood, pleasingly curved hand brooms made from ash and horsehair, thick palm brooms imported from Japan, and classic Shaker brooms with gleaming, octagonal walnut handles. If you want, you can spend $70 or $95 or even $350 on a broom.
The people who make and sell these kinds of brooms say they want to see them in use, and hope that the brooms’ craftsmanship and elevated design will inspire owners to leave them out as decoration when they’re not being used to sweep the floor. But because of its functional (and often gendered) nature, the broom is an everyday object that kicks up a lot of sticky questions when it collides with the artisanal movement.
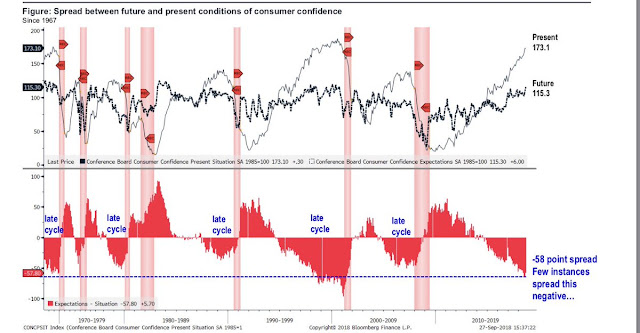
As I pointed out before, consumer confidence internals point to a late cycle extreme. The spread between future and current conditions are consistent with conditions found in a late cycle expansion.
Market frothiness
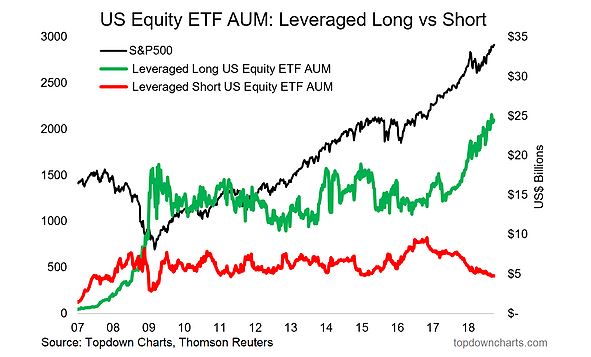
Meanwhile, over at the stock markets, we are seeing numerous signs of frothiness. Callum Thomas pointed out that the Assets Under Management (AUM) of leveraged long ETFs have spiked to all-time highs, while leverage short ETF AUM are falling.
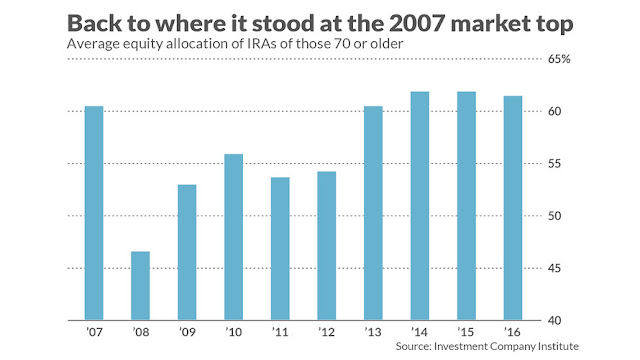
Mark Hulbert also observed that the equity allocation in the IRAs of investors over 70 are back to levels seen at the last market top.
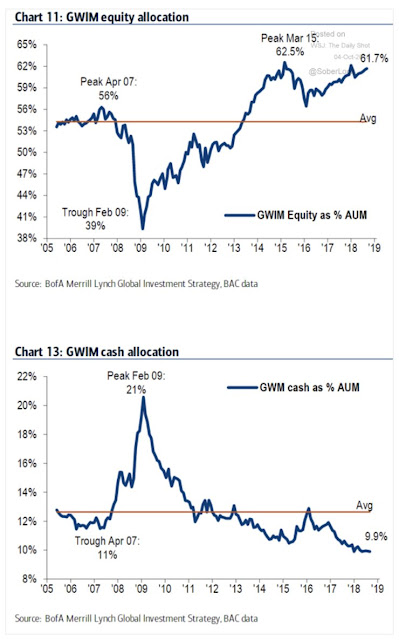
At the same time, BAML`s private client data shows cash at record lows and equity allocations near record highs.
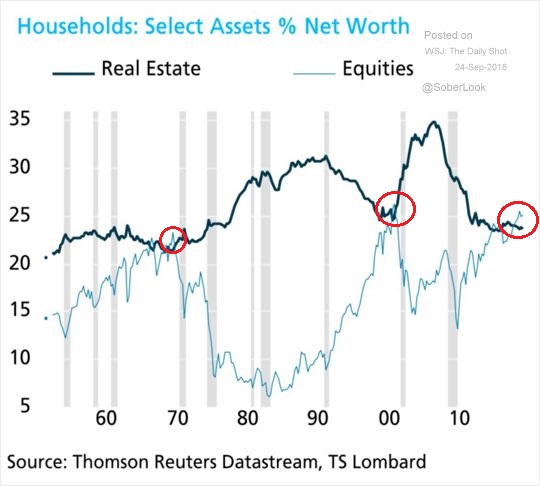
Moreover, the percentage of household net worth held in equities now exceed real estate. These conditions were only found at the NASDAQ bubble top, and at the market peak of the late 1960`s.
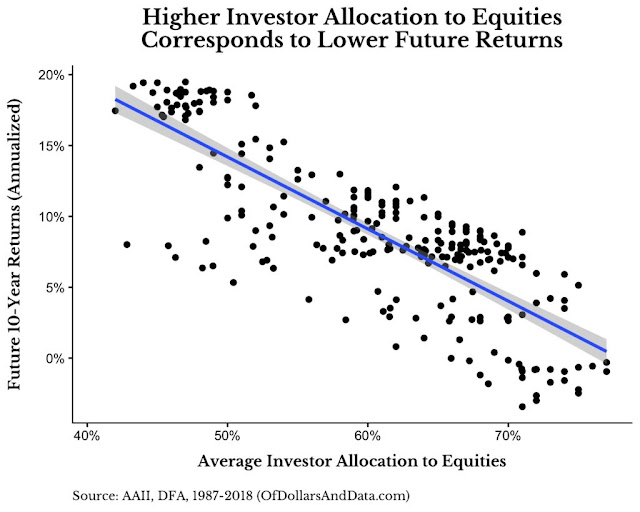
I would point out the somewhat inconvenient study from Nick Magguilli at Of Dollars And Data that there is an inverse relationship between average equity allocation and 10-year future returns.
On the other hand, those are 10-year returns, and we are only worried about tomorrow or the next month. So risk-on!
Deal silliness
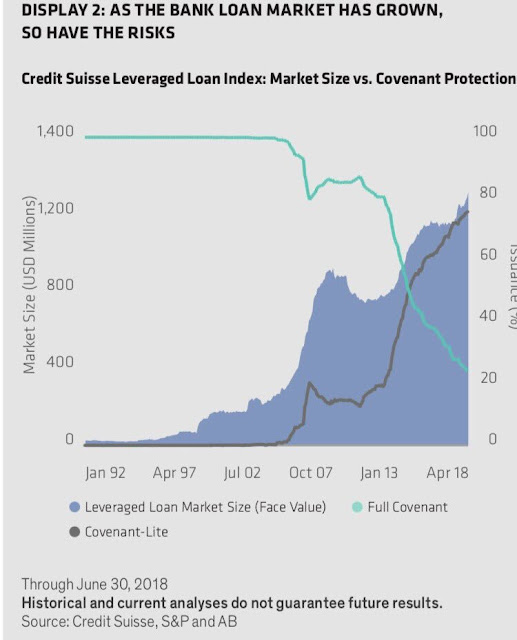
At the top of the market, investors often see silly deal getting done as greed becomes the dominant emotion and fear goes out the window. We can see that effect in the leveraged loan market, as the quantity of covenant-lite loans surge.
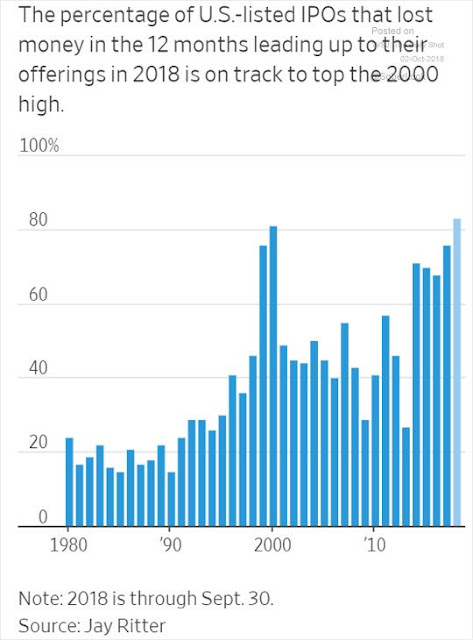
As well, the WSJ reported that the percentage of unprofitable IPOs now rival the figure last seen at the Tech Bubble top.
When I began the series, “things you don’t see at market bottoms”, cryptocurrencies and initial coin offerings (ICOs) were hot. Now that crypto prices have tanked, the mania has moved into cannabis. This tweet just about says it all.
Then there’s Turkey. Remember Turkey? This deal by the African Development Bank captures the market zeitgeist of today.
Excuse me, I have to run and swap my holdings of 100-year Argentina bonds (see The things you don`t see at market bottoms, 23-Jun-2017 edition) into zero-coupon TRY bonds…

One of your best!
Please contrast/comment with Scott Grannis’ last couple posts, which in my view, basically say “full steam ahead”, i.e., the economy is rocking. Thanks.
CNBC Markets In Turmoil special tonight. Time to buy the dip?
Cam, if I understand your bottom picking model correctly, you’ve hit an Exacta buy indicator? But the downward momentum is probably still too strong to have confidence in the set up?
Cam
GWIM equity allocation shows 61.7% current equity allocation.
The annualized rate of return by Dollars and Sense graph at 60% allocation is 8-9%. What is wrong/bad with 8-9% returns?
In February 09, the GWIM allocation was 39%. Using that metric, the graph from Dollars and Sense shows a roughly 15% return from 2009-2019, which sounds about right. This validates the Dollars and Sense graph.
The rest of the data you have provided is well understood.