Bloomberg’s U.S. chief economist Anna Wong published a chart outlining the impact of Trump’s tariff pivot. Trump raised tariffs on China and cut the “reciprocal tariff rate” to 10% for all others, except USMCA members Canada and Mexico, for 90 days. The resulting weighted tariff rate is not substantially different from the “Liberation Day” rates and it remains roughly comparable to the tariff rates of the Smoot-Hawley era. More worrisome is the higher tariff rate on consumer goods under the new regime, which spells stagflation, or higher prices combined with lower growth.
How will the trade war end? Let’s game theory this out.
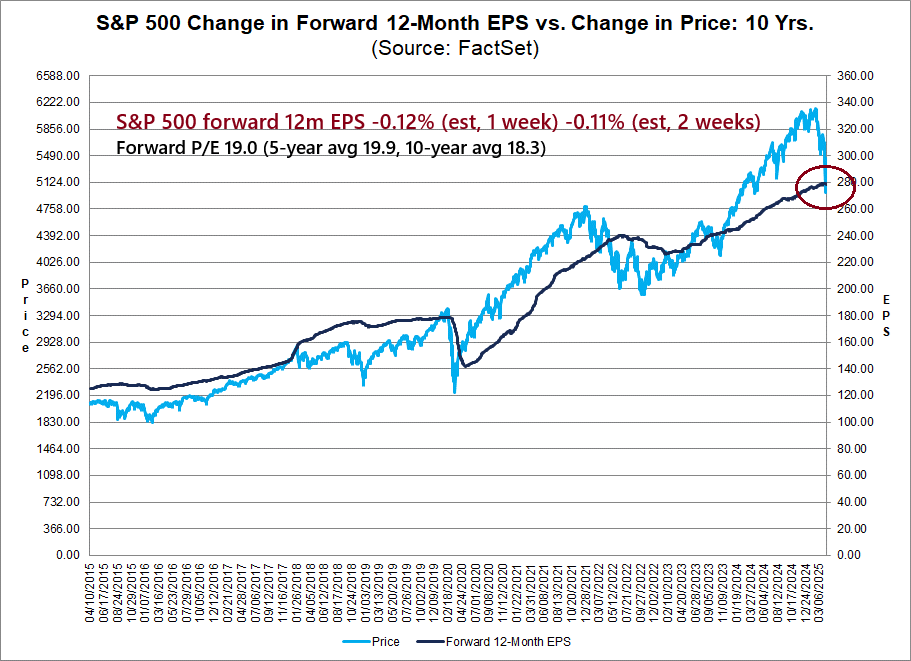
U.S.: The Rent Is Now Due
I start by outlining the positions of the different players while recognizing some of the rhetoric is posturing.
Let’s begin with the U.S. position in the trade war, as outlined by CEA Chairman Steve Miran in his
speech to the Hudson Institute. The speech represents one of the most concise and clearest articulations of the Trump Administration’s worldview, which is often confused by Trump’s rhetoric.
Miran believes the U.S. provides two “public goods” to the world, its security umbrella and the so-called “exorbitant privilege” of the USD as a global reserve currency, which are “costly to provide”. Not only does America have to strain its budget to provide security for the rest of the world, “the reserve function of the dollar has caused persistent currency distortions and contributed…to unsustainable trade deficits. These trade deficits have decimated our manufacturing sector”.
It’s time for other countries to pay up for these privileges: “If other nations want to benefit from the U.S. geopolitical and financial umbrella, then they need to pull their weight, and pay their fair share.”
Miran went on to suggest a five-point solution to burden sharing:
- First, other countries can accept tariffs on their exports to the United States without retaliation, providing revenue to the U.S. Treasury to finance public goods provision. Critically, retaliation will exacerbate rather than improve the distribution of burdens and make it even more difficult for us to finance global public goods.
- Second, they can stop unfair and harmful trading practices by opening their markets and buying more from America.
- Third, they can boost defense spending and procurement from the U.S., buying more U.S.-made goods, and taking strain off our service members and creating jobs here.
- Fourth, they can invest in and install factories in America. They won’t face tariffs if they make their goods in this country.
- Fifth, they could simply write checks to Treasury that help us finance global public goods.
In other words, living under the U.S. security and financial umbrella is like belonging to a club, like the Mar-a-Lago club. Miran wants to charge a membership fee to pay for maintaining the global order. The more a member country uses club’s facilities, the more it pays. Payments are made through tariffs, trade concessions, capital flows and directly in wire payments.
The rationale for this this approach is the reasoning behind the design of the “Liberation Day” tariff rates, which are based on each country’s trade balance with the U.S.
These ideas represent a radical change from the Pax Americana-based world order designed by different administrations in the wake of World War II. Reasonable people can debate on the cost and benefits of the U.S. security umbrella or the value derived from the status of the USD as a reserve currency. But the position of Trump officials is they’ve undercharged for the privilege, and the USD’s “exorbitant privilege” has become an exorbitant burden that’s put the U.S. economy at a competitive disadvantage and impoverished parts of the American population.
Miran’s remarks confirm the view of Singaporean defense minister Ng Eng Hen’s characterization of the U.S. changing “from liberator to great disruptor to a landlord seeking rent”.
The rent is now due.
America’s Weaknesses
Subsequent events have exposed the weaknesses and pain points of the U.S. strategy. Trump’s “Freedom Day” tariff announcement was met with widespread pushback from Wall Street and prominent Republican supporters.
Elon Musk, who is Trump’s biggest financial supporter, called Trump trade advisor Peter Navarro “truly a moron” and “dumber than a sack of bricks.”
Prominent pro-Trump hedge fund manager Bill Ackman warned, “we are heading for a self-induced, economic nuclear winter” and compared a full tariff activation plan as “economic nuclear war”. Ackman reversed course and praised Trump after the policy pivot.
The New Civil Liberties Alliance, which is an organization backed by Republican supporters Leonard Leo and the Koch network, launched a lawsuit claiming that Trump’s decision to invoke the International Emergency Economic Powers Act did not give him the power to “usurp” Congress’s right to control tariffs or “upset the Constitution’s separation of powers.”
The NFIB small business March survey, which was taken before the “Liberation Day” tariff announcement, is already showing signs of deterioration. The hard data component edged down while the soft expectational component is pulling back sharply.
Small business uncertainty is spiking, and undoubtedly it will rise further in the wake of the on-again-off-again tariff decisions. Numerous surveys such as the Dallas Fed’s Texas business conditions survey indicate that Trump’s erratic course on tariffs has paralyzed business capital investment and hiring planning.
U.S. bankruptcy filings have risen to a five-year high.
More importantly, Trump’s pivot based on bond market turmoil reveals to the other players his vulnerability. Foreigners hold almost $15 trillion of U.S. bonds, or about 30% of all outstanding issued.
While there were rumours attributing the recent bond market tantrum to China, an analysis of the price of the 10-year Treasury note in different currencies dispels that notion. If large entities were selling Treasuries and repatriating the funds, we would see weakness of the 10-year note in the affected currencies. The relative performance of the 10-year note shows pronounced weakness in all currencies except the Chinese yuan (bottom panel).
China: We’re Prepared
Trump’s pivot of raising the tariff rate for China and reducing it to 10% for all other countries is a clear signal that the intent of his policy is to isolate China. The 10% base rate is intended to address the issue of trade diversion of Chinese production through other countries, either by re-export or establishing production facilities in other places, like Vietnam.
In other words, the other major player in the trade war is China.
It is indicative of the upside-down world we now live in that one of the first responses by China to the “Liberation Day” announcement was to
post a Ronald Reagan speech on the futility of tariffs. Later, official state media, the People’s Daily, published an
editorial on Sunday, April 6, 2025, providing a major signal on China’s response strategy to the Trump “reciprocal tariffs”.
The gist of the response is “we’ve been preparing for a tariff war for years” [Translation from Google Translate].
The editorial acknowledged the damage from the new tariffs: “The excessive use of tariffs by the United States will have an impact on us, but ‘the sky cannot fall.’ The U.S. government’s 34% tariff on me, coupled with the tariffs imposed previously, will seriously curb bilateral trade, inevitably have a negative impact on our exports in the short term, and increase downward pressure on the economy.”
But China is resilient and less reliant on the U.S. as a buyer of its exports: “But we must see that China is a super-large economy, and we have a strong resilience to the impact of U.S. tariffs…[the] share of U.S. exports to the U.S. as a share of total exports has fallen from 19.2% in 2018 to 14.7% in 2024”.
The U.S. is highly dependent on Chinese exports and the tariffs will hurt the American growth outlook: “At present, the United States is not only inseparable from China in many consumer goods, many investment products and intermediate products also need to be imported from China, there are a number of categories dependent on more than 50%, it is difficult to find alternative sources in the international market in the short term.”
China can pivot to exporting to other countries: “The potential of economic and trade cooperation in emerging markets is huge, and it has increasingly become an important basis for me to stabilize foreign trade. China is the main trading partner of more than 150 countries and regions in the world, and since 2018, our share of exports to ASEAN has increased from 12.8% to 16.4%, and the proportion of exports to countries that have jointly built the Belt and Road has increased from 38.7% to 47.8%, and has maintained a rapid growth momentum.”
The Chinese economy is resilient: “Since the United States provoked the trade war with China in 2017, no matter how the United States fights and pressures, we have always maintained development and progress, showing the resilience of ‘the more pressure is stronger’, which has become the biggest strength of our response to external shocks.”
China has been preparing for this tariff shock for years: “We have been in the trade war with the United States for eight years and have accumulated rich experience in fighting…The Party Central Committee has predicted that the United States has implemented a new round of economic and trade suppression against me, and its possible impact is fully estimated, and the amount of advance and surplus of the plan is also well played.”
More importantly, Beijing refrained from firing its stimulus bazooka in the face of slowing Chinese growth, and it’s prepared to fire it now: “In the future, according to the needs of the situation, monetary policy tools such as standard reduction and interest rate reduction have left sufficient room for adjustment and can be introduced at any time; fiscal policy has clearly increased the intensity of expenditure, accelerated expenditure progress, fiscal deficit, special debt, etc. There is still room for further expansion as appropriate; it will boost domestic consumption with extraordinary efforts, accelerate the implementation of established policies, and timely introduction of a number of reserve policies; with real policies and measures to stabilize the capital market, stabilize market confidence, and relevant policies will be introduced.”
The editorial kept open the door to negotiations: “In the face of the ever-changing and extreme pressure of the United States, we have not closed the door to negotiations”.
The final words are a quote of Xi Jinping who said: “The Chinese economy is a vast sea, not a small pond.” This refers to the Chinese proverb “海纳百川, 有容乃大” which translates to “the sea accepts a hundred rivers, tolerance leads to greatness.”
The proverb has three meanings. The first is a message that the U.S. is shutting itself to the world. “We’re the sea, we can’t reject a river.” The second implies that China is a much greater and open entity than the U.S. The vast sea that can easily absorb the flow of the American “river” despite its tumultuous flow. The third is a veiled taunt about the inevitability of economic flows, like a river that must eventually join the sea despite any temporary diversions, American attempts to redirect trade and fight against natural economic forces are ultimately futile.
Let’s look at specific measures that China is undertaking.
China is pivoting toward Europe. The readout of a phone call between Premier Li Qiang and EU Commission President Ursula von der Leyen: “President von der Leyen highlighted the critical significance of stability and predictability in the global economy. In light of the considerable disruptions resulting from United States tariffs, she underlined the shared responsibility of Europe and China, as two of the world’s largest markets, to foster a robust and reformed trading system that is free, fair and based on a level playing field. She urged for a negotiated resolution to the current circumstances, stressing the necessity of avoiding further escalation…the Commission President further reiterated the urgency of implementing structural solutions to rebalance the bilateral trade relationship and enhance European businesses, products and services access to the Chinese market.”
Other media reported that China may cap production in sectors like electric vehicles and open its domestic market to strengthen ties with the EU. To address EU concerns over trade imbalances, China could increase imports from Europe and align technical standards. In response to fears of Chinese oversupply, China could impose EV production caps rather than direct export limits. These caps would protect both foreign markets and curb unhealthy domestic competition.
The latest round of tit-for-tat retaliation saw China raise tariffs on all U.S. goods from 84% to 125%.
Bloomberg reported that China won’t raise tariffs any further because it no longer makes economic sense and rates have become a “joke”. Beijing also abruptly halted all U.S. LNG shipments to China, which left cargoes stranded on the water. The sudden move has forced Chinese buyers to sell their contracts to other markets, like Eyrope.While China announced retaliatory tariffs on the U.S., it did not deploy the currency devaluation weapon. So far, the Chinese yuan hasn’t weakened and it’s holding its dirty peg against the USD. This has the dual purpose of keeping the door to negotiations open and minimize capital flight risk of a rapid yuan devaluation.
Evaluating the Relative Positions
Now that we have outlined the official positions of the U.S. and China, let’s review the game theory relative positions and those of other players.
The U.S. world view is that it is a dominant world power, both in geopolitics and trade. Individual countries ignore America at its own peril. The U.S. has subsidized the rest of the world with its security umbrella, and it’s time to pay up. As well, the rest of the world has used the USD as a reserve currency, which created imbalances in the form of a trade deficit for the U.S. and impoverished its middle class, and it’s time to pay up.
China believes it has emerged as a global economic power and trades with the rest of the world. While U.S. is an important customer, it’s not the only customer. China trades more with ASEAN countries than the U.S. China has close relations with 52 nations in Africa, China leads trade in the Middle East and the vast majority of developing countries around the globe. China will be hurt in a Sino-America trade war, but it can mitigate the damage by pivoting to trading with the rest of the world. In addition, it has fiscal and monetary bazookas ready to fire in order to cushion the blow from cooling economic growth.
Part of the resolution depends on how the rest of the world behaves. Trump’s transformation of America to “a landlord seeking rent” has alienated many of its allies and set off a global de-coupling trend. Europe’s rearmament initiative illustrates that point. European rearmament efforts are focused on procuring weapons from European sources, and allies are either cancelling or considering cancelling F-35 fighter orders in favour of European ones.
However, an analysis of the “pivot to trading with other countries” has a flaw. The U.S. runs a trade deficit because it is the consumer of last resort to the rest of the world. For that privilege, the U.S. pays in a currency for which it owns an exclusive printing press, which depresses U.S. interest rates and gives USD-based enterprises a capital cost competitive advantage. If other countries pivot to trading with each other, who will become the new consumer of last resort? Both Germany, which is the heart of the eurozone, and China are trade surplus countries. If China trades more with ASEAN countries and with the EU, which becomes the new trade deficit region?
I can only conclude from this analysis that all parties will be hurt and the global economy will shrink in a trade war.
Here’s another perspective from a game theory viewpoint of who is more prepared to withstand pain.
Trump governs a democratic society addicted to consumption with zero tolerance for inflation. The U.S. will experience immediate shortages and price increases and no capacity to re-route the lost imports into domestic production in the short term. It has no allies in an economic war with China.
Xi governs an autocratic dictatorship with no tolerance for dissent. He oversees a society that inherently believes in self sacrifice for the greater good of the country. He has some capacity to artificially prop up domestic consumption as a substitute for export demand. He learned from the latest American policy pivot Trump’s pain points, and the willingness of American allies to help the U.S. The latest combination of a tanking bond market and USD is an illustration of how pressure can be brought to bear on America.In conclusion, no country in the world will be spared damage a trade war. Both the U.S. and China have outlined positions that are little more than posturing. However, a game theory analysis of the relative positions indicates that the U.S. holds a weaker hand than China.