
The top panel of the chart shows that S&P 500 has handily beaten global markets since the GFC and it has retreated back to the rising trend line. Conventional technical analysis calls for investors to buy the dip, with a stop loss just below the trend line. I argue for the Sell America trade of minimizing exposure to USD assets in a broadly diversified portfolio.
Reasons to Should Sell America
I have numerous reasons to Sell America, largely owing to a regime change in market character.

One disturbing development is the rise in yields was mainly attributable to an increase in term premium, or the rate investors demand to hold longer maturity instruments. While the term premium isn’t excessively high, it does show an increasing discomfort that the Fed and the U.S. Treasury may be losing control of the long end of the yield curve.

In addition, there is growing unease over the U.S. fiscal position. The WSJ reported that JPMorgan Chase CEO Jamie Dimon recent warned about a “crack in the bond market”, and “And I tell this to my regulators…it’s going to happen, and you’re going to panic. I just don’t know if it’s going to be a crisis in six months or six years.”

The growing yield gap is attributable to a bifurcation in inflation expectations.

The difference in yields and inflation expectations can be attributable to U.S. tariff policy. The U.S. is a significant importer, while the Eurozone and other regions tend to be net exporters. Tariffs represent an inflationary shock to the U.S. and a deflationary shock to the rest of the world. This is starting to show up in the PMI data.

The bifurcation in inflation expectations explains why the Fed is on hold in its easing policy while the rest of the world are cutting interest rates.

In summary, the combination of deteriorating U.S. fiscal position and the trade war policy pivot is contributing to falling confidence in the USD and USD assets. A CFA Institute survey conducted 15–31 July 2024 found “that the dollar remains entrenched as the dominant reserve currency…[and] growing concerns among investment professionals about the long-term sustainability of US fiscal policy”.
Better Non-U.S. Equity Bargains
Now that we have established that USD assets are likely to come under some downward pressure, what about the stock market?

Non-U.S. markets present cheap valuations by historical standards. U.S. forward P/E ratios are off the charts in comparison to other markets.

There are reasons why some markets are cheap, but a simple comparison to the Eurozone shows better growth expectations across the Atlantic. The Economic Surprise Index, which measures whether economic data is beating or missing expectations, is rising in the Eurozone while falling in the U.S.

Turning to Asia, a comparison of the subcomponents U.S. and China PMIs shows that while both plunged initially, China recovered but U.S. PMI subcomponents continue to fall.

U.S. Technology Leadership
I began this publication by arguing it’s time to underweight U.S. assets and the S&P 500 in favour of non-U.S. equities, but one key risk to my investment thesis is the sustainability of U.S. technology leadership. U.S. equity dominance since the GFC was mainly attributable to technology leadership, first by the so-called FANG names, which later became the Magnificent Seven. A bet against U.S. stocks is a bet against the Magnificent Seven.

A Bloomberg podcast with JPMorgan Asset Management strategist Michael Cembalest which argues that AI is the stock market bet of the century may shed some light on the issue.

The experience of the internet bubble was instructive inasmuch as much of the value derived from widespread internet adoption accrued to the end-user. While equipment manufacturers and telecom distributors did earn some profits, eventual excess capacity cratered NASDAQ stocks. The NASDAQ 100, along with leading names like Cisco and Oracle took over a decade to regain their 2000 highs. Other crowd favourites such as AOL and Lucent were merged out of existence, and others, like Nokia, never regained their bubble highs.

Related to AI and the question of U.S. technology dominance is an investment opportunity highlighted by James van Geelen, who was early to spot the trend in weight-loss drugs and AI. Van Geelen believes that we are early in a 10-year growth opportunity in household robots, as reported by MarketWatch.
Discussing his “aha” moment on robots, van Geelen said he was speaking with an engineer friend who had been buying robot dogs from China, sticking a chip on the back and finding they could function like a guard dog. “He said ‘If you give me 15 grand, I will make you a fleet of robot dogs and guard your property right now.’”
And he started thinking about the 1960s sitcom “The Jetsons,” and his conclusion was that yes, technology will eventually mean a robot does our dishes and laundry. “It’s not like the consumer is going to be buying it. The consumer is probably going to be renting it,” which will spawn companies that provide those as a service, he said.Van Geelen offered a list of large cap companies that could be beneficiaries of the emerging robot trend, namely Tesla, Deere & Co., Nokia, Hyundai, and XPeng. I would note that over half the list are non-U.S. stocks.
A Rising Tide Lifts All Boats
In conclusion, in the absence of recessions, stock markets tend to rise. Technical analyst Willie Delwiche pointed out that the MSCI All-Country World Index (ACWI) finished May at a new all-time high. Over half the countries in the world reached new highs as well, which are constructive bullish signs.
I am embracing the “Sell America” trade because of a combination of deteriorating U.S. fiscal position and the trade war policy pivot that’s contributing to falling confidence in the USD and USD assets. A rising tide lifts all boats, but not all boats will rise equally.
The key risk to my “Sell America” thesis is whether the U.S. can sustain its technology dominance in the next investment cycle.
The S&P 500 nears a ceiling
Mid-week market update: The S&P 500 has been a little stronger than I expected as it tests upside resistance. I would urge traders to exercise caution as the market is exhibiting negative RSI divergences. Even though these kinds of divergences can persist for a while, they nevertheless indicate limited upside potential.
A valuation roof
Jurrien Timmer at Fidelity argue for a range-bound market. Stock prices are bounded by a Trump Put on the downside and a valuation roof on the upside. I agree.
Valuation is elevated from a forward P/E perspective.
There is a bifurcation between the soft survey data and the hard economic data, but that may be changing. Today’s large miss in ADP private employment may be an early hard data warning of softness in the labour market. Yesterday’s JOLTS report showed that job openings had risen, but the all-important quits to layoffs ratio had plunged. I interpret this as a loss of confidence in the jobs market. Workers are hesitant to quit as layoffs rise.
As well, the strength in continuing jobless claims is another sign that job seekers are encountering increasing difficulty finding new employment once they are jobless, which is another sign of a soft labour market. Be prepared for a miss in the May Nonfarm Payroll report due Friday.
Another source of concern from the soft data is the weakness in ISM non-manufacturing. Bank card surveys have shown that consumer spending has been resilient. While goods purchases may have been effort to front run tariffs, service spending is less tariff sensitive. The miss on the May ISM Non-manufacturing was therefore a surprise, especially when the reading fell below 50, which indicates contraction.
Narrow leadership
From a technical perspective, the latest attempt to stage an upside breakout has been accompanied by the narrow leadership of the Magnificent Seven.
Take a look at the NASDAQ 100, which is breaking out to the upside while negative divergences are appearing everywhere. Not only is the 5-day RSI negative divergence flashing a warning, relative breadth indicators (bottom two panels) are also weakening.
Unless market breadth were to broaden out, this rally is likely to stall. An analysis of the small-cap Russell 2000 shows that it is attempting an inverse head and shoulders breakout while it is in a relative downtrend. Don’t bank on the breakout, as head and shoulders patterns are deemed to be incomplete until the neckline breaks. This is another sign of breadth weakness that is likely to create headwind for the bulls.
Bullish Exhaustion = Pullback or Consolidation
Preface: Explaining our market timing modelsWe maintain several market timing models, each with differing time horizons. The “Ultimate Market Timing Model” is a long-term market timing model based on the research outlined in our post, Building the ultimate market timing model. This model tends to generate only a handful of signals each decade.
The Trend Asset Allocation Model is an asset allocation model that applies trend-following principles based on the inputs of global stock and commodity prices. This model has a shorter time horizon and tends to turn over about 4-6 times a year. The performance and full details of a model portfolio based on the out-of-sample signals of the Trend Model can be found here.
My inner trader uses a trading model, which is a blend of price momentum (is the Trend Model becoming more bullish, or bearish?) and overbought/oversold extremes (don’t buy if the trend is overbought, and vice versa). Subscribers receive real-time alerts of model changes, and a hypothetical trading record of the email alerts is updated weekly here. The hypothetical trading record of the trading model of the real-time alerts that began in March 2016 is shown below.
The latest signals of each model are as follows:
- Ultimate market timing model: Buy equities (Last changed from “sell” on 28-Jul-2023)
- Trend Model signal: Neutral (Last changed from “neutral” on 16-May-2025)
- Trading model: Neutral (Last changed from “bullish” on 14-Apr-2025)
Update schedule: I generally update model readings on my site on weekends. I am also on X/Twitter at @humblestudent and on BlueSky at @humblestudent.bsky.social. Subscribers receive real-time alerts of trading model changes, and a hypothetical trading record of those email alerts is shown here.
Subscribers can access the latest signal in real time here.
Bullish Exhaustion
You can tell a lot about market psychology by the way it responds to news.
The accompanying chart shows how the S&P 500 responded in the extended trading hours and during the trading day to important news. Why did the S&P 500 rally 2.1% after Trump announced he was pausing the 50% tariffs on the EU for a month? Why did the index initially rally but ended the trading day with just a 0.4% gain last Thursday when the U.S. Court of International Trade ruled that Trump exceeded his authority when he imposed “Liberation Day” tariffs and the tariffs on Canada, Mexico and China for fentanyl smuggling?
Stock prices weakened Friday in reaction to an angry social media declaration by President Trump that China had violated its trade agreement. I interpret the market’s inability to react to good news as a sign of bullish exhaustion.
Poised to Rally
Hedge fund positioning is supportive of a beta chase on good news. Although gross exposure, which reflects the use of capital, is high, net exposure, which reflects directional exposure, is roughly neutral by historical standards.
Similarly, CTA trend followers have recovered from an extreme short position to neutral.
Key Risks
Why didn’t stock prices rally on the news?
You can always point out the risks in hindsight. The S&P 500 is trading at a historically elevated forward P/E of 21.3, which limits upside potential as trade war uncertainty hangs over the market.
The combination of an elevated forward P/E with an above average and decelerating rate of quarterly EPS revisions poses headwinds for equity prices.
One other key risk to asset prices is posed by the bond vigilantes, who recently flexed their muscles by throwing a minor tantrum.
If tariffs are rolled back by the courts, it would expose a big hole in the government’s budgeting process. The Budget Lab estimates the court decision represents a $2 trillion revenue loss over 10 years, which makes the new budget a tough sell for the fiscal hawks in the Republican Party. Treasury Secretary Bessent would be faced with the risk of another bond market tantrum if nothing is done.
Fortunately, the bond market was calm and Treasury yields fell in the wake of the court decision, but risks remain. In particular, bond yield risk is emerging in Japan after a series of disappointing JGB auctions.
Japan’s debt to GDP is over 250%, and the BoJ already owns over half of the country’s debt. As JGB yields rise, the risk of Japanese investors repatriating funds from abroad to take advantage of rising Japanese yields is increasing. Already, Japanese and U.S. 30 years are highly correlated. Further upward rate pressure in Japan could resolve in a disorderly unwind of the Yen carry trade and a global risk-off stampede.
An analysis of the Trump policy equity factors shows the bearish backdrop is continuing. The trade war factor unexpectedly edged up on the news of the court decision, indicating greater tariff anxiety. Inflation expectations and Sell America factors edged up. The court decision and subsequent Trump Administration appeal are elongating the period of trade war uncertainty.
In particular, further strength in the Sell America trade would exacerbate a Yen carry trade unwind.
A Range-Bound Market
The market’s inability to rally on good news was a sign of bullish exhaustion. The recent violation of an upward sloping trend line in the face of positive news reinforces my view that the U.S. equity market is in a wide trading range. Technical conditions point to either a pullback or consolidation in the short-term.
Elevated valuation and continued uncertainty over trade policy, fiscal policy and the growth outlook all serve to create a roof over stock prices and the S&P 500 is unlikely to exceed its all-time highs in the near future. On the other hand, market panics will activate a Trump Put at levels defined by the April lows.
As well, option market sentiment has become a little overly frothy. The 10 dma of the CBOE put/call ratio recycled after falling below its one-standard deviation Bollinger Band. While this isn’t necessarily outright bearish, similar episodes in the last two years has seen the S&P 500 struggle to advance under such conditions.
Don’t buy that TACO just yet
TACO stands for “Trump Always Chickens Out” in trade negotiations. Financial Times journalist Robert Armstrong coined the term “TACO trade” as a colourful way of characterizing the Trump Put. When questioned by a reporter, Trump turned livid when he learned what TACO stood for.
It is in that context when, later in the day, the three-judge panel of the U.S. Court of International Trade unanimously ruled against the Trump Administration in VOS Selections v U.S. and struck down a whole range of tariffs by citing a lack of authority. The most equity bullish outcome would have been Trump taking this legal exit ramp to retreat from his trade war. Instead, he doubled down with the following social media message, possibly egged on by the TACO question. What was even more disturbing was the inclusion of Pepe the frog (my highlight), which was an image appropriated by White supremacists during the 2016 election.
The Court Ruling
The U.S. Court of International Trade ruled that the Trump Administration didn’t have the authority under the International Emergency Economic Powers Act of 1977 (IEEPA) to impose the sweeping tariffs which caused such turmoil in the global trade and financial markets: “The court does not read IEEPA to confer such unbounded authority and sets aside the challenged tariffs imposed thereunder.”
It further found that it would be unconstitutional for Congress to cede “unbounded tariff power” to the President: “An unlimited delegation of tariff authority would constitute an improper abdication of legislative power to another branch of government”, as Congress specified in IEEPA when and how a President could use such authority. IEEPA authority is designed to “deal with unusual and extraordinary threats”. Fentanyl smuggling and trade deficits don’t meet these definitions.
In effect, the court unwound the tariffs levied by Trump on Canada, Mexico and China on fentanyl smuggling, and the “Liberation Day” tariffs exacted by the Trump Administration. By implication, it creates an air of uncertainty over the numerous trade negotiations that the U.S. has undergone or is undergoing with trading partners, such as China, the European Union the U.K., and so on.
The Trump Administration has said that it will appeal the decision. The accompanying chart summarizes the effects of the court decision. Section 204 tariffs on imports from China levied announced in the 2017–2024 period stay in place, as well as the sectoral tariffs on aluminum, steel and autos.
What’s Next?
What comes next? The path forward depends on a variety of variables.
The government has 10 days to remove the tariffs and begin processing refunds. The Trump Administration has said that it will appeal. An appeal court granted an emergency stay on tariff collection, which allows the government to continue collecting the tariffs pending the appeal decision. Otherwise, the loss of revenue would create a hole in the budget process and could unsettle the bond market.
The government has a number of workaround options in light of the court decision that avoid the use of Trump’s authority under IEEPA:
- Trump could immediately issue a Section 122 tariff proclamation of up to 15% for up to 150 days to mitigate a “serious balance of payment deficit”. The tariffs can be extended by Congress beyond the 150-day limit.
- Section 232 of the Trade Act of 1974 authorizes the Secretary of Commerce to recommend sectoral tariffs, which has been done in aluminum, steel and autos. Investigations in electronics, pharmaceuticals, copper and lumber under Section 232 are already underway. Watch for additional preliminary investigations in semiconductors and critical minerals and for the authority to impose tariffs pending the publication of the final reports. Section 232 has a strong foundation of authority, but implementation takes a long time and it requires consultation.
- The U.S. Trade Representative (USTR) can investigate unfair trade practices by foreign governments under Section 301 of the Trade Act of 1974. Once acts of a foreign government are found to be unreasonable or discriminatory and burden U.S. commerce, the USTR may take “all appropriate and feasible action, subject to the specific direction of the president, to obtain the elimination of the act, policy or practice”.
If the IEEPA decision is upheld on appeal, the Trump Administration could replace most of the tariffs with a patchwork of other tariffs. These measures will not be immediate and take time to implement. Depending on the pace of appeals and legislative pace, full implementation of a tariff regime won’t be complete until Q2 2026.
The Economic Fallout
The fallout from the court decision is just beginning. Even before the announcement of the decision, trade policy uncertainty levels had already gone through the roof. Now questions are arising over the timing, implementation of tariffs and even the basis for trade negotiations.
Similarly, the U.S. Economic Policy Uncertainty Index is at record levels.
The recently released FOMC meeting minutes of May 6–7 provide a window into the decision process of not only policy makers at the Federal Reserve, but also businesses operating in the current environment of uncertainty: “Participants agreed that uncertainty about the economic outlook had increased further, making it appropriate to take a cautious approach until the net economic effects of the array of changes to government policies become clearer”.
Fed staff forecast was starting to scream stagflation. Price pressures are rising. Tariffs were expected to “boost inflation markedly this year and to provide a smaller boost in 2026”. Regional Fed survey responses suggested firms “were planning to either partially or fully pass on tariff-related cost increases to consumers”. As well, regional Fed Presidents heard from business contacts that businesses who weren’t directly affect by tariffs might raise prices if competitors did so.On the other hand, employment was expected “weaken substantially” over the remainder of 2025. We can see some of the loss of momentum in the jobs market in initial jobless claims and continuing claims reports. On one hand, initial claims have been relatively steady, which reflects a cautious employment market that’s slow to fire workers.
On the other hand, continuing claims have risen to a new high, which underscores the difficulty that job seekers are experiencing finding new employment.
To be sure, Trump reduced the tariffs on China from 145% to 30% after the FOMC meeting, but imagine yourself in the shoes of a business owner or the corporate executive. In the short run, do you reinstate foreign orders, especially from China, and risk a whipsaw in policy or legal decisions? Or do you wait? What about expansion plans? Would you make a long-term commitment to expand U.S. production and hire new staff, or do you wait?
The logical response is to wait. Just as the Fed has done to adopt a wait-and-see attitude to monetary policy. Fed Chair Powell said at the post-FOMC press conference that the costs to waiting to learn more was “fairly low”. Expect business to follow a similar level of decision paralysis, which will resolve in a growth slowdown in the coming months.
Make no mistake, a growth scare is on the horizon. Nancy Qian, professor of economics at Northwestern University, and the co-Director of Northwestern University’s Global Poverty Research Lab, wrote a MarketWatch op-ed by arguing that Trump’s tariffs will hit harder than how many dolls a family can buy:Trump and his advisers are both trivializing and misrepresenting the real economic hardship that high tariffs could cause. Most Americans are struggling to meet their basic needs. The pretax income required for the median two-adult, two-child household to cover basic necessities (housing, child care, food, transportation, costs for education, clothing, personal care items) was $106,903 in 2024. And yet, around 60% of households earn less than $100,000 per year; 50% less than $86,000; and around 14% less than $25,000.
Even if one parent drops out of the labor force to save on child care costs, the single earner would need $85,074. These “basic necessities” exclude eating out, leisure activities, holidays, savings, retirement or other long-term financial investments. These are “luxuries” that require even more money.
It should come as no surprise that a large share of basic necessities are imports. Some 59% of fresh fruits and vegetables consumed in the U.S. (including 90% of bananas and 70% of tomatoes) are imported, as is 25% of orange juice. Growing children regularly need new clothes and shoes, more than 95% of which are imported. The same goes for school supplies: two-thirds of all pencils sold in the U.S. are imported, as are many books and the paper used to print books domestically. Personal items for adults will also be affected. For example, nearly all razorblades are imported.
Supply chain tariff disruptions are already occurring. Some are similar in magnitude to the conditions during the COVID Crash, and these disruptions won’t magically disappear overnight. The economy will inevitably begin to see their effects in Q3. It’s just a question of how long the uncertainty lasts.
The Problem with TACO
In addition, I believe that while TACO makes a catchy acronym, it isn’t entirely correct. Trump doesn’t always chicken out. In his book, The Art of the Deal, Trump outlines how he identifies leverage in a negotiation and puts himself to maximize that leverage.
In trade and foreign affairs, Trump has backtracked in his dealings with China and the EU on trade, and Russia, and even the Houthis on foreign policy. He has demonstrated his desire to avoid war, which is the reasoning behind his rapprochement with Iran while brushing aside the priorities of the Israeli government.
He has been more successful in applying his leverage against domestic adversaries, such as law firms, universities in his crusade against “woke culture” and immigrants.
The greatest near-term threat to growth is Trump’s deportation initiative. The New York Times documented how Trump has expanded the pool of people subject to deportation.
I documented in the past the potential fallout of deportations (see Two Risks to the Bull That No One Is Talking About). A Peterson Institute study estimated GDP growth and inflation of light (1.3 million people) and severe deportation (8.3 million) over a four-year window, as well as the effects of different tariff rates and the revocation of Fed independence. The magnitude of the effects on growth and inflation of deportation is substantially higher than either tariffs or the revocation of Fed independence.
A Brookings Institute study, which assumed an extreme scenario of a mass deportation of over one million people in 2025 is reminiscent of the Eisenhower deportations of 1954, modeled a one-year GDP growth shock of -0.4%. To make an apples-to-apples comparison to the Peterson study, its assumption of the removal of 1.3 million illegals caused a negative GDP growth shock of -3.8% over four years, which averages to just under -1% a year.
As an indication of the priority given to Trump’s deportation initiative, the heads of ICE’s Homeland Security Investigations and Enforcement and Removal Operations divisions were reassigned because they did not reach the government’s arrest and deportation targets.
The Market Reaction
The market reaction to the court decision was unexpected. S&P 500 futures opened up 1.4 % overnight after the news, but gains slowly eroded and the S&P 500 ended the next day up only 0.4%. More importantly, the trade war factor was positive the next day, indicating belief that trade tensions would continue to rise.
Under these circumstances, investors should embrace the “Sell America” trade by avoiding USD assets. The court decision just prolongs the uncertainty over the effects of the trade war. It’s time to buy greater growth outlook certainty by diversifying into non-U.S. assets.
Don’t just obsess over NVIDIA
Mid-week market update: On the weekend, I presented this inverted chart of the S&P 500 as a different perspective and rhetorically asked, “Would you buy a stock with this chart?”
At the time, I had a slight bearish tilt on the market. Since then, the news backdrop has been calming. Trump extended the deadline for the implemented of the 50% tariffs on EU imports from June to July. The Japanese long bond initially rallied on news of a lower than expected supply, though the auction overnight of the 40-year JGB was disappointing. Consumer confidence unexpectedly improved, and the prospect of a nuclear deal with Iran may be on the horizon, which would reduce the geopolitical risk premium.
The S&P 500 calmed as well, and it’s now back to test the trend line. The next big catalyst is the NVIDIA earnings report due after the close today.
While NVIDIA will largely determine the market’s short-term direction, investors can find other pockets of superior performance.
All Eyes on NVIDIA
I have not special insight on NVIDIA. The latest implied pricing for a post-report move on the stock from the option is a 6% swing. My assessment of the risk/reward is it’s slightly tilted to the downside. NVIDIA is a Magnificent 7 stock that has enjoyed solid gains while EPS estimate revisions are the best in the group. Expectations are tilted to the upside. While there is room for disappointment, the actual results and reaction is probably not much different from a coin flip.
From a technical perspective, the technology sector is losing relative momentum, which could be problematic regardless of NVIDIA’s results. Relative performance and relative breadth indicators are all falling, though positive.
Opportunities in banks and financials
Instead, investors may find better opportunity for relative performance in banking and financial stocks. Fund flows into KRE, the bank ETF, have been extremely week, which presents a contrarian opportunity.
On the other hand, financial stocks are testing a relative support level while relative breadth indicators are positive while trending sideways.
This combination of negative sentiment and positive technical backdrop argues for limited downside risk while presenting upside potential.
You see – there are other ways of playing the market other than obsessing over NVIDIA.
Bond vigilantes and trade tensions derail the momentum bull
Preface: Explaining our market timing modelsWe maintain several market timing models, each with differing time horizons. The “Ultimate Market Timing Model” is a long-term market timing model based on the research outlined in our post, Building the ultimate market timing model. This model tends to generate only a handful of signals each decade.
The Trend Asset Allocation Model is an asset allocation model that applies trend-following principles based on the inputs of global stock and commodity prices. This model has a shorter time horizon and tends to turn over about 4-6 times a year. The performance and full details of a model portfolio based on the out-of-sample signals of the Trend Model can be found here.
My inner trader uses a trading model, which is a blend of price momentum (is the Trend Model becoming more bullish, or bearish?) and overbought/oversold extremes (don’t buy if the trend is overbought, and vice versa). Subscribers receive real-time alerts of model changes, and a hypothetical trading record of the email alerts is updated weekly here. The hypothetical trading record of the trading model of the real-time alerts that began in March 2016 is shown below.
The latest signals of each model are as follows:
- Ultimate market timing model: Buy equities (Last changed from “sell” on 28-Jul-2023)
- Trend Model signal: Neutral (Last changed from “neutral” on 16-May-2025)
- Trading model: Neutral (Last changed from “bullish” on 14-Apr-2025)
Update schedule: I generally update model readings on my site on weekends. I am also on X/Twitter at @humblestudent and on BlueSky at @humblestudent.bsky.social. Subscribers receive real-time alerts of trading model changes, and a hypothetical trading record of those email alerts is shown here.
Subscribers can access the latest signal in real time here.
A Wide Trading Range
I warned you. Last week, I warned that the stock market was undergoing a wide trading range because of policy uncertainty (see What the Trade Détente Means for Investors): “The news out of the meeting in Geneva underlines an important point about the latest market tantrum and recovery. It was all attributable to U.S. policy that depends on the whims of one man, whose opinions can be unpredictable.”
I also argued that it was time for the stock market to take a breather. Since then, the S&P 500 began to pull back. The catalysts came in the form of a credit downgrade to U.S. debt and a poor 20-year Treasury auction, followed by President Trump’s threat to put a 50% tariff on the EU and a 25% tariff on Apple products not assembled in the U.S.
Let’s start with the fallout from the debt downgrade and bond market tantrum. While the sample size is extremely small (n=2), the experience from past credit downgrades has shown sloppy S&P 500 returns on a short-term horizon and positive on a 6–12-month time horizon. At a minimum, stock prices need some time to digest their gains after the rebound off the April low.
A Bond Vigilante Moment
The combination of the credit downgrade and the poor 20-year Treasury auction spike the 30-year Treasury yield above 5%. It isn’t just U.S. yields, bond yields are rising around the world.
The last two times the 30-year yield topped 5% were buying opportunities for stocks as rising yields were contrarian signs of market panic. Here’s what’s different this time. Past occasions of high 30-year yields attracted funds into USD assets, as the USD Index was either flat to up on those occasions. This time, rising Treasury yields coincided with USD weakness, which is a signal of an erosion of USD assets as a safe-haven and calls into question the stability of Treasury paper.
Investors should therefore not regard the current episode as a contrarian buy signal for stocks. Instead, it should be seen as a warning signal of further headwinds for equity prices. That’s because Treasury Secretary Scott Bessent finds himself in a similar situation as Treasury Secretary Janet Yellen did in October 2023 when bond yields were spiking. Yellen responded by shifting Treasury issuance to short-term paper. The subsequent change in market psychology which saw short rates fall boosted the economy and stock prices. Today, Treasury issuance is already heavily tilted to short maturities, and the Fed is less inclined to cut rates. It’s not clear what other tools Bessent has to stabilize the stock market and economy.
Market Headwinds
The stock market is facing a number of headwinds.
To begin, valuations are elevated by historical standards. With the S&P 500 forward P/E at 21.1, which is already historically high, earnings estimates will need to do most of the heavy lifting for stock prices to advance.
Researchers at the San Francisco Fed modeled the effects of a 25% tariff on imported goods. The good news is the inflation effect on consumer goods is relatively low. The bad news is the tariffs have a significantly higher inflation effect on production costs. The study concluded:
Estimates imply that, if completely passed through to finished goods, an across-the-board 25% tariff raises investment prices 9.5%, compared with 2.2% for consumer prices. The former can have important implications for businesses’ investment decisions through an increased cost of capital expenditure.
This translates into margin compression, which will feed into downward pressure on earnings estimates.
At a minimum, companies will be more hesitant to expand, which puts a brake on the economy’s growth potential.
The Trade War Re-emerges
Another growth headwind is attributable to the incomplete nature of the Sino-American temporary trade truce. The terms of the 90-day trade truce did not relax China’s rare earths export ban. A shortage of rare earths is beginning to threaten global supply chains. A Financial Times article reported that “The window to avoid significant damage to production is rapidly closing”.
Then, investors have to face the unpredictability of the Negotiator-in-Chief. Trump threatened to impose a 50% tariff on the EU starting on June 1.
While it’s doubtful that the combined final tariff rate on EU imports will be 50%, the modeled effects of a 50% from the Budget Lab is shown in the table below. U.S. 2025 real GDP growth falls -0.2% to -0.8%. Q4 employment falls by another -130,000 to -590,000. Short-term PCE rises 0.5% from 1.7% to 2.2%. In other words, greater stagflation.
This analysis doesn’t mean I am bearish on stocks. Stock prices rise in the long run and in the absence of recessions, I just believe the opportunities are better in non-U.S. markets, which present better value on a relative basis. Investors should diversify their holdings and underweight the U.S.
Much of the leadership by U.S. stocks since the GFC has depended on the dominance of its technology sector. Tactically, the rebound off the April low was led mainly by the Magnificent Seven. If that leadership were to falter, what’s left?
The consensus rates of earnings growth by the Magnificent Seven are expected to slow compared to the rest of the S&P 493 in 2026.
In the absence of growth potential, investors are likely to rotate into value stocks, which can be found outside the U.S. Investors are already witnessing signs of a shift in leadership. U.S. stocks have lagged global stocks since the end of 2024. Europe and EM ex-China have been in the lead, followed by a choppy Japanese market. China’s relative performance has been erratic.
Would You Buy This?
In conclusion, the stock market advance is due for a pause and faces numerous headwinds. The rise of the bond vigilantes, elevated valuation and heightened earnings risk, and narrow leadership combined to increase risk.
If you are in doubt, ask yourself the following question. The accompanying chart shows the S&P 500 on an inverted scale. Would you buy a stock with chart like this?
As well, the usually reliable S&P 500 Intermediate Term Breadth Momentum Oscillator (ITBM) flashed a tactical sell signal when its 14-day RSI recycled from overbought to neutral. My inner trader wasn’t paying attention when the signal triggered last week. While he is mildly bearish, it may be too late to short the market and he is therefore staying on the sidelines.
The S&P 500 is breaking down technically and a pullback wouldn’t be out of line under these circumstances. At a minimum, expect a period of sideways consolidation.
Sell America = Buy Gold
I am reiterating my bullish view on gold. Gold staged an upside breakout through a cup-and-handle pattern at 2100 in early 2024 and hasn’t looked back since. Moreover, it has staged upside relative breakouts against both the S&P 500 and a 60/40 proxy and it has stayed above the relative breakout levels even after the recent pullback. The technical pattern of multi-year bases and subsequent absolute and relative breakouts is highly reminiscent of the pattern experienced by gold at the start of the 21st Century, which took the yellow metal from its breakout at 500 in 2004 to significant higher prices.
I believe this is just the start of a secular bull cycle for gold prices, based on a secular Sell America investment cycle.
Sell America = Gold Tailwind
The recent market embrace of the Sell America investment theme has given gold prices a significant secular tailwind. That’s because Trump’s abrupt pivot to an isolationist policy has shaken confidence in the status of American geopolitical leadership and the status of the USD “exorbitant privilege”. In late March, I wrote (see Uncharted Investor Waters: From Soft to Hard Power).
Trump’s ultimate game plan is to reshore manufacturing by reversing the effects of globalization. He has implemented an approach of harvesting the goodwill from U.S. alliances since the end of World War II, and through the implementation of trade barriers and economic pro-growth policies.
The long-term costs of these policies are the probable stall in productivity, and an increase in the cost of capital to U.S. companies through the removal of the USD’s “exorbitant privilege” as a reserve currency.The Moody’s downgrade of U.S. debt from Aaa to Aa1 underlines a number of stress points that are rattling the bond and currency markets, as well as the points I made about the loss of “exorbitant privilege”.
- Deficits are projected to grow as entitlement spending rises and revenue stays flat.
- Ongoing fiscal deficits are exacerbating a supply-demand imbalance in Treasuries.
- The inflationary effects of the trade war could see a hawkish Fed against a dovish backdrop by other major central banks, which will reduce the relative growth potential of the U.S. economy against the rest of the world.
- Possible U.S. policy changes will see investors demand a higher premium for U.S. Treasury debt in the face of increasingly unfriendly tax treatment and rising uncertainty.
Do Deficits Matter?
President Trump and the Republican-controlled Congress have been operating under the age-old assumption that deficits don’t matter. I would add that “deficits don’t matter – until the day they do”.
Bond rating agencies, as well as the market, may be telling the U.S. Treasury that budgets are about to matter. Consider the budget proposals making their way through Congress. Without going into too many details that will still have to be ironed out, the accompanying chart shows the effects of the budget proposals on the deficit. As it is the case with virtually all budgetary math projections, the budget plan frontloads the benefits (tax cuts) and backloads the politically painful spending cuts. This will have a fiscal stimulative effect on the economy in the first two years, which is potentially equity bullish, while risking bond and foreign currency tantrums.
A Penn Wharton budget analysis of the budget proposals, as presented, would increase the deficit by $3.3 trillion over 10 years. However, some of the provisions of the budget expire in 2029. If those provisions were to be extended, an alternative analysis shows a deficit of $4.8 trillion over the same time frame.
The projections depend on two key assumptions: 1) Stable debt costs, which would spike the overall deficit as interest rates rise; and 2) the absence of a recession, which would crater tax revenue and spike the deficit.
Here is why deficits may start to matter as Treasury supply-demand imbalances become evident. Brad Setser documented how official demand for Treasuries have been falling.
In general, bond inflows have also been falling. Setser rhetorically asked if the flows can return to the $1-trillion annual pace, which would sustain a 4% of GDP funding level, or stay at the $500 billion level. Setser concluded, “I do think it is fair to note that increasing a 6.5% of GDP fiscal deficit into…waning foreign demand for coupons is a well, somewhat bold, move”.
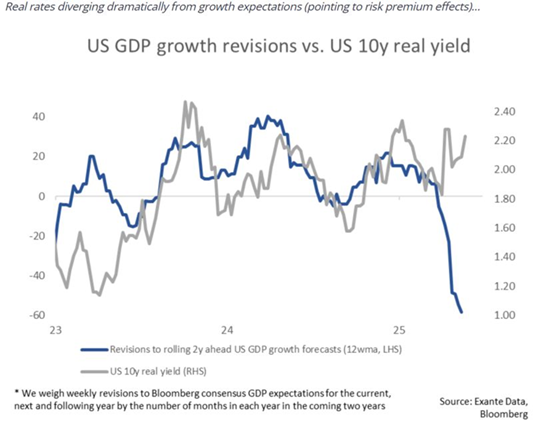
Jens Nordvig, the CEO of Exante Data, had an even more alarming observation. U.S. real yields are spiking even as economic growth expectations are falling. These are indications that the market is losing confidence in the U.S. and U.S. exceptionalism.
The Fed Policy Wildcard
Meanwhile, over at the Federal Reserve, policy makers have adopted a cautious approach to monetary policy. While falling inflation indicators would ordinarily warrant interest cuts in the near future, the uncertain effects of the new tariff regime on inflation has resulted in a go-slow and wait for the data approach to interest rate policy.
The most disturbing development is the May University of Michigan survey of one-year inflation expectations, which spike to an astounding level of 7.3% and long-run inflation expectations rose from 4.4% to 4.6%. While the University of Michigan survey might be dismissed a data anomaly, the New York Fed survey of one-year inflation expectations has been slowly ticking up. These results raise the risk of inflation expectations becoming unanchored and force FOMC members to tilt more hawkishly.
As well, Robin Brooks highlighted a growing divergence between the bond market’s inflation expectations in the U.S. and eurozone. While eurozone expectations have been largely flat, U.S. expectations are rising. This will lead to a divergence in monetary policy. The European Central Bank (and other central banks) will ease, while the Fed stays tight. The glass half-full interpretation is that interest rate differentials should boost the value of the USD, while the glass half-empty interpretation is a perceived economic growth differential between the U.S. and the rest of the world, which is bearish for the USD and U.S. assets.
In summary, this leaves U.S. fiscal and monetary policy in a difficult position as it’s exposed to rising tail-risk. If fiscal policy is too easy, it risks a bond and foreign currency tantrum that leads to a drop in the USD and rising bond yields. On the other hand, if fiscal or monetary policy is too tight, it risks a recession, which rapidly expands the deficit and the fiscal sustainability questions raised by Moody’s and other rating agencies that downgraded U.S. debt.
Other Policy Risks
As well, two policy initiatives considered by the Trump Administration have the effect of either reducing demand for USD assets or causing investors to require a higher yield for holding Treasury paper. In addition to putting upward pressure on yields, these policies would put downward pressure on the USD.
One proposed provision of the new tax bill, Section 899, increases the tax rate on countries that “unfairly target and burden U.S. businesses and individuals operating abroad” based on the imposition of an “unfair foreign tax”, such as a tax on digital services and a global minimum tax. It raises the U.S. federal tax rate by 5% to 20% on tax residents of offending countries and has language that overrides existing tax treaties. The new rates would apply to passive U.S. source income such as dividends, interest, royalties and rents, as well as active U.S. operating income.
At a minimum, an enacted Section 899 of the tax code would impose a tax on interest income such as Treasury and Agency paper on investment by entities tax domiciled in jurisdictions with “unfair foreign taxes”, such as the EU which is part of the global foreign tax regime agreed to in the past. It effectively deters foreigners from holding Treasury paper and reduces their demand.
Oops. That’s one way of encouraging capital flight and depressing the USD.
In addition, the Moody’s downgrade of U.S. debt from Aaa to Aa1 with a stable outlook depends on some key assumptions that may be overly sanguine about U.S. policy direction. First, it checks the boxes by focusing on debt levels and debt servicing capacity relative to other top-rated sovereign issuers. It also raised concerns about rising spending based on demographics while revenue stays flat.
One of the rationales for a stable outlook is the assumption that “the U.S. will continue its long history of very effective monetary policy led by an independent Federal Reserve”. It added, “Underpinning the rating is our assumption that…monetary and macroeconomic policy effectiveness will remain very strong, preserving macroeconomic and financial stability through business cycles.”
Jerome Powell’s term as Fed Chair will end in May 2026. Can investors expect a similar level of Fed independence once he has left? The market’s attention will turn to his replacement in H2 2025, which is the probable time frame the new Fed Chair will be nominated. Trump has criticized Powell several times in the past for being too slow to cut interest rates.
In the meantime, Fed Chair Jerome Powell addressed the current climate of uncertainty in a recent speech and signaled that the Fed may take a more hawkish stance on monetary policy: “Longer-term interest rates are a good deal higher now [compared to 2020] … [and] may also reflect the possibility that inflation could be more volatile going forward than in the inter-crisis period of the 2010s. We may be entering a period of more frequent, and potentially more persistent, supply shocks—a difficult challenge for the economy and for central banks.” Other FOMC members, such as Atlanta Fed President Raphael Bostic supported Powell’s cautious view and warned that “the economy may be on the brink of price-hike wave”.
The next Fed Chair is likely to bring a more dovish perspective to monetary policy, especially if a Republican is in the White House. Leading candidates like Kevin Warsh and Judy Shelton fit this template perfectly.
Would a Warsh or Shelton Fed be able to maintain the same level of credibility with the markets as previous Fed Chairs stretching from Volcker to Powell? What if inflation rates were to rise as tariffs have their effect on pricing levels? Does that risk a Liz Truss moment in the U.S.?
Already, the market’s inflation expectations have staged an upside breakout. The potential combination of a stimulative fiscal and monetary policy has the potential to really rattle markets.
Bullish on Gold
In conclusion, the Sell America investment theme is becoming a dominant market narrative, and it’s bearish for USD assets and therefore bullish for gold. It is driven by the combination of rising deficits, shaky bond markets, an increasingly hawkish Fed and policy uncertainty.
I believe gold is just in the early stages of its secular bull. The bull run will not end until psychology changes and the mom-and-pop investor piles in. Current retail demand is mainly driven by the Asian investor and U.S. and European investors are nowhere to be seen.
As well, global family office allocations to gold and precious metals in 2025 was only 2%. Market tops don’t look like this.
For a long-term perspective of the upside potential in gold, a point-and-figure chart of monthly gold prices, using a 5% box size and 3-box reversal, shows a measured objective of almost $7,000. I interpret this as an indication that the gold bull is only starting and it has several years to go before it reaches a final top.
Tactically, the gold mining stocks staged an upside breakout from a bull flag, which is a continuation pattern, after its 14-day RSI neared the 40 level, which is where it bottomed in the recent past. Market internals, such as the gold miner to gold ratio and percentage bullish, are showing neutral readings. These are indications of further short-term upside potential.
Disclosure: Long GDX
Is Sell America sneaking up on the equity bulls?
Mid-week market update: The S&P 500 were consolidating its gains after the upside price gap in reaction to the Sino-American interim trade agreement. You can tell a lot about the psychology of a market by the way it reacts to gaps. So far, the gap hasn’t been filled – and some gaps are never filled, which is a bullish development.
Beneath the surface, however, risks are rising, especially in the form of the ascendance of the “Sell America trade”.
Sell America
The Sell America trade has been strong ever since news of Moody’s downgrade of U.S. Treasury debt hit the tape. Foreign developed market stocks, as measured by MSCI EAFE, has outperformed the S&P 500; The price of foreign sovereign debt has outpaced their duration-equivalent Treasuries; and the USD has been weak.
Much of this reaction is attributable to fears of American policy to weaken the USD as G-7 finance ministers meet in Banff, Canada this week.
Pushing back against Sell America
However, some prominent analysts have pushed back against the Sell America narrative. Most recently, Morgan Stanley turned bullish in U.S. assets, except for the USD. The firm expects the U.S. stocks to get a boost from easing inflation and further interest rate cuts. It now expects the S&P 500 to reach 6,500 in Q2 2026, instead of the end of 2025.
Bloomberg pointed out that tech-heavy sectors are still leading 2025 earnings estimates and are among those that have seen least damage and even upgrades since the Q1 earnings season began.
In addition, Ed Yardeni observed that Asian institutions that are large holders of Treasury paper greeted the Moody’s downgrade with a yawn, as it contains no new information.
Yardeni suggested that, aside from this jump in 30-year yields, the Moody’s downgrade did not seem to trigger global investors to “sell America”.Notably, a warning from Moody’s around the impact of a $36.2 trillion U.S. debt pile was “news to exactly no one” in Asia, nor was the ratings agency’s flagging of elevated U.S. interest payment ratios, Yardeni said.
“The Moody’s call is backwards-looking,” Yardeni argued, adding that a “feel-good effect” over indications that Trump’s tariff push will not be as aggressive as initially feared has helped to “drown out” worries over an ongoing budget bill debate in Washington.
The Tactical View
Still the tactical view of the Sell America trade is still negative. The markets adopted a risk-off tone after the weak 20-year Treasury auction today. Both the S&P 500 (SPY) and long Treasury ETF (TLT) skidded badly in the wake of the auction.
Breadth has also been weak in the latest rebound. The market was led mainly by the Magnificent Seven as the equal-weighted S&P 500 lagged.
These conditions leave the stock market vulnerable to a setback. I continue to believe that the S&P 500 is in a wide trading range. The upper bound is at or near the all-time high. The lower bound is the April low, though it will take a severe case of negative news to get there.
S&P 500: A Healing Patient Who Needs Rest
Preface: Explaining our market timing modelsWe maintain several market timing models, each with differing time horizons. The “Ultimate Market Timing Model” is a long-term market timing model based on the research outlined in our post, Building the ultimate market timing model. This model tends to generate only a handful of signals each decade.
The Trend Asset Allocation Model is an asset allocation model that applies trend-following principles based on the inputs of global stock and commodity prices. This model has a shorter time horizon and tends to turn over about 4-6 times a year. The performance and full details of a model portfolio based on the out-of-sample signals of the Trend Model can be found here.
My inner trader uses a trading model, which is a blend of price momentum (is the Trend Model becoming more bullish, or bearish?) and overbought/oversold extremes (don’t buy if the trend is overbought, and vice versa). Subscribers receive real-time alerts of model changes, and a hypothetical trading record of the email alerts is updated weekly here. The hypothetical trading record of the trading model of the real-time alerts that began in March 2016 is shown below.
The latest signals of each model are as follows:
- Ultimate market timing model: Buy equities (Last changed from “sell” on 28-Jul-2023)
- Trend Model signal: Neutral (Last changed from “bearish” on 16-Apr-2025)
- Trading model: Neutral (Last changed from “bullish” on 14-May-2025)
Update schedule: I generally update model readings on my site on weekends. I am also on X/Twitter at @humblestudent and on BlueSky at @humblestudent.bsky.social. Subscribers receive real-time alerts of trading model changes, and a hypothetical trading record of those email alerts is shown here.
Subscribers can access the latest signal in real time here.
A Bullish Recovery
The bullish recovery of the S&P 500 has been astounding in speed and magnitude. Not only has the S&P 500 regained its 200 dma, but also the NYSE Advance-Decline Line has made an all-time high. This is a welcome bullish development. That said, weakness in the mid- and small-cap A-D Lines is disconcerting.
A Trend Model Upgrade
As a consequence, I am upgrading the signal of my Trend Asset Allocation Model from bearish to neutral.
As a reminder, the model applies trend-following principles to global stock markets and commodity prices to create a composite signal for asset prices. I use a long moving average to define the trend, a short moving average for risk control. Let’s take a quick tour around the world to see how the technical picture has evolved over the past few weeks.
In the U.S., the S&P 500 has strongly rallied through its 50 dma and 200 dma.
Across the Atlantic, European markets show a similar pattern of strength. The Euro STOXX 50 is trading just short of its all-time high.
In Asia, the stock markets of China and its trading partners are also recovering, though not as strongly as the U.S. and Europe. Taiwan is still below its 50 dma and Japan tested its 50 and pulled back.
Commodity prices, which are sensitive cyclical indicators, have also bounced back, albeit somewhat weakly. The Invesco/DB Commodity Index is struggling with resistance at the 50 and 200 dma. Weakness is mainly attributable to energy prices, which has a significant weight in the index. By contrast, the equal-weighted index has cleared moving average resistance. The cyclically sensitive copper/gold and base metals/gold ratios have all bottomed and turned up.
Putting it all together, the general picture is a technical recovery from deeply oversold conditions. The combination of some stock indices that can be interpreted as starting uptrends and relative weakness in Asia and commodities create the composite picture of a neutral reading on risk appetite.
The patient is healing, but still needs to rest.
Reasons for Caution
In the short run, the market rally has gone too far and too fast. It’s time for a pause or brief pullback.
The 5 dma of the total put/call ratio fell to a low of 0.74 last week, which is put sentiment back in the froth zone. Sentiment has changed from fear to complacency. Keep in mind, however, that sentiment is a condition indicator and not a trading indicator.
The market recovery was mainly driven by a stampede into U.S. growth stocks, or the Magnificent Seven. The value and growth factor responses in non-U.S. developed markets was not as strong. In fact, much of the market weakness and recovery was a value and growth story. As trade war anxiety grew, the fast money hedge fund crowd fled growth for value and they were forced out of their position by risk managers at the bottom. Since then, they have been rebuilding their exposure.
While the rebound off the April bottom was very fast and strong, the leadership was narrow, which is a concern. An analysis of four major quantitative factors that explain U.S. equity returns shows that leadership was driven by price momentum. Quality was weak. Growth was dominant over value and large caps beat small caps. That’s another way of saying that the Magnificent Seven has become the only game in town again.
Time for a Breather
In conclusion, the recovery off the April panic bottom has been extremely strong, but the market may need some time to take a breather in the short run.The rebound produced numerous price momentum-based buy signals, one of which is the rare Zweig Breadth Thrust. There have only been nine ZBT buy signals since Marty Zweig wrote about his technique in 1986. The market was higher 100% of the time in the out-of-sample period 6 and 12 months later. The only instances of short-term failures occurred when the Fed was tightening, which is not the condition today.
However, I would sound a word of warning about all of the breadth thrust and price momentum buy signals. Past price surges were usually sparked by a sudden change in monetary or fiscal regime, which is not the case today. Even though recession risk is fading, the trade war isn’t over and the market may be under-pricing the odds of a growth scare later this year. The Fed will stay on hold until it sees how inflation and inflation expectations evolve. The S&P 500 is trading at a forward P/E of 21, which is high by historical standards. As well, the U.S. Treasury needs to re-finance $9 trillion of debt in 2025 while facing an uncertain tax and budget process which could spark a bond market tantrum.
The news of the Moody’s downgrade of U.S. debt saw the markets adopt a risk-off posture. The accompanying chart of SPY shows the index lost all of the gains on the day to close the after-hours session in the red. In light of the extended and narrow nature of the advance, this may be the catalyst that sparks a pullback or consolidation. It remains to be seen how bearishly the market interprets the downgrade. Stay tuned.


What the Trade Détente Means for Investors

Here’s what the trade détente means for investors.
Economic Effects
The Budget Lab also modeled a number of other effects of the revised trade deal.
- PCE rises 1.7% pre-substitution and 1.4% post-substitution, assuming no Fed response.
- GDP real growth in 2025 is 0.7% lower.
- Long-run GDP growth is 0.4% lower, with differing sector effects. Manufacturing output grows by 1.5%, but that’s offset by losses in output in agriculture at -1.1% and construction at -3.1%.

In other words, higher inflation and slower growth.
Questions for Policy Makers
While receding recession risk is a welcome development, I have many questions for policy makers, for the economy and for investors.

We’ve gone from “trade deficits are bad”, which has been a core Trump belief since the 1980s, and “let’s bring manufacturing jobs back to America” to “let’s make a deal with China” over a single weekend. Is this a tactical or a strategic shift in thinking?

Treasury Secretary Scott Bessent has outlined one of the objectives that the Trump Administration of success is to lower the 10-year Treasury yield. Bessent faces considerable challenges. Inflation expectations have risen in the wake of the trade deal; $9 trillion of U.S. debt will mature in 2025. The initial version of the Republican tax plan would extend TCJA cuts while adding $4.9 trillion in debt over 10 years, though the objective is to reduce that figure a $4.0–$4.5-trillion range.
China found Trump’s Achilles Heel by leveraging the supply chain sensitivities of the U.S. economy to Chinese exports. Other trading partners have also discovered negotiating leverage through the use of the bond market vigilantes. There had been a rumour floating around that Canadian Prime Minister and former central banker Mark Carney had instructed Canada’s finance department to accumulate Treasuries in order to create a war chest of Treasury paper, and he had co-ordinated a synchronized sell-off of U.S. debt with other G-7 partners. When a reporter questioned him about the rumour, he deflected the question and just smiled enigmatically.

I believe one of the biggest risks to risk appetite is a rising concern over the fiscal deficit as the Treasury’s estimate X-date, or the date the government runs out of money, approaches in August. The Trump and Republican wish list to extend the TCJA tax cuts and other pro-growth measures faces a large fiscal shortfall that has to be resolved. Cuts to Medicaid have the potential to doom the GOP in the mid-term elections, and fiscal fixes like raising taxes on millionaires has the potential to split the Republican Party.

From a big picture perspective, upward pressure on Treasury yields is a symptom of growing stress of Treasury issuance absorption in the absence of traditional buyers. Foreign official demand is weak, especially if Trump reduces the trade deficit which leaves fewer USD for foreigners to recycle back into the Treasury market. Domestic balance sheet capacity is limited. As the Fed continues its quantitative tightening program, there is no buyer of last resort. If the 10-year yield continues to rise, investors could see negative side effects, such as wider junk bond, rising mortgage spreads, which increases housing stress, lower Treasury market liquidity0 and rising pressure on high-duration (high interest-rate sensitivity) growth stocks.
Questions About the Economy
From an economic perspective, investors also need to ask how individuals and corporations are likely to react to the news of the trade détente.

Questions for Investors
Lastly, how will investors alter their long-term allocations in reaction to the increased uncertainty?
In the long run, the valuation of stocks depends on how earnings evolve and the multiple the market puts on forecasted earnings. Prior to the trade détente announcement, the S&P 500 bottom-up estimate revisions were stalling. The top-down forecast from the Budget Lab is calling for a -0.7% hit to 2025 GDP growth. Management is unlikely to undergo significant expansion plans under the current conditions of uncertainty, which will create drags on employment growth.

As for the question about earnings multiples, the market P/E depends on two factors: the level of interest rates and the risk premium investors put on stocks, or the equity risk premium. I have documented how inflation expectations staged an upside breakout even before the trade announcement, and continues to rise, which puts upward pressure on the 10-year Treasury yield. Notwithstanding the evolution in trade policy, I would watch for how the Republican tax bill progresses through Congress, and how anxiety over the $9 trillion in Treasury debt rollover in 2025 and additional financing needs puts pressure on bond yields.

Under the circumstances, the natural reaction is to diversify away from U.S. assets. U.S. stocks have been a one-way bet since the GFC and the NASDAQ has outperformed the global equities since the 2008 market bottom. If Trump continues to try and de-couple from the rest of the world, the diversification trend should continue. The latest BoA Global Fund Manager Survey shows that global managers are already underweight U.S. stocks (annotations in red are mine). Is this the start of a trend or just a hiccup?

A Wide Trading Range
Where does this leave us?
The news out of the meeting in Geneva underlines an important point about the latest market tantrum and recovery. It was all attributable to U.S. policy that depends on the whims of one man, whose opinions can be unpredictable.

President Donald Trump said he would set tariff rates for U.S. trading partners “over the next two to three weeks,” saying his administration lacks the capacity to negotiate deals with all of its trading partners.
Trump said Friday that Treasury Secretary Scott Bessent and Commerce Secretary Howard Lutnick “will be sending letters out essentially telling people ”what “they’ll be paying to do business in the United States.”

Even more worrisome is the strength of the 30-year Treasury yield, which exceeds the strength of the 10-year. Moody’s announced Friday that it is downgrading U.S. debt from Aaa to Aa1. Is the Fed losing control of the bond market at the long end of the yield curve?


In conclusion, the prospect of a Sino-American trade détente has taken recession risk off the table. The S&P 500 is on course to recover from a bear market, but faces headwinds from policy unpredictability. Investors should position in a diversified portfolio of global assets and gradually diversify away from USD exposure.
From Fear to Greed

Bullish Momentum

MarketWatch reported that Bespoke found that the VIX Index fell from 40 to 20 in record time, which is another sign of strong and sustained price momentum.

A Pause Ahead?


A Sector and Factor Review of Market Internals


- Ultimate market timing model: Buy equities (Last changed from “sell” on 28-Jul-2023)
- Trend Model signal: Bearish (Last changed from “neutral” on 11-Apr-2025)
- Trading model: Neutral (Last changed from “bullish” on 14-Apr-2025)
Update schedule: I generally update model readings on my site on weekends. I am also on X/Twitter at @humblestudent and on BlueSky at @humblestudent.bsky.social. Subscribers receive real-time alerts of trading model changes, and a hypothetical trading record of those email alerts is shown here.
Subscribers can access the latest signal in real time here.
A Leadership Review
The recovery of the S&P 500 off the “Liberation Day” downdraft seems to be stalling just below the 200 dma. A review of value and growth leadership shows that the rebound was led by growth stocks, both on a global basis and across all market cap bands.

Does that mean the rally is vulnerable to a setback in growth names? I review the character of market leadership to answer that question.
A Sector Review
The accompanying chart shows the relative performance of growth sectors. Leadership among growth stocks was narrow, as only technology led the way. Communication services and consumer discretionary stocks traded sideways with the S&P 500 during the rally. To be sure, the technology sector was the largest sector within the S&P 500 at a weight of 30%, which form the principal basis for the rebound.

An analysis of the relative performance of value sectors, which tend to be more cyclically sensitive, shows sustained strength by financial and industrial stocks. I interpret that as constructive for the bull case.

Before the bulls become overly excited, the relative performance of cyclically sensitive industries are flat to down. This represents a market warning about the economic outlook.

As well, the relative performance of defensive sectors is a mixed bag. Healthcare is rolling over and real estate is trading sideways with the S&P 500. On the other hand, consumer staples and utilities are in relative uptrends. I interpret this as a sign that the bulls and bears are still battling for control of the tape.

A Holding Pattern
Where does that leave us?
In the short run, the U.S. equity market is in a holding pattern. The bulls will point to the buying pressure from hedge funds and trading desks which were forced out of their positions during the recent market downdraft.

The growth/value recovery can be explained by the recovery of the price momentum factor (fast money) against quality (patient money). The rally can continue as long as volatility, which includes upside volatility, stays tame and stocks are in a bull trend. One key test of the bull is whether the S&P 500 can convincingly break above the 200 dma.

On the other hand, a review of Trump factors shows heightened anxiety over his policies. The trade war factor is in retreat, but it’s still in an uptrend. The inflation expectations factor is staging an upside breakout. The combination of market response to the trade war and inflation expectations factors reflects heightened concerns about stagflation. In addition, combination of the bond market confidence factor and the “sell America” factor is signaling growing anxiety about the U.S. global geopolitical and financial leadership. These are all intermediate warning signs about the health of the U.S. economy and USD assets.

Why the Detox Isn’t Over

Here are some historical lessons from past fear spikes.
A COVID Under-Reaction
The VIX Spike in 2024 was obviously an over-reaction. Investor psychology was so fearful that they signaled end-of-world conditions, which was nothing resembling reality. In hindsight, the underpinnings of a market bottom was obvious.

Looking forward, I pointed to analysis from Bridgewater which distinguishes between market expectations, market psychology and actual likely events: “we want to pay attention to what’s actually happening, what people believe is happening that is reflected in pricing (relative to what’s likely), and what indicators that will indicate the reversal.”

A Bear Stearns Under-Reaction
It was a similar story in 2008. When Bear Stearns failed in March 2008, the stock market rallied in reaction to that event. The market expected things to return to normal. Market expectations of the Fed Funds rate, as measured by the 2-year Treasury yield, rose. M2 money supply growth fell, indicating no monetary stimulus.

History Rhyming in 2025
It is said that history doesn’t repeat itself but rhymes. Here is how it’s rhyming in 2025.

These sets of outlooks are set-ups for disappointment.

All else being equal, higher volatility and uncertainty argues for a lower forward P/E than the current multiple of 20.5, which is above the 5-year average of 19.9 and 10-year average of 18.3.

As well, numerous surveys of soft data are badly deteriorating. Analysis from Goldman Sachs points out that it’s not unusual for the hard data to lag soft data. In that case, the market may be in that interim period analogous to the post-Bear Stearns bankruptcy and market recovery, and the February 2020 market recovery when the coronavirus was known, but investors hadn’t fully realized the magnitude of the effect.

Investors are already hearing widespread reports of cratering import volumes from China. This will be followed by port layoffs, first on the west coast, followed by east coast ports owing to the longer shipping times from China. The logistics and trucking industries will suffer. The relative performance of transportation stocks is signaling some anxiety, though it recovered late last week in the wake of the UK trade deal and the news of the weekend China trade talks.

By late May or early June, American consumers will start to see empty shelves and shortages. So far, the relative performance of retailing stocks isn’t an excessive sign of worry.


In addition, Fed Chair Powell warned in his post-FOMC press conference, “If the large increases in tariffs are sustained, they’re likely to generate a rise in inflation and an increase in unemployment.” This pushes the U.S. economy into a stagflation scenario of rising prices and slow growth, which will be unfriendly to equity prices.

Undiscounted Risks
Putting it all together, the closest market templates to today’s market are the false dawn market rallies after the Bear Stearns bankruptcy in 2008 and the February 2020 false dawn rally after the stories of the coronavirus pandemic emerged in China, which the market knew but fully discounted the risks.
For me, it’s pretty clear. You have Trump who’s locked in on tariffs. You have the Fed who’s locked in on not cutting rates. That’s not good for the stock market…We’ll probably go down to new lows, even when Trump dials back China to 50%.
Jones expects a mild recession in the U.S., which will be equity bearish.
“He’ll dial [the tariffs] back to 50% or 40%, whatever. Even when he does that … it’d be the largest tax increases since the ’60s,” Jones said. “So you can kind of take 2%, 3% off growth.”
As a contrast to Paul Tudor Jones’ top-down perspective, the WSJ published an article profiling the warnings from Ryan Petersen, the CEO of logistics company Flexport, entitled “The CEO Who Says an Asteroid Is Coming to Destroy America’s Businesses” [emphasis added]:
If they don’t change the tariffs, it’s going to be an extinction-level, asteroid-wiping-out-the-dinosaurs kind of event…Only these aren’t dinosaurs. These are dynamic, healthy businesses.
America’s biggest and most powerful businesses have armies of lobbyists and CEOs who dine with the president. Even for them, tariffs are disruptive. But for America’s small businesses, they could be destructive.
Through no fault of their own, he explains, their business models have broken. They can’t afford the latest tariffs on Chinese goods. But Vietnam’s factories won’t bother with their production jobs, so they also can’t move their manufacturing out of China. “If they could,” Petersen said, “they would have.” Meanwhile, there is too much in flux to figure out what they should do. And if they haven’t moved their supply chains already, there’s no point in moving them yet. “It’s either too late or too early,” Petersen said.

I expect either a severe growth scare or recession in late 2025, which has not been discounted by the markets. While 2025 recession odds have retreated in the betting markets, the probability of a recession is roughly a coin flip.

The Eyes of the Beholder

Bull Case


Bear case
inflation have risen.”

An early sign of the effects of shortages and inflation pressures can be seen in used car prices as tariff rates hit auto production. The Manheim Used Vehicle Value Index, which rose 4.9% from a year ago.


whether tariff-induced inflation is temporary would come relatively
quickly
Expected passthrough rates were substantial, with half of manufacturers projecting a complete passthrough, mostly without lags. One manufacturer shortened the duration of its price quotes to 30 days in anticipation of the need to adjust prices rapidly (Boston Fed, emphasis added).Several firms said that they recently raised their prices because their costs had increased as a result of tariffs. Many firms said that they were receiving letters from suppliers and sending letters to their customers warning that prices could increase in the near future due to tariffs. Several businesses said that until they had a better idea of how tariffs might impact them, they were minimizing new investments and planning for various cost scenarios. (Richmond Fed.)

In the absence of tariffs, the Fed would be cutting today, but much depends on the Fed’s reaction function to the inflation threat. Reading between the lines from Powell’s responses at the press conference, my impression is the Fed will take months to react and the pace of rate cuts will be slower than the market expects.

Trust the Thrust, or Sell in May?

- Ultimate market timing model: Buy equities (Last changed from “sell” on 28-Jul-2023)
- Trend Model signal: Bearish (Last changed from “neutral” on 11-Apr-2025)
- Trading model: Neutral (Last changed from “bullish” on 14-Apr-2025)
Update schedule: I generally update model readings on my site on weekends. I am also on X/Twitter at @humblestudent and on BlueSky at @humblestudent.bsky.social. Subscribers receive real-time alerts of trading model changes, and a hypothetical trading record of those email alerts is shown here.
Subscribers can access the latest signal in real time here.
Buy and Sell Signals
The S&P 500 made an impressive recovery off the trade war panic sell-off. The market regained the 50 dma and it stands above “Liberation Day” levels, though the index is overbought and it is encountering a zone of resistance.

Along with the market recovery, I am seeing a resurgence of momentum-driven buy signals, or at least constructive signs for stock prices. Against that, the stock market is also facing a number of bearish headwinds, such as the “Sell in May” negative seasonality influence.
The Bull Case
Here are the bull cases. The market recently flashed a rare Zweig Breadth Thrust buy signal. The historical experience of post-World War II ZBT buy signals has shown a 100% positivity rate on a 6- and 12-month horizon.

I have voiced my concerns about the latest ZBT signal last week and won’t extensively repeat them (see 4 Reasons to be Cautious About the ZBT Buy Signal). Suffice it to say that past ZBT buy signals were accompanied by strong fiscal or monetary tailwinds, which is not in evidence today.
As well, SentimenTrader highlighte00d a high yield bond breadth thrust with bullish implication.

Finally, the S&P 500 Advance-Decline Line staged an upside breakout to an all-time high in the latest rally. That said, the A-D Lines of other indices worsen the further you go down market cap bands, which is still an ongoing concern.

The Bear Case
Here is the bear case for equities.
The Wall Street adage of “sell in May and go away” has been endlessly dissected for its seasonal effects and found lacking. However, Callum Thomas found that the conditional seasonality when the S&P 500 is below its 200 dma shows weakness during the “sell in May” period.

The SentimenTrader analysis of the high yield breadth thrust also has its own flaws. I analyzed the return spread of high yield bonds against their equivalent-duration Treasury prices and found that the latest price action exhibited a minor negative divergence. The “breadth thrust” observed was likely attributable to changes in Treasury prices, rather than any effect from high yield bonds.

A review of the relative performance of defensive sectors shows that of the four sectors, two are in relative uptrends, one has rolled over and one is consolidating sideways. This is not conclusive evidence that the bulls have decisively seized control of the tape, breadth thrust or no breadth thrust.


As well, stock prices will have to contend with a headwind of declining banking system liquidity, which is exhibiting a negative divergence against the S&P 500.

The Case for Caution
Looking forward, the macro and fundamental reasons for the “Liberation Day” downdraft haven’t gone away. Expect market risk to be elevated, which is another reason for caution. The accompanying chart shows the evolution of risk during Trump 1.0. Perceived risk, as measured by the VIX Index and the term structure of the VIX, was benign in his first year because his main policy was on the enactment of investor friendly tax cuts; 2018 ushered in the era of the trade war, and risk levels became elevated. Risk spiked in 2020, but that was attributable to the economic shock of COVID-19.

Until trade frictions are credibly resolved, I expect risk levels to stay elevated for the foreseeable future, which is not conducive to a bullish renewal. The message from the market is “policy induced volatility is not over”.

Trade tensions are unlikely to be resolved soon. A Financial Times article outlined the reaction of some institutional investors to CEA Chair Stephen Miran after a meeting at the White House:
Some participants found Friday’s meeting counter-productive0 with an audience that knows a lot, the talking points are taken apart pretty quickly.”

Should you be bullish or bearish? It depends on your time horizon.
A Trend Model update: Still cautious
- 1 year: Model 9.5% vs. 60/40 8.7%
- 2 years: Model 13.3% vs. 60/40 11.4%
- 3 years: Model 9.6% vs. 60/40 7.7%
- 5 years: Model 10.9% vs. 60/40 9.0%

Trend Asset Allocation Explained
The philosophy of trend-following investing is simple. Use a long-dated moving average to establish the trend and a short-dated moving average for risk control. These classes of models tend to identify macro-economic trends which are persistent. Applied properly and with the proper risk controls, an investor using such an approach should be able to achieve superior returns.
With that preface, let’s take a quick tour around the world to see what the model is telling us now.
A Tour Around the World
Starting in the U.S., the S&P 500 is recovering after a downdraft. It is testing the 50 dma from below and remains under the 200 dma.
Rank the U.S. as neutral to negative based on the speed of the recovery. If prices were to stabilize at these levels, it would be raised to a neutral reading.

Across the Atlantic, European stocks are exhibiting a similar pattern of pullback and recovery (all indices are shown in local currency). While European trends paralleled U.S. ones, the magnitude of the decline was less. Rank Europe as neutral.

It’s a different story in Asia. I tend to discount the Chinese stock market as it doesn’t reflect the Chinese economy. I instead rely on the behaviour of other Asian markets as signals of the Asian trade bloc. Most Asian markets are trading below their 50 dma. Call this a negative.

As China is a voracious consumer of commodities, commodity price signals are important indicators of the health of the Chinese economy and the global economic cycle. Global commodity prices are weak. In particular, the cyclically sensitive copper/gold and the more broadly diversified base metals/gold ratios are not showing any signs of life.

In conclusion, my quick tour around the world shows that the main components of my trend-following models are either weak or neutral. Putting it all together, this calls for a risk-off defensive posture to portfolio construction.


A ZBT buy signal update

A ZBT Re-examination


Here is 2004-2013.

Here are the rest, going back to World War II.

Recession Risk rising

The WSJ reported that JPM CEO Jamie Dimon said that a mild recession was his best case scenario:
Trade negotiations were top of mind at the International Monetary Fund meetings in Washington last week. In a closed-door talk hosted by JPMorgan Chase in front of over 500 investors, Treasury Secretary Scott Bessent said that he expects negotiations with China will take between two to three years and that the goal wasn’t to decouple the two economies, people who attended the talk said.JPMorgan CEO Jamie Dimon addressed the crowd afterward, and said he believes the best case outcome from the trade war would be a mild recession for the U.S. economy.

4 reasons to be cautious about the ZBT buy signal


- Ultimate market timing model: Buy equities (Last changed from “sell” on 28-Jul-2023)
- Trend Model signal: Bearish (Last changed from “neutral” on 11-Apr-2025)
- Trading model: Neutral (Last changed from “bullish” on 14-Apr-2025)
Update schedule: I generally update model readings on my site on weekends. I am also on X/Twitter at @humblestudent and on BlueSky at @humblestudent.bsky.social. Subscribers receive real-time alerts of trading model changes, and a hypothetical trading record of those email alerts is shown here.
Subscribers can access the latest signal in real time here.
A ZBT Buy Signal

High Volatility = Bear Market
The market is exhibiting a series of high-volatility events that have the fingerprints of a bear market.

The S&P 500 achieved the fourth-highest realized volatility in the last 75 years. Whether the price volatility is to the upside or downside, such conditions are not signals of a healthy bull.

Even though the VIX Index has fallen below 30, which is a sign of normalization, the term structure of the VIX is still inverted, which indicates elevated levels of market anxiety.

High Uncertainty
Arguably, the ZBT buy signal could be a sign of an all-clear. Market conditions and psychology have deteriorated so much that they have nowhere to go but up. But I struggle with that thesis as uncertainty remains extremely elevated and I see few signs of relief for macro and fundamental conditions on the horizon.

As a reminder, uncertainty in the business environment retards capital spending and hiring plans, which leads to slower growth.
In the meantime, earnings estimates are weakening as Q1 earnings season progresses. Amidst all of the uncertainty, some companies have responded by withdrawing guidance. These figures are troubling inasmuch as forward P/E valuations are elevated.

In the past, market crises such as the 1987 stock market crash, LTCM blowup, GFC and COVID Crash were met with a fiscal or monetary response, or both. This time, the crisis was inflicted by policy and the prospect of the deployment a fiscal or monetary safety net is slim.
Funding cuts from the USDA were highlighted as particularly impactful regarding services for seniors. Specifically, one pantry reported cutting back the amount of food they can give from three to five days of shelf stable food to two days of food every 30 days due to funding cuts. Pantries also expressed heightened funding uncertainty across government, corporations, and individuals and uncertainty about food price pressures.
In the end, stock prices depend on the earnings outlook and its P/E multiple. The best-case scenario I can envisage is a rollback of tariffs to a uniform rate of 5% to 10% above levels before “Liberation Day”. Supply chain disruptions and elevated tariffs causes a growth slowdown, but no recession. The Fed response by cutting rates in Q3 or Q4. Congress passes a package tax and spending cuts that’s at best fiscally neutral. S&P 500 forward earnings stay relatively stable, but the forward P/E compresses from 19.8 today to about 16 because of uncertainty, which translates to a downside potential of -15% to -20%.
Hard and Soft Data Convergence
Investors have been puzzled recently by the divergence in the weakness of the soft sentiment data and the resilience of the hard activity data. The divergence can be partly explained by the anticipation of weakness, or at least uncertainty, that’s reflected in the survey data, and front-running tariff spending that pulls purchases ahead from future months in the hard activity data.

The soft and hard data is about to converge. Molson Hart explained in a recent Twitter/X post of how supply chain bottlenecks are about to appear:
Around April 10th China to USA trade shut down. It takes ~30 days for containers to go from China to LA. 45 to Houston by sea, 45 to Chicago by train. 55 to New York by sea. That means that there are no economic effects of what was done on April 10th until about May 10th.
Around that time (it’s already started to happen) trucking work is going to dry up. Warehouses will start doing layoffs because no labor is needed to unload containers and some products will be out of stock, reducing the need for shipping labor.
All this will start in the Los Angeles area. After about 2 weeks, it’ll start hitting Chicago and Houston. Already, shipping volumes from China to the U.S. are collapsing. The wheels are already set into motion.
The public will start to see COVID-style supply shortages in the May–June time frame all over the U.S.

None of these problems can be magically wiped away by the promise of trade negotiations, which China has denied are under way, or even a trade deal, which will take months to negotiate.
It’s therefore no surprise that my Trump factors are all rising, indicating high risk levels. The trade war factor has been in a steady uptrend. Inflation expectations have staged an upside breakout but pulled back below to test the breakout level. The relative performance of foreign sovereign bonds to 7–10-year Treasuries have also broken out, indicating a loss of confidence in the USD and Treasuries as safe-haven assets.

Sell in May?
Here’s another historical study to consider. Wayne Whaley observed that a negative stock market performance in April, which currently stands at -1.5%, tends to resolve in subpar returns for the rest of the year.

This leads to the conditional study of “sell in May” conducted by Callum Thomas of Topdown Charts. He found that while the adage “sell in May and go away” had limited utility, it’s far more useful during bear markets.

What about the bullish implications of the Zweig Breadth Thrust? I attribute the buying stampede to a short-covering and beta-chasing rally by hedge funds, which were stopped out of their equity positions in the recent risk-off episode as they normalized their positions.

There is also more negative news from a fund flows and positioning perspective. Harvard and Yale universities have announced that they are liquidating portions of their private equity portfolios in order to fund their operations. The forced sale of illiquid assets will undoubtedly depress private equity valuations and possibly put downward pressure on public equity markets. The most likely effect would be seen in small-cap stocks, which have already been lagging the S&P 500 since late 2024.

An American Emerging Market crisis?

Had the panic not been stemmed, it was starting to look like a classic emerging market crisis.
Foreigners Are Selling
Various explanations had been advanced for the unusual episode, such as a blow-up in the basis trade, which is a highly levered arbitrage strategy between the cash Treasury bond and the futures market, and Chinese selling. Neither proved to be satisfactory.
The same week, Japanese investors were buying foreign equities and funds. In other words, they were dumping foreign bonds and buying foreign stocks.

What equity market did the funds go? It wasn’t into the U.S. The latest BoA Global Fund Manager Survey showed a stampede out of U.S. equities.

The data shows that Japanese investors were large sellers of foreign long-dated debt, which was mostly USD paper, and accumulating large foreign equities. In effect, they were shorting the USD by taking on USD-denominated liabilities while acquiring non-U.S. equity assets.
It was the U.S. capital flight trade. U.S. stocks, bonds and the USD weakened, while gold rallied to an all-time high. The pattern is new to the U.S. but familiar in emerging markets that are becoming submerging markets. The WSJ succinctly summarized the panic with the headline “Dow Headed for Worst April Since 1932 as Investors Send ‘No Confidence’ Signal”.

A Stampede into Gold
The rush out of the USD can be seen in the surge in gold prices, which reached all-time highs in all major currencies, including the Swiss franc, which is regarded as a “hard currency”.

Most notably, China has been accumulating gold in its reserves.

The Fever Breaks
I have been bullish on gold (see 2025 High Conviction Idea: Gold), but the latest buying frenzy seems to be too much and too fast. If we use gold as a real-time proxy for USD sentiment, a reversal was overdue.
From a sentiment perspective, investors finally caught on to the strength in the shiny metal and fund flows have gone parabolic.

Gold prices are highly extended from a technical perspective and due for a pullback.

The reversal occurred last week when the gold ETF traced out a bearish outside reversal on high volume, which is a signal of a downside reversal.

The fever has broken, and if the inverse relationship between gold and the USD continues, the USD panic is over in the short run. The pullback in gold isn’t surprising, as we are approaching a period of negative seasonality. From a technical perspective, it’s perfectly reasonable to expect some sideways consolidation in the coming weeks before prices resume their bull trend.

The Prognosis
What’s the longer-term prognosis for the USD?

That said, much of the future trajectory of the USD and global economy depends on the U.S. appetite for currency depreciation and its trade war. Should foreigners lose confidence in USD assets, the Fed could step in and become the bond buyer of last resort. Such a policy would have two important implications. First, a falling USD translates into higher inflation as import prices rise. As well, Fed intervention would likely resolve in a steeper yield curve as short rates fall from Fed intervention while long rates rise as investors demand a higher premium for holding long-dated paper.

Torston Slok at Apollo pointed out that it takes an average of 18 months to hammer out a trade agreement because of the complex issues involved. Trump’s timeline of agreements with 90 countries in 90 days is simply unrealistic and prone to disappointment. Slok stated in an CNBC interview that in the absence of a change in policy, the probability of a recession is 90%.

Treasury Sectary Bessent told a closed-door meeting of investors that the China tariff stand-off was unsustainable and both sides needed to de-escalate. The WSJ reported last week that Trump is considering halving the tariffs on China to de-escalate the trade0 war. While the markets welcomed this news with a relief rally, it nevertheless puts the U.S. in a worse negotiating position. It’s still burdened with a historically high effective tariff rate, reduced negotiating leverage, along with the prospect of stagflation and escalating inflationary expectations.
Sounding the all-clear, but for how long?

The bull case

Goldman Sachs prime brokerage reported that systematic hedge funds had cut U.S. equity exposure to levels not seen since the COVID Crash. A market rally is likely to set of a short-covering stampede that could propel prices substantially higher.


A bear market rally
early June to early August”.

Three factors are driving the stock market’s price action right now:
- Normal macro data and earnings report news
- Trade war news
- Anxiety about the stability of the USD
While the relief rally was sparked by “not as bad as the market expected” trade war news and Trump’s statement about he isn’t seeking to fire the Fed chair, the economy isn’t out of the woods just yet. The economic pain from Trump’s tariffs will be felt soon on Main Street. Shipping volumes are plunging and supply shortages will be evident by May and June. It was only about a month ago that a Pittsburgh-based Howmet Aerospace, a key supplier to Airbus and Boeing, declared force majeure on its contracts owing to the new tariff regime (see Force Majeure).

Jurrien Timmer at Fidelity offered a even darker short-term path by comparing the current trajectory of the S&P 500 to 1998 LTCM Crisis. In 1998, the market reached an initial low, rallied to the breakdown level and weakened soon afterwards to re-test the old low.

If history were to follow the 1998 template, watch to see if the S&P 500 can breach resistance at the 50% retracement resistance of 5500. As well, watch global fund flows to see if investors are still deserting the U.S. market. Continual selling pressure on USD assets will be a signal of a short-lived relief rally.
