- Ultimate market timing model: Buy equities (Last changed from “sell” on 28-Jul-2023)
- Trend Model signal: Neutral (Last changed from “bullish” on 15-Nov-2024)
- Trading model: Bullish (Last changed from “neutral” on 19-Dec-2024)
Update schedule: I generally update model readings on my site on weekends. I am also on X/Twitter at @humblestudent and on BlueSky at @humblestudent.bsky.social. Subscribers receive real-time alerts of trading model changes, and a hypothetical trading record of those email alerts is shown here.
Subscribers can access the latest signal in real time here.
Santa has left for the year…
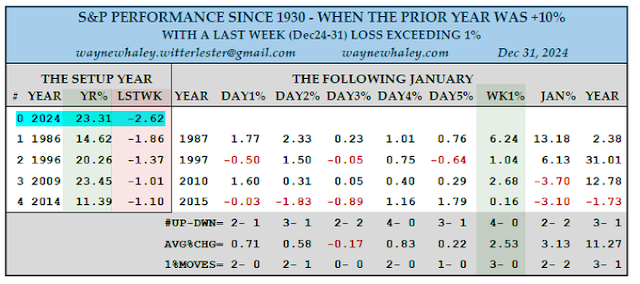
As I pointed out last week, the Santa Claus rally window is the last four days of the year and the first two days of the new year, and it’s one of the seasonally bullish periods of the year. History shows that a failed Santa rally often leads to subpar returns for the remainder of the year. The first day of the window was December 24 and the last day was January 3.
If adage about the Santa Claus rally is to be believed, the odds favour a subpar year in 2025 for the S&P 500: “If Santa should fail to call, the bears may come to Broad and Wall”.
Poised for a rebound
Before you turn overly bearish, you have to consider the short- and medium-term outlook. In the short term, the market remains highly oversold and poised for a rebound.
The latest bullish data point comes from the NAAIM Exposure Index, which measures the sentiment of RIAs who manage individual client funds. A buy signal is issued whenever NAAIM falls below the lower 26-week Bollinger Band. The latest reading shows the index within a hair of that threshold, which I interpret to be close enough for a buy signal.
This indicator has shown a near 100% historical success rate in its track record. I interpret these conditions as the path of resistance for stock prices is up, at least in the near term.
The bull’s challenge
The key to the intermediate health of the bull market is its behaviour during the anticipated rebound. Walter Deemer recently voiced concerns that current technical conditions resemble the Nifty Fifty market top in 1972. This isn’t the dot-com bubble, when most of the bubble companies had no earnings. The AI-related stocks today have earnings and exhibit strong growth, much like the Nifty Fifty.
The warning in 1972, just as today, is showing up in the form of negative breadth divergences. Advance-Decline Lines, however they are measured, are all weaker than the S&P 500.
There are, however, some rays of hope.
Another constructive sign is the positive divergence exhibited by the junk bond market. The relative performance of junk bonds to their duration-equivalent Treasuries has reached a new high, even as the S&P 500 remains below its all-time high.
In conclusion, the Santa Claus rally didn’t come for stock investors this year. Perhaps he misread the calendar and confused it with the Julian calendar of the Ukrainian and Russian Orthodox Churches, which celebrates Christmas on January 7, though Ukraine switched its Christmas to December 25 to divorce itself from Russian traditions because of the war.
- Can the S&P 500 and Russell 2000 break out through the (dotted) falling trend lines?
- How will each index behave if they reach the top of their respective trading ranges?
- Can the small cap Russell 2000 outperform, which would be a constructive sign of broadening breadth?
I would like to add a note about the disclosure of my trading account after discussions with some readers. I disclose the direction of my trading exposure to indicate any potential conflicts. I use leveraged ETFs because the account is a tax-deferred account that does not allow margin trading and my degree of exposure is a relatively small percentage of the account. It emphatically does not represent an endorsement that you should follow my use of these products to trade their own account. Leverage ETFs have a known decay problem that don’t make the suitable for anything other than short-term trading. You have to determine and be responsible for your own risk tolerance and pain thresholds. Your own mileage will and should vary.
Disclosure: Long SPXL


