Mid-week market update: The S&P 500 is stalling just below its 200 dma after becoming overbought on the 5-day RSI and the percentage of stocks above the 20 dma. What technical pattern is it tracing out? Is it a bull flag (shown by the red lines), or a bear flag (black lines).
Bullishness and bearishness are in the eyes of the beholder.
Bull Case
The short-term bull case is based on market positioning. The “Liberation Day” downdraft was exacerbated by a lot of risk managers who forced trading desks to exit their positions. Flow analysis shows that hedge funds sold in size and their equity exposure is extremely low by historical standards. On the other hand, retail investors went all-in and bought the dip, which could be interpreted as contrarian bearish.
In the short run, hedge funds and volatility control funds will need to normalize their risk positions by buying stocks. The re-risking of these portfolios depends on two things, a retreat in volatility which allows greater risk tolerance in VaR models, and a stable bull trend.
Already, we are seeing the VIX Index begin to normalize by falling below 30, but it hasn’t pulled back to 20 yet. The term structure of the VIX normalized from its inversion. That said, news flow and the market reaction to news flow will drive the evolution of volatility and the perception of volatility.
As an example of what to watch, yesterday’s news that Treasury Secretary Scott Bessent and Trade Representative Jamieson Greer will be meeting a Chinese delegation led by Chinese premier He Lifeng in Geneva this weekend sparked only a weak rally. In reaction, the Hang Seng Index opened up strongly overnight but ended the day up only 0.1%.
As well, investors are seeing the re-emergence of price momentum factor, which is an indirect sign that the fast money crowd is buying.
How these factors progress will be key drivers of trading desk risk appetite in the near term.
Bear case
The bear case depends on the Fed’s interpretation of the inflationary effects of tariffs. The Fed stayed on hold, which was expected, and it is taking a wait-and-see position on the effects of tariffs in the face of a weakening economy. The FOMC statement was changed to highlight the higher risk of stagflation: “The Committee…judges that the risks of higher unemployment and higher
inflation have risen.”
Supply chain warnings have been evident for several weeks. Traffic at west coast ports are expected to fall 35%.
An early sign of the effects of shortages and inflation pressures can be seen in used car prices as tariff rates hit auto production. The Manheim Used Vehicle Value Index, which rose 4.9% from a year ago.
Former Fed economist Claudia Sahm pointed out that the Fed has tools to monitor soft data to see how price increases could translate into persistent inflation so that a “wait-and-see Fed” can be a “ready-to-move Fed”. The Atlanta Fed’s
Business Inflation Expectations Survey asked how much of a hypothetical 10% and 25% cost shock businesses would pass through to their prices charged. The response was ll over the place. The distribution of pass-through of price increases was relatively flat from 20% to over 80%.
The
Beige Book gave insights on the speed of the pass-through, which appears to be relatively rapid. Sahm added that “a rapid adjustment in the level of prices would mean that the test of
whether tariff-induced inflation is temporary would come relatively
quickly
Expected passthrough rates were substantial, with half of manufacturers projecting a complete passthrough, mostly without lags. One manufacturer shortened the duration of its price quotes to 30 days in anticipation of the need to adjust prices rapidly (Boston Fed, emphasis added).Several firms said that they recently raised their prices because their costs had increased as a result of tariffs. Many firms said that they were receiving letters from suppliers and sending letters to their customers warning that prices could increase in the near future due to tariffs. Several businesses said that until they had a better idea of how tariffs might impact them, they were minimizing new investments and planning for various cost scenarios. (Richmond Fed.)
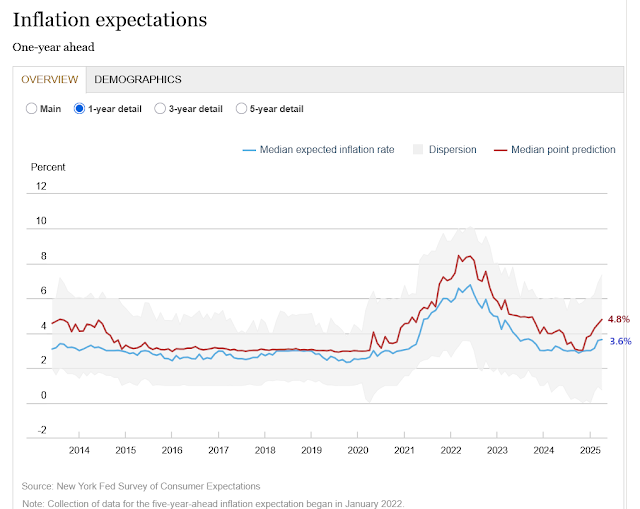
Another key question is the evolution of inflation expectations. The University of Michigan inflation expectations survey showed a spike in one-year expectations, but a much more muted increase in long-term expectations.
In the absence of tariffs, the Fed would be cutting today, but much depends on the Fed’s reaction function to the inflation threat. Reading between the lines from Powell’s responses at the press conference, my impression is the Fed will take months to react and the pace of rate cuts will be slower than the market expects.
The bulls and bears now know what to watch in the coming days and weeks. Stay tuned.
Preface: Explaining our market timing models
We maintain several market timing models, each with differing time horizons. The “
Ultimate Market Timing Model” is a long-term market timing model based on the research outlined in our post,
Building the ultimate market timing model. This model tends to generate only a handful of signals each decade.
The
Trend Asset Allocation Model is an asset allocation model that applies trend-following principles based on the inputs of global stock and commodity prices. This model has a shorter time horizon and tends to turn over about 4-6 times a year. The performance and full details of a model portfolio based on the out-of-sample signals of the Trend Model can be found
here.
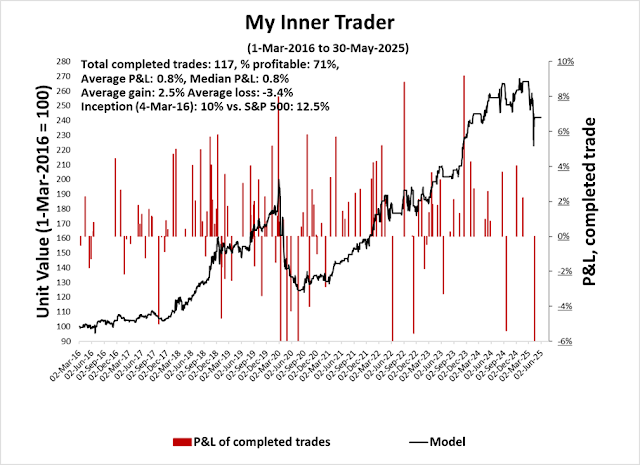
My inner trader uses a
trading model, which is a blend of price momentum (is the Trend Model becoming more bullish, or bearish?) and overbought/oversold extremes (don’t buy if the trend is overbought, and vice versa). Subscribers receive real-time alerts of model changes, and a hypothetical trading record of the email alerts is updated weekly
here. The hypothetical trading record of the trading model of the real-time alerts that began in March 2016 is shown below.
The latest signals of each model are as follows:
- Ultimate market timing model: Buy equities (Last changed from “sell” on 28-Jul-2023)
- Trend Model signal: Bearish (Last changed from “neutral” on 11-Apr-2025)
- Trading model: Neutral (Last changed from “bullish” on 14-Apr-2025)
Update schedule: I generally update model readings on my site on weekends. I am also on X/Twitter at @humblestudent and on BlueSky at @humblestudent.bsky.social. Subscribers receive real-time alerts of trading model changes, and a hypothetical trading record of those email alerts is shown here.
Subscribers can access the latest signal in real time here.
Buy and Sell Signals
The S&P 500 made an impressive recovery off the trade war panic sell-off. The market regained the 50 dma and it stands above “Liberation Day” levels, though the index is overbought and it is encountering a zone of resistance.
Along with the market recovery, I am seeing a resurgence of momentum-driven buy signals, or at least constructive signs for stock prices. Against that, the stock market is also facing a number of bearish headwinds, such as the “Sell in May” negative seasonality influence.
The Bull Case
Here are the bull cases. The market recently flashed a rare Zweig Breadth Thrust buy signal. The historical experience of post-World War II ZBT buy signals has shown a 100% positivity rate on a 6- and 12-month horizon.
I have voiced my concerns about the latest ZBT signal last week and won’t extensively repeat them (see 4 Reasons to be Cautious About the ZBT Buy Signal). Suffice it to say that past ZBT buy signals were accompanied by strong fiscal or monetary tailwinds, which is not in evidence today.
As well, SentimenTrader highlighte00d a high yield bond breadth thrust with bullish implication.
Finally, the S&P 500 Advance-Decline Line staged an upside breakout to an all-time high in the latest rally. That said, the A-D Lines of other indices worsen the further you go down market cap bands, which is still an ongoing concern.
The Bear Case
Here is the bear case for equities.
The Wall Street adage of “sell in May and go away” has been endlessly dissected for its seasonal effects and found lacking. However, Callum Thomas found that the conditional seasonality when the S&P 500 is below its 200 dma shows weakness during the “sell in May” period.
The SentimenTrader analysis of the high yield breadth thrust also has its own flaws. I analyzed the return spread of high yield bonds against their equivalent-duration Treasury prices and found that the latest price action exhibited a minor negative divergence. The “breadth thrust” observed was likely attributable to changes in Treasury prices, rather than any effect from high yield bonds.
A review of the relative performance of defensive sectors shows that of the four sectors, two are in relative uptrends, one has rolled over and one is consolidating sideways. This is not conclusive evidence that the bulls have decisively seized control of the tape, breadth thrust or no breadth thrust.
The market’s V-shaped rally doesn’t assure the resumption of a renewed bull. The percentage of S&P 500 stocks above their 200 dma has only recovered to 40% Past instances of similar recoveries have been hit-and-miss. In the last 22 years, there were eight successful rallies (in grey) compared to five unsuccessful ones (pink).
As well, stock prices will have to contend with a headwind of declining banking system liquidity, which is exhibiting a negative divergence against the S&P 500.
The Case for Caution
Looking forward, the macro and fundamental reasons for the “Liberation Day” downdraft haven’t gone away. Expect market risk to be elevated, which is another reason for caution. The accompanying chart shows the evolution of risk during Trump 1.0. Perceived risk, as measured by the VIX Index and the term structure of the VIX, was benign in his first year because his main policy was on the enactment of investor friendly tax cuts; 2018 ushered in the era of the trade war, and risk levels became elevated. Risk spiked in 2020, but that was attributable to the economic shock of COVID-19.
Until trade frictions are credibly resolved, I expect risk levels to stay elevated for the foreseeable future, which is not conducive to a bullish renewal. The message from the market is “policy induced volatility is not over”.
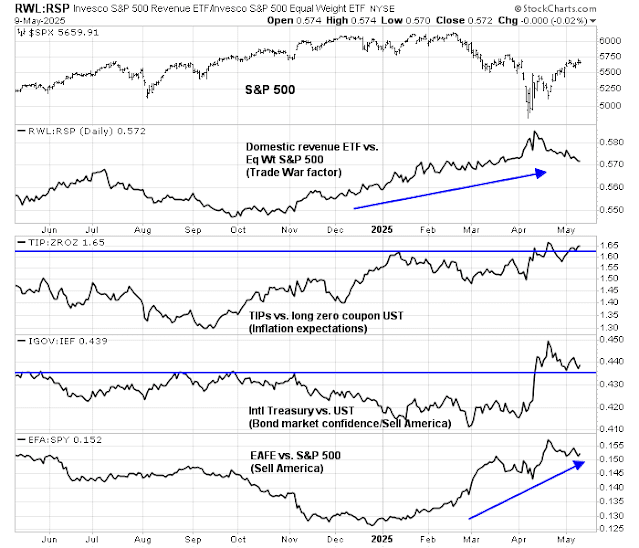
Trump factors are still trending up, which indicates a high level of anxiety that’s consistent with elevated volatility. The trade war factor is in an uptrend while exhibiting a series of higher highs and higher lows. The inflation expectations factor is flirting with an upside breakout, indicating elevated tariff-related inflation fears. Foreign sovereign debt has staged an upside breakout against Treasuries, indicating uncertain levels of confidence in USD assets.
Trade tensions are unlikely to be resolved soon. A Financial Times article outlined the reaction of some institutional investors to CEA Chair Stephen Miran after a meeting at the White House:
Some participants found Friday’s meeting counter-productive0 with an audience that knows a lot, the talking points are taken apart pretty quickly.”
As well, China is showing signs of digging in its heels on trade negotiations. Chinese official media Beijing Daily recently published an
opinion piece widely viewed as the official position titled, “Today, It is Necessary to Revisit ‘On Protracted War’”. For readers unfamiliar with Chinese history, “On Protracted War” was an essay penned by Mao Zedong outlining China’s strategy to winning the war against Japan, namely preparing for a long and arduous conflict.
In conclusion, I believe the intermediate path of equity prices is down. However, the reflex rally is a much-hated one and the short-term pain trade may be up.
Hedge funds were forced out of the market by risk managers in the latest downdraft and they are underweight risk. Signs of normalization in volatility have led to higher levels of risk tolerance from VaR models, which will whet the risk appetite of trading desks. One sign is the strength in the relative performance price momentum factors.
Should you be bullish or bearish? It depends on your time horizon.
My Trend Asset Allocation Model is a market timing model that has been running since 2013. While the model only issues buy, hold and sell signals for stocks, investors nevertheless need to make their own decisions on how much to buy and sell. Based on my out-of-sample signals, I created a model portfolio by varying the equity weight by 20% around a 60% SPY and 40% IEF benchmark. The turnover characteristics of the model portfolio is manageable, averaging 3.5 signals per year in the last five years.
The risk-adjusted returns of the model portfolio are strong. The model has beaten the 60/40 benchmark on 1, 2, 3 and 5-year time horizons, as well from inception for the period from December 31, 2013 to April 29, 2025. In addition, it was able to achieve these returns with controlled risk, equivalent to roughly an 85/15 stock/bond asset mix with 60/40 risk. As the dotted line in the chart depicting relative performance shows, the model mainly reached the superior risk-adjusted returns by sidestepping the really ugly bear markets over the study period.
- 1 year: Model 9.5% vs. 60/40 8.7%
- 2 years: Model 13.3% vs. 60/40 11.4%
- 3 years: Model 9.6% vs. 60/40 7.7%
- 5 years: Model 10.9% vs. 60/40 9.0%
Here is what it’s saying now.
Trend Asset Allocation Explained
The philosophy of trend-following investing is simple. Use a long-dated moving average to establish the trend and a short-dated moving average for risk control. These classes of models tend to identify macro-economic trends which are persistent. Applied properly and with the proper risk controls, an investor using such an approach should be able to achieve superior returns.
The Trend Asset Allocation Model is based on the application of trend-following principles to global stock markets and commodity prices. I use it to monitor the main three trade blocs, the U.S., Europe and Asia, which is mainly China, to arrive at an overall risk-on, neutral or risk-off signal for asset markets.
With that preface, let’s take a quick tour around the world to see what the model is telling us now.
A Tour Around the World
Starting in the U.S., the S&P 500 is recovering after a downdraft. It is testing the 50 dma from below and remains under the 200 dma.
Technically, the recovery above the 50 dma would be a sign of a trend change. However, trend-following models suffer from an implementation feature of possible whipsaw signals around a moving average. In practice, I would like to wait for confirmation before making a formal change of signal.
Rank the U.S. as neutral to negative based on the speed of the recovery. If prices were to stabilize at these levels, it would be raised to a neutral reading.
Across the Atlantic, European stocks are exhibiting a similar pattern of pullback and recovery (all indices are shown in local currency). While European trends paralleled U.S. ones, the magnitude of the decline was less. Rank Europe as neutral.
It’s a different story in Asia. I tend to discount the Chinese stock market as it doesn’t reflect the Chinese economy. I instead rely on the behaviour of other Asian markets as signals of the Asian trade bloc. Most Asian markets are trading below their 50 dma. Call this a negative.
As China is a voracious consumer of commodities, commodity price signals are important indicators of the health of the Chinese economy and the global economic cycle. Global commodity prices are weak. In particular, the cyclically sensitive copper/gold and the more broadly diversified base metals/gold ratios are not showing any signs of life.
In conclusion, my quick tour around the world shows that the main components of my trend-following models are either weak or neutral. Putting it all together, this calls for a risk-off defensive posture to portfolio construction.
The combination of a weakening G10 Economic Surprise Index, which measures whether economic releases are beating or missing expectations…
…and expectations of an escalating trade war is not conducive to strong equity returns.
Mid-week market update: Today’s market action has a constructive quality to it. The S&P 500 managed to stage an upside breakout through 5500 resistance and fill the price gap just above that level. The latest development saw the index pulled back to succesfully test the 5500 resistance turned support
It’s normal to see the market consolidate its gains after a ZBT. Here’s an update.
A ZBT Re-examination
I voiced my discomfort of the ZBT buy signal on the weekend. I am keeping an open mind but I remain highly concerned.
RecessionAlert argued that there was no ZBT buy signal if investors use the NYSE common stock only advance-decline data, instead of the all issue data, which contains debt and closed-end funds. The use of common stock only data is more consistent with Marty Zweig’s idea of the breadth thrust of common stocks.
Arun Chopra went further and analyzed all ZBT buy signals since World War II. Here are the S&P 500 patterns for 2011-2025.
Here are the rest, going back to World War II.
Here are my main takeaways from reading these charts. Most ZBT buy signals occurred against a period of wildly choppy market action, followed by the ZBT buy signal that was usually the final low. The period of choppy action hasn’t preceded the latest signal, which argues for a re-test of the previous low in the near future.
There are no guarantees in life or investing, re-tests of lows are not always successful. What is different this time is the lack of fiscal or monetary support for stock prices. The Republican controlled Congress is struggling to pass a tax package that’s meaningfully stimulative without blowing up the deficit. The Fed is in wait and see mode in the face of rising prices from the imposition of tariffs and it’s unlikely to cut rates in the near future.
Recession Risk rising
In the meantime, recession anxiety is rising. The odds of a recession has risen to 66% at the Polymarket betting market. Remember – recessions are bull market killers.
The WSJ reported that JPM CEO Jamie Dimon said that a mild recession was his best case scenario:
Trade negotiations were top of mind at the International Monetary Fund meetings in Washington last week. In a closed-door talk hosted by JPMorgan Chase in front of over 500 investors, Treasury Secretary Scott Bessent said that he expects negotiations with China will take between two to three years and that the goal wasn’t to decouple the two economies, people who attended the talk said.JPMorgan CEO Jamie Dimon addressed the crowd afterward, and said he believes the best case outcome from the trade war would be a mild recession for the U.S. economy.
In closing, I offer the following market analogs from
Nautilus Research for the S&P 500. While the use of market templates for future performance isn’t my favoured form of analysis, the patterns cannot be entirely ignored. Bearish outcomes outnumber bullish ones. Pick your poison.
Something unusual happened recently. During risk-off episodes, U.S. economic pain has been cushioned by falling bond yields and an appreciating USD, which translates into lower interest rates and more consumer spending power.
The risk-off episode that began in early April, which was just after the “Liberation Day” tariff announcements, saw the opposite. The price of the 10-year Treasury note fell more when denominated in all major currencies except the Chinese yuan. Foreigners were fleeing USD assets and Treasury paper, meaning the pain was amplified.
Had the panic not been stemmed, it was starting to look like a classic emerging market crisis.
Foreigners Are Selling
Various explanations had been advanced for the unusual episode, such as a blow-up in the basis trade, which is a highly levered arbitrage strategy between the cash Treasury bond and the futures market, and Chinese selling. Neither proved to be satisfactory.
It seemed that foreigners were losing confidence in the USD and Treasury assets as a safe-haven.
We have evidence of this shift from Japanese data. The
Financial Times cited data showing that Japanese investors were net sellers of $17.5 billion in foreign fixed-income securities from March 30 to April 5, with a “substantial portion” being U.S. Treasury and Agency paper, as per one rates strategist.
The same week, Japanese investors were buying foreign equities and funds. In other words, they were dumping foreign bonds and buying foreign stocks.
What equity market did the funds go? It wasn’t into the U.S. The latest BoA Global Fund Manager Survey showed a stampede out of U.S. equities.
The data shows that Japanese investors were large sellers of foreign long-dated debt, which was mostly USD paper, and accumulating large foreign equities. In effect, they were shorting the USD by taking on USD-denominated liabilities while acquiring non-U.S. equity assets.
It was the U.S. capital flight trade. U.S. stocks, bonds and the USD weakened, while gold rallied to an all-time high. The pattern is new to the U.S. but familiar in emerging markets that are becoming submerging markets. The WSJ succinctly summarized the panic with the headline “Dow Headed for Worst April Since 1932 as Investors Send ‘No Confidence’ Signal”.
The damage can be seen in factor returns. Even as the S&P 500 skidded, the trade war factor has been in a steady uptrend. Inflation expectations recently staged an upside breakout but pulled back, which combined with the strength in the trade war factor is a stagflation signal. The relative performance of non-USD sovereign bonds to the 7–10-year Treasury ETF is a sign of a loss of confidence in the USD.
A Stampede into Gold
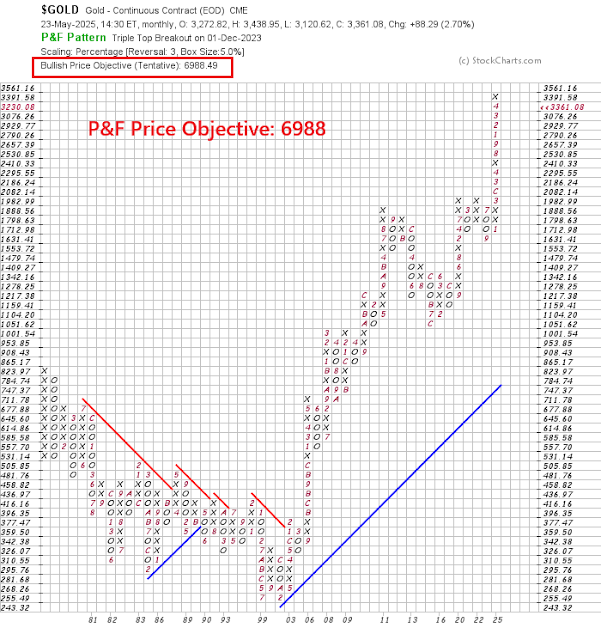
The rush out of the USD can be seen in the surge in gold prices, which reached all-time highs in all major currencies, including the Swiss franc, which is regarded as a “hard currency”.
Most notably, China has been accumulating gold in its reserves.
The Fever Breaks
I have been bullish on gold (see 2025 High Conviction Idea: Gold), but the latest buying frenzy seems to be too much and too fast. If we use gold as a real-time proxy for USD sentiment, a reversal was overdue.
From a sentiment perspective, investors finally caught on to the strength in the shiny metal and fund flows have gone parabolic.
Gold prices are highly extended from a technical perspective and due for a pullback.
The reversal occurred last week when the gold ETF traced out a bearish outside reversal on high volume, which is a signal of a downside reversal.
The fever has broken, and if the inverse relationship between gold and the USD continues, the USD panic is over in the short run. The pullback in gold isn’t surprising, as we are approaching a period of negative seasonality. From a technical perspective, it’s perfectly reasonable to expect some sideways consolidation in the coming weeks before prices resume their bull trend.
The Prognosis
What’s the longer-term prognosis for the USD?
Fears of an emerging market balance of payment crisis for the USD are overblown. While the recent panic is reminiscent of EM BoP crises, there are some important differences. A typical EM BoP crisis occurs when much of the borrowing is in foreign currency. A loss of confidence leads to a bank run on that country’s foreign currency reserves, which forces up yields to incentivize capital to stay in that country. But U.S. debt is denominated in USD, and the U.S. has an unlimited printing press to print currency.
For now, the USD remains the premier medium of exchange in international trade and there are few candidates that can replace its role as a global reserve currency. Other major currencies with sufficient liquidity are flawed in different ways. The euro is highly liquid, but the eurozone runs a current account surplus, which means that there isn’t enough euro-denominated paper sloshing around the global financial system for reserve managers to hold as the pre-eminent reserve currency. Similarly, China runs an enormous currency account surplus and suffers from the same liquidity problem. Gold bugs like to mention the metal, but liquidity is a severe constraint. If the U.S., which is one of the largest holders of gold in its official reserves, were to monetize its gold holdings at market values, it would amount to about US$900 billion, which isn’t enough to finance a single year’s fiscal deficit.

That said, much of the future trajectory of the USD and global economy depends on the U.S. appetite for currency depreciation and its trade war. Should foreigners lose confidence in USD assets, the Fed could step in and become the bond buyer of last resort. Such a policy would have two important implications. First, a falling USD translates into higher inflation as import prices rise. As well, Fed intervention would likely resolve in a steeper yield curve as short rates fall from Fed intervention while long rates rise as investors demand a higher premium for holding long-dated paper.
When combined with Trump’s high tariff rates, which puts upward pressure on domestic prices, and a potential loss of confidence in the USD, stagflation and a recession are highly likely outcomes.
Despite all the flip flops and announcements, the effective weighted average tariff rate is still very high by historical standards. Supply chain bottlenecks will start to appear by the summer months and lead to severe disruptions in both economic activity and employment.
Axios reported that the CEOs of the three biggest retailers — Walmart, Target and Home Depot — warned Trump about the consequences of his actions: “The big box CEOs flat out told him [Trump] the prices aren’t going up, they’re steady right now, but they will go up. And this wasn’t about food. But he was told that shelves will be empty.”
Torston Slok at Apollo pointed out that it takes an average of 18 months to hammer out a trade agreement because of the complex issues involved. Trump’s timeline of agreements with 90 countries in 90 days is simply unrealistic and prone to disappointment. Slok stated in an CNBC interview that in the absence of a change in policy, the probability of a recession is 90%.
Treasury Sectary Bessent told a closed-door meeting of investors that the China tariff stand-off was unsustainable and both sides needed to de-escalate. The WSJ reported last week that Trump is considering halving the tariffs on China to de-escalate the trade0 war. While the markets welcomed this news with a relief rally, it nevertheless puts the U.S. in a worse negotiating position. It’s still burdened with a historically high effective tariff rate, reduced negotiating leverage, along with the prospect of stagflation and escalating inflationary expectations.
Putting it all together, confidence in the USD and Treasury assets is being eroded. As well, the U.S. faces stagflation and elevated recession risk in the next 12–18 months. While investors usually hedge slow growth outcomes by holding USD and Treasuries, they would be better served by holding high-quality non-USD sovereign bonds and gold.
Mid-week market update: It’s time to sound the all-clear signal, as least in the short run. Both the S&P 500 and the equal-weighted S&P 500 have decisively staged upside breakouts through the falling trend line. The bulls have regained control of the tape.
The next resistance test is the 50% retracement level at about 5500. How far can the relief rally run?
The bull case
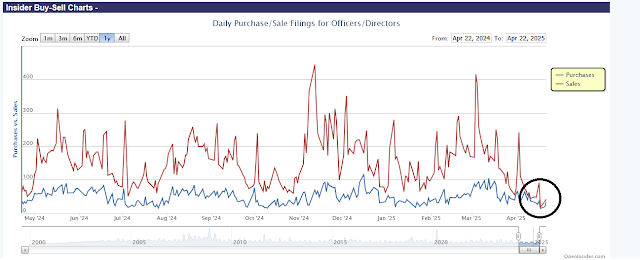
Here is the bull case. Insider activity is suggestive of a bottom. Insider buying (blue line) came within hairs of insider selling (red line) on two occasions in the recent past. While these are not always definitive signs of an intermediate bottom, they are nevertheless constructive signals.
Goldman Sachs prime brokerage reported that systematic hedge funds had cut U.S. equity exposure to levels not seen since the COVID Crash. A market rally is likely to set of a short-covering stampede that could propel prices substantially higher.
I am back on a Zweig Breadth Thrust signal watch. ZBT buy signals are extremely rare. There have only been eight signals since Marty Zweig unveiled his trading signal in the early 1980’s. Of the eight signals, they have a 100% success rate on a 6 and 12 month time frame.They require market breadth, as measured by the ZBT Indicator, to rise from oversold to overbought within 10 trading days. The 10 day window terminates on Friday.
A bear market rally
Here is the case for a bear market rally. Jeffrey Hirsch at Trader’s Almanac is calling for a bounce with the “duration of strength from around now through sometime between
early June to early August”.
Three factors are driving the stock market’s price action right now:
- Normal macro data and earnings report news
- Trade war news
- Anxiety about the stability of the USD
While the relief rally was sparked by “not as bad as the market expected” trade war news and Trump’s statement about he isn’t seeking to fire the Fed chair, the economy isn’t out of the woods just yet. The economic pain from Trump’s tariffs will be felt soon on Main Street. Shipping volumes are plunging and supply shortages will be evident by May and June. It was only about a month ago that a Pittsburgh-based Howmet Aerospace, a key supplier to Airbus and Boeing, declared force majeure on its contracts owing to the new tariff regime (see Force Majeure).
Credit spreads are widening. Though levels are not alarming just yet, when does the market re-focus its attention on the deterioration in financial conditions?
Jurrien Timmer at Fidelity offered a even darker short-term path by comparing the current trajectory of the S&P 500 to 1998 LTCM Crisis. In 1998, the market reached an initial low, rallied to the breakdown level and weakened soon afterwards to re-test the old low.
If history were to follow the 1998 template, watch to see if the S&P 500 can breach resistance at the 50% retracement resistance of 5500. As well, watch global fund flows to see if investors are still deserting the U.S. market. Continual selling pressure on USD assets will be a signal of a short-lived relief rally.
Preface: Explaining our market timing models
We maintain several market timing models, each with differing time horizons. The “
Ultimate Market Timing Model” is a long-term market timing model based on the research outlined in our post,
Building the ultimate market timing model. This model tends to generate only a handful of signals each decade.
The
Trend Asset Allocation Model is an asset allocation model that applies trend-following principles based on the inputs of global stock and commodity prices. This model has a shorter time horizon and tends to turn over about 4-6 times a year. The performance and full details of a model portfolio based on the out-of-sample signals of the Trend Model can be found
here.
My inner trader uses a
trading model, which is a blend of price momentum (is the Trend Model becoming more bullish, or bearish?) and overbought/oversold extremes (don’t buy if the trend is overbought, and vice versa). Subscribers receive real-time alerts of model changes, and a hypothetical trading record of the email alerts is updated weekly
here. The hypothetical trading record of the trading model of the real-time alerts that began in March 2016 is shown below.

The latest signals of each model are as follows:
- Ultimate market timing model: Buy equities (Last changed from “sell” on 28-Jul-2023)
- Trend Model signal: Bearish (Last changed from “neutral” on 11-Apr-2025)
- Trading model: Bullish (Last changed from “neutral” on 28-Feb-2025)
Update schedule: I generally update model readings on my site on weekends. I am also on X/Twitter at @humblestudent and on BlueSky at @humblestudent.bsky.social. Subscribers receive real-time alerts of trading model changes, and a hypothetical trading record of those email alerts is shown here.
Subscribers can access the latest signal in real time here.
Threats to the 60/40 Portfolio
The conventional asset mix of 60% equities and 40% bond is designed to maximize return and minimize volatility risk under a reasonable set of risk tolerance assumptions. The equity portion of the portfolio is meant to provide growth, while the bond portion is designed to provide portfolio stability as bond prices have low to negative correlation to stock prices. In addition, bonds have the additional benefit of a steady income and high assurance of capital preservation, or getting your money back.
What happens if the “getting your money back” assumption is shaken?
Investors saw that recently when Treasury yields rose (and Treasury prices fell) and the USD fell at the same time. The episode was interpreted as a possible end to the era of American Exceptionalism and the USD as a safe-haven asset. While we saw a similar episode in early 2018, it nevertheless underscores concerns about the 60/40 portfolio as stock bond correlations were rising in both instances. Rising correlation leads to greater portfolio volatility and a reduction in the diversification effects of the two asset classes, which can be worrisome during the current climate of elevated market stress.
What can investors do under such circumstances?
The Price of Diversification
If the market is losing confidence in the USD and Treasury assets, investors can diversify into a portfolio of non-U.S. sovereign bonds as an alternative. U.S.-based investors should consider the iShares International Treasury Bond ETF (IGOV), which is designed to track the FTSE World Government Bond Index–Developed Markets Capped (USD). Here are the characteristics of IGOV from iShares.
The characteristics of IGOV are similar to the 7–10 Year Treasury ETF (IEF). The effective duration, or interest rate sensitivity, of both are similar, though IGOV shows a much lower weighted average coupon of 2.23% compared to 3.84% for IEF.
Diversification has a price in addition to the obvious substantial reduction in average coupon rate. IGOV has underperformed IEF in the last 10 years, though its relative performance popped in the wake of the latest scare (black line, top panel). Foreign bonds provide some inflation protection against domestic bonds through the foreign exchange channel. The accompanying chart also shows the relative performance of TIPs against IEF (red dotted line). The relative performance of TIPs and IGOV were closely correlated until they diverged in mid-2021.
A U.S. investor concerned about the decline of American Exceptionalism can consider a basket of IEF and IGOV for the bond portion of his 60/40 portfolio. As IGOV has surged against IEF and looks extended on a relative basis, investors seeking to diversify their holdings should average into their IGOV positions over the next few months.
On the other hand, fears about the USD could be a head-fake. These covers of The Economist, which were published six months apart, could be the bookends of the perfect contrarian magazine cover signals.
A Cautious Outlook
Nevertheless, I believe the bond portion of a portfolio is becoming increasingly important. Consider the following mystery chart. The top panel is the S&P 500 over the past year, but what are the constructive patterns of the other panels?
Mystery revealed: They are the relative performance of defensive sectors, which (from top to bottom) is healthcare, consumer staples, utilities and real estate. The constructive patterns of relative performance of these sectors are indicative of a longer-term bear market structure of the U.S. equity market.
It’s time to be more defensive.
To be sure, sentiment models are showing substantial levels of fear.
The latest AAII sentiment survey shows another week of extreme anxiety.
An analysis of insider activity shows that insider buying (blue line) recently came within a hair of insider selling (red line). In the past, such signals have resolved in price rebounds of differing durations.
On the other hand, forward 12-month earnings estimates look wobbly as Q1 earnings reporting season begins. With only 12% of S&P 500 companies reported, the EPS and sales beat rates are below historical averages.
CNBC reported that shipping volumes to the U.S. are collapsing in the wake of the substantial increase in tariff rates. Left unchecked, this will lead to COVID-era supply chain bottlenecks in the coming months.
Earnings season begins in earnest in the coming week with Magnificent Seven Tesla and Alphabet reporting. Stay tuned.

Putting it all together, I believe that the current market trajectory will follow the script of bear market rallies of the dot-com bear of 2000, 2008 GFC bear, 2022 inflation fear bears of a substantial drop, a massive bear market rally, and a probable break to new lows. Trump’s tariffs will cause massive dislocations in the economy in the coming months. Anecdotal evidence from ports data will push CPI to an annualized 4% and beyond starting with the April report. Trump realizes this, and that’s why he lashed out at Powell last week by citing the backwards looking benign inflation backdrop. As price pressures and shortages build, it will put the Fed in a difficult position and a debate about whether it should look trough the one-time price rise. Barring significant progress on the trade war front, the higher for longer narrative and weaker economic outlook will weigh on risk appetite.
In conclusion, I interpret the combination of technical, sentiment and fundamental conditions as the stock market being ripe for a short-term relief rally, but it is at substantial risk of a much deeper downdraft as more difficult macro conditions become evident.Tactically, the market is trying to recover from a severely washed-out and oversold condition and it’s ripe for a short-term rebound. The short-term challenge for the bulls is to stage an S&P 500 upside breakout through the falling trend line (blue), followed by a breakout of the 50% Fibonacci retracement level at 5500. That said, the minor short-term positive divergence of the NYSE Advance-Decline Line is constructive for the bull case.
Ahead of the Second Gulf War, Secretary of Defense Donald Rumsfeld famously referred to “known knowns”, “known unknowns” and “unknown unknowns” when responding to a question about Iraqi weapons of mass destruction.
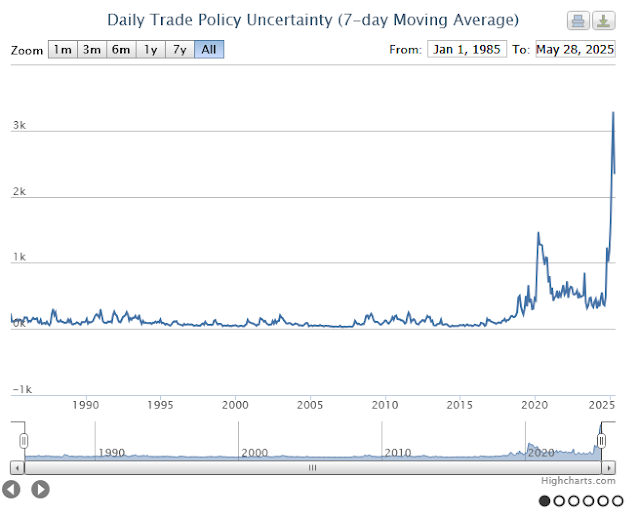
Fast forward to 2025, investors have to contend with a series of known unknowns and unknown unknowns as they consider their investment policy in an environment where global economic uncertainty has skyrocketed to an all-time high.
Here are some known unknowns to consider:
- What are the objectives of Trump’s negotiations and how far is he willing to go?
- When will the chaos subside enough that companies can plan and respond to the changes in tariff regimes?
- Will the U.S. economy fall into recession?
Here are some unknown unknowns to consider:
- Have the USD and Treasury securities permanently lost their position as safe havens?
- How much damage has been done to the post-World War II security and financial architecture?
The Negotiations Begin
The markets staged a relief rally on the news that “reciprocal tariffs” would be paused for 90 days for all countries except China and USMCA members Canada and Mexico as the U.S. negotiates with over 70 countries. Investors should expect elevated levels of volatility in light of the tight timeline. The WSJ reported that the main objective of the trade negotiations is to gather allies against China. Not only does the U.S. want to raise a tariff wall against China, the U.S. wants to prevent the diversion of Chinese exports to the U.S. through third countries.
It’s unclear whether the negotiation strategy will be successful. America’s allies are in shock over Trump’s initial moves against Canada and Mexico, his desire to annex Greenland, his tilt toward Russia in the Russo-Ukraine War, his characterization of the European Union as an organization designed to “screw us” and calling the U.S.-Japan relationship “one-sided” even as negotiations begin.
The attack on allies has produced the perverse effect of pushing them away from the U.S. and toward closer relations with China. Ursula von der Leyen, President of the European Commission, spoke with Chinese Premier Li Qiang about closer trade relations. Representatives from Japan, South Korea and China met and vowed to strengthen trade relations. Xi Jinping visited Vietnam as was warmly greeted as China and Vietnam signed over 40 trade deals.
The response shows the limitations of Trump’s negotiating style. Instead of the usual win-win negotiation tactics normally used in trade discussions, a
WSJ editorial characterized Trump’s win-lose approach creating fear to use as leverage: “Creating fear is his go-to strategy for inducing people to comply with his wishes. If threats don’t suffice, he moves against vulnerable individuals and institutions, making examples of them to terrify others into obedience.”
Such an approach doesn’t always work: “Although some smaller countries such as Vietnam are offering concessions to ward off the president’s tariffs, others — including giants such as China and Canada — have already responded with countermeasures, and the European Union also is preparing a firm response.”
In addition, recent events have revealed some of Trump’s pain points. The recent bond market tantrum forced Trump to soften his stance and seek an off ramp by rolling back and pausing “reciprocal tariffs” for 90 days. China’s ban on certain rare earth exports and its halt of Boeing aircraft deliveries will cause significant pain.
An Abysmal Outlook
As a consequence, companies are pausing their expansion and hiring plans in the face of the growing uncertainty. Blackrock CEO Larry Fink recently stated: “Most CEOs I talk to say we are probably in a recession right now. A couple of airline CEOs told me, and one CEO specifically said, ‘The airline industry is like a proverbial burden, a canary in a coal mine.’ I was told that the canary is sick already…I do believe we’re probably starting, if not already in, a recession.”
While some companies have declined to offer guidance during Q1 earnings season, it was remarkable that UAL offered guidance on its earnings report based on two scenarios, stable bookings and recession.
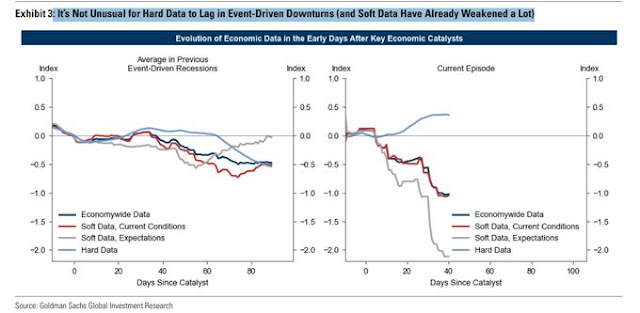
The soft survey data points to an abysmal outlook. The New York Fed’s survey of regional manufacturers show new orders at the lowest level of its entire history.
A detailed analysis of every component of the survey, such as new orders, shows that employment is going down, with the exception of prices (received, and paid) which are going up.
As Q1 earnings season begins, the Citi U.S. Earnings Revisions Index is deeply in the red.
The Recession Question
Against this backdrop of uncertainty, investors have to ponder the question of whether the U.S. economy will plunge into recession. Historically, non-recessionary bear markets tend to be shorter and experience milder drawdowns than recessionary bear markets.
I believe it’s too early to tell. Trump’s abrupt tariff announcement was an exogenous shock whose effects have yet to be fully felt by the economy. The soft survey data is plunging and the fall has the potential to create a negative feedback psychological loop. However, the hard data hasn’t meaningfully declined.
Early indications are not encouraging. The Citi U.S. Economic Surprise Index, which measures whether economic data is beating or missing expectations, resumed its decline after a brief upward reversal.
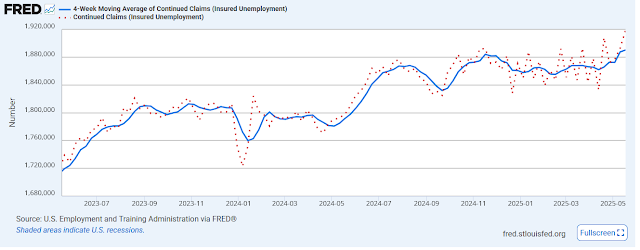
The latest University of Michigan survey of employment expectations has been weak, and readings in this survey have historically led the unemployment rate. The concerns over employment may lead to a market hyper-focus on the weekly initial jobless claims data, much in the manner the market focused on weekly money supply reports during the Volcker Fed’s tight money era of the early 1980s.
The latest BoA Global Fund Manager Survey shows that a recession is now the consensus call at 49%.
For a snapshot of the recession question, I turn to New Deal democrat, who has been monitoring the state of the economy using a series of coincident, short-leading and long-leading indicators. To make a long story short, he is relying on the hard data to make a recession call:
The long leading indicators remain neutral, despite the sharp un-inversion of parts of the yield curve, including a sharp “bear steepening” at the long end. Unless something significant changes, corporate profits are likely to tip the balance within several weeks.
The short leading indicators, which were positive only two weeks ago, are now negative, as commodities, financial stress, and gas usage have all turned negative, while stocks remain neutral despite their gyrations.
The coincident indicators remained positive, mainly because consumer spending has held up. There may be evidence of frontrunning tariffs in the sharp increase in rail traffic.
I anticipate that sharp reversals (and re-reversals) in Washington will continue to drive the news cycle. The new 40 year low in consumer confidence is very concerning, but in the past it has usually taken several quarters for that to manifest in actual consumer and producer retrenchment. As usual, the hard data will tell, and the high frequency data will tell first.
In a separate blog post, he elaborated on the weakness of the short leading indicators and why he isn’t on recession watch yet:
I would want to see some spreading out of weakness from the financial and interest rate data into the “hard” economic data before a ‘recession watch’ would be warranted.” The strength of the current hard data has been affected by consumers and companies purchases to front-run tariffs. Investors will need until the May–July time frame to assess the true picture after the pre-stocked inventory has been depleted.
The Unknown Unknowns
Finally, investors have to ponder the “unknown unknown” questions, which are:
- Have the USD and Treasury securities permanently lost their position as safe havens?
- How much damage has been done to the post-World War II security and financial architecture?
The recent bond market tantrum, which saw Treasury yields spike and a decline in the USD, was unusual inasmuch as investors have usually rushed into USD and Treasury assets as safe-haven trades during periods of market stress. The latest episode saw the opposite effect of a rush away from these assets.
What caused the bond market sell-off? A MarketWatch article reported that how Fidelity portfolio manager Mike Riddell rounded up and questioned the usual suspects:
First, he says, it’s not from inflation expectations, since those have actually declined since the 90-day pause in tariffs as well as slump in oil prices. And it’s not from expectations of higher growth, given the lurch lower in risky asset prices. It’s also not from the basis trade.
“It doesn’t mean that the unwind of these basis trades can’t cause dysfunction — if they all sell U.S. Treasuries en masse then there will likely be dislocations between individual bonds on the U.S. Treasury curve, and liquidity would be greatly impaired across individual U.S. Treasuries. But this doesn’t seem to be happening — if it was, then we’d be seeing some crazy moves in repo rates (which fund these trades), but we’re not,” he says.
There isn’t really good evidence to say it’s China, and if it were Japan, then JGBs should be enjoying a huge rally, which they are not.
That leads European investors — because of the rally in the euro as well as the move lower in German bond yields. Riddell also says emerging-market countries have may have sold down reserves — and hence, Treasurys — to prevent a disorderly depreciation of their currencies.
Riddell may be right. An analysis of the price of the 10-year Treasury note in different currencies shows pronounced weakness in every currency except for the Chinese yuan. In particular, Swiss Franc-denominated weakness may be related to a switch from Treasuries into gold, as the Swiss Franc is regarded as a hard currency and highly correlated to gold. There is no evidence of Chinese selling and fund repatriation.
The thesis of a decline in the era of American Exceptionalism is still alive. I will need to monitor how the market behaves in future risk-off episodes to make a more definitive call on this question.
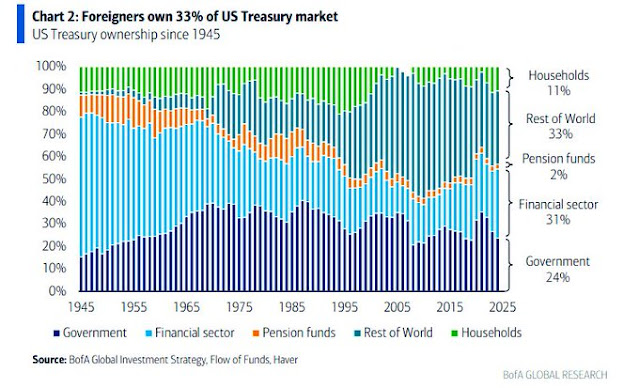
Here is why this question matters. The U.S. Treasury will have to sell about $10 trillion of Treasuries to finance its debt in 2025. Foreigners own about one-third of outstanding Treasury paper. Even a small pullback in demand has the potential to lead to much higher rates for U.S. corporations and Main Street. While the Fed could fill the gap with QE, the pressure would be felt in the exchange rate market in the form of USD weakness.
If this is indeed the end of Pax Americana and American Exceptionalism, is it a permanent regime shift? To answer that question, consider the following thought experiment. Imagine the American electorate makes an abrupt political pivot and the next President is Alexandria Ocasio-Cortez (AOC). In light of the radical break from Trumpian values, would an AOC Administration be able to repair the break with America’s allies?
Is it any wonder why there is so much uncertainty in the markets?
In conclusion, Trump’s main objective in his trade war is to erect a trade wall around China, but it’s unclear how successful he will be as his allies are wavering. The U.S. economy is weakening. At a minimum, the markets will undergo a growth scare, though an actual recession isn’t a certainty. The challenge in the long-term is the continuation of American Exceptionalism, consisting of long U.S. market leadership, long multi-nationals and a buy-the-dip mentality. The only certain outcome in the current environment is heightened volatility.

