Preface: Explaining our market timing models
We maintain several market timing models, each with differing time horizons. The “Ultimate Market Timing Model” is a long-term market timing model based on research outlined in our post Building the ultimate market timing model. This model tends to generate only a handful of signals each decade.
The Trend Model is an asset allocation model which applies trend following principles based on the inputs of global stock and commodity price. This model has a shorter time horizon and tends to turn over about 4-6 times a year. In essence, it seeks to answer the question, “Is the trend in the global economy expansion (bullish) or contraction (bearish)?”
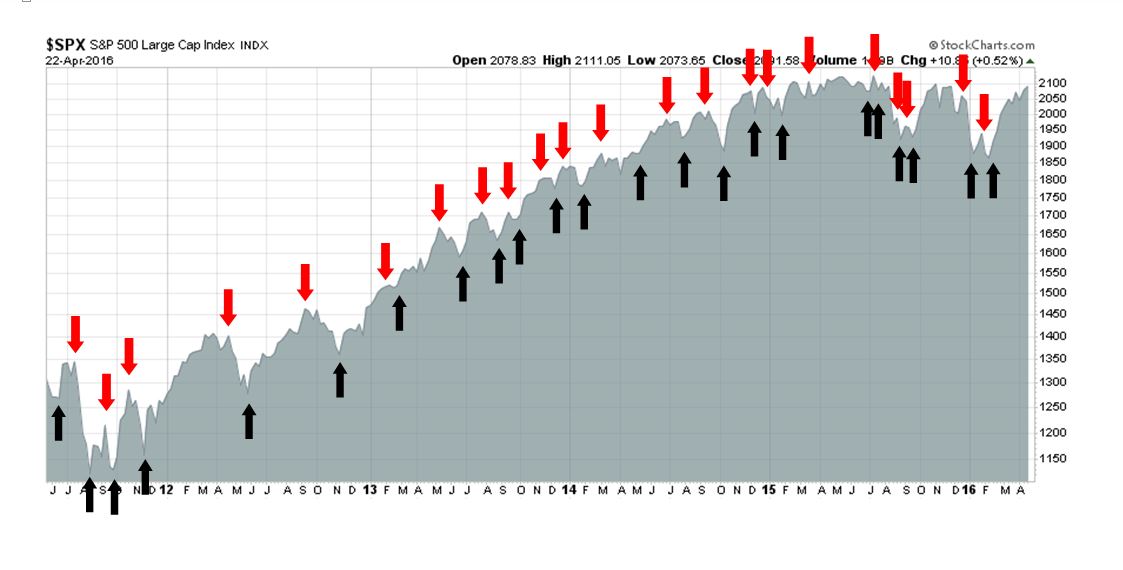
My inner trader uses the trading component of the Trend Model seeks to answer the question, “Is the trend getting better (bullish) or worse (bearish)?” The history of actual out-of-sample (not backtested) signals of the trading model are shown by the arrows in the chart below. Past trading of this model has shown turnover rates of about 200% per month.
The latest signals of each model are as follows:
- Ultimate market timing model: Buy equities
- Trend Model signal: Risk-on
- Trading model: Bullish
Update schedule: I generally update model readings on my site on weekends and tweet any changes during the week at @humblestudent. Subscribers will also receive email notices of any changes in my trading portfolio.
The (inflation) universe is unfolding
The (inflation) universe seems to be unfolding as it should. Regular readers know that I have been preparing for a resurgence in commodity prices (see The 2016 macro surprise that no one talks about, written in December 2015, RIP Correction. Reflationary resurrection next? written in March 2016 and My roadmap for 2016 and beyond, written a week ago). We finally got broad based confirmation of a recovery in commodity inflation last week.
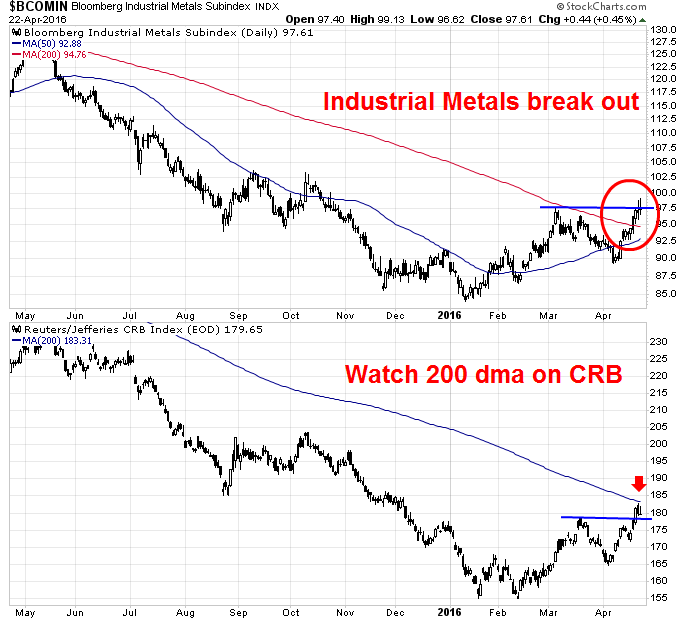
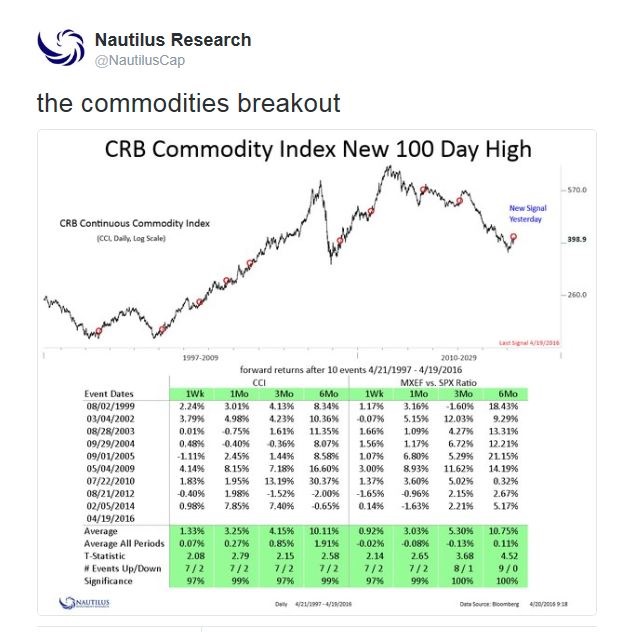
Commodity and oil prices shrugged off the Doha non-freeze surprise and broke out to new recovery highs, which is bullish as you can tell the tone of a market by how it reacts to what should have been bad news. As the chart below shows, the cyclically sensitive industrial metals staged upside breakouts above its 200 day moving average (dma), as well as new recovery highs. The energy heavy CRB Index did break out to the upside, but it is now testing its 200 dma.
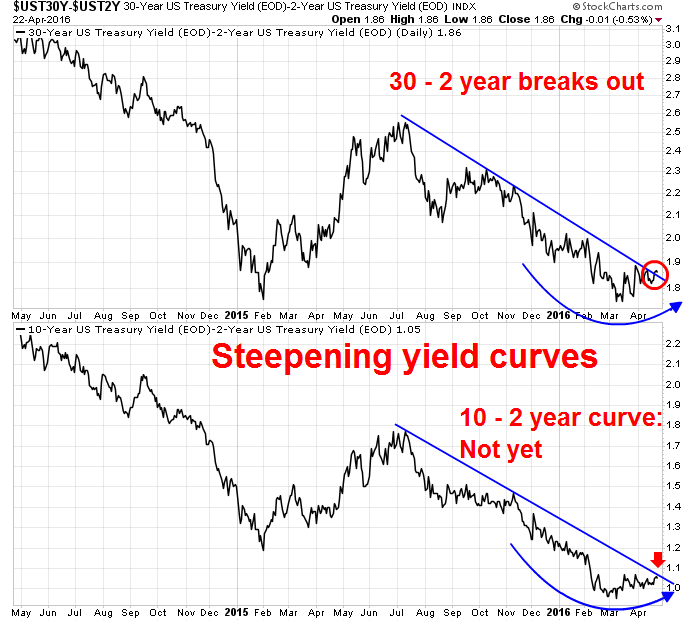
I interpret the surge in commodity prices as a sign of rising growth – and these signs are reflected in the fixed income markets as well. The crowded long position in bonds that I identified is resolving itself with a steepening yield curve (see What does the crowded long position in bonds mean for stocks?). The chart below shows that the 30 – 2 year yield curve has staged an upside breakout, though the 10 – 2 year curve has yet to break out yet.
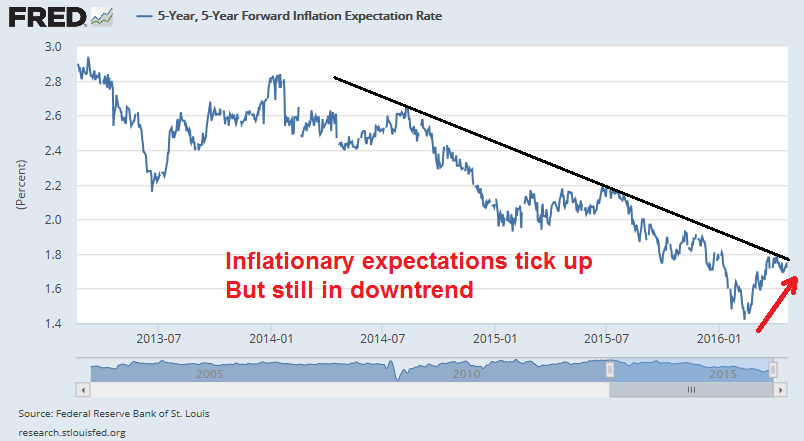
We are also seeing inflationary expectations are also ticking up in the bond market. The 5 year X 5 year forward expected inflation rate is rising, though it remains in a downtrend. The existence of the longer term downtrend is potentially important for Fed policy, as central bankers like to see some definitive confirmation of trend reversals before acting.
Thank you, China
Much of the growth revival could be attributable to stimulus that the Chinese has implemented this year (also see More signs of unbalanced Chinese growth). Callum Thomas recently documented the shift in Chinese fiscal and monetary policy towards greater growth accommodation.

He also pointed out that there are “green shoots” of a trade revival, for both China and globally.
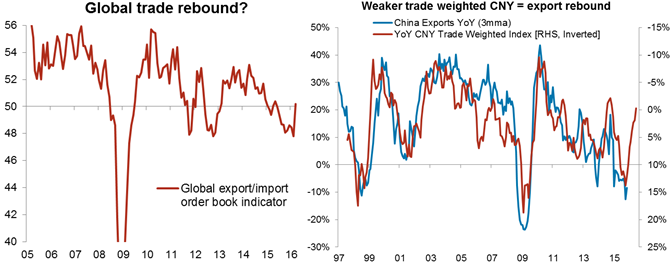
This chart from Citi shows that, as a consequence of the stimulus package, Chinese M1 has surged, and its effect on metal prices are evident.

Commodity markets may be in for a bullish surprise. Bloomberg reports that “the great ball of China money is moving away from bonds and stocks to commodities”. Speculators are piling into obscure commodities such as steel reinforcement bars, hot-rolled coils, cotton and polyvinyl chloride. We saw in the past how naive Chinese retail money, many of whom with barely high school educations, drove Chinese stocks to frenzied levels in the past. The same could happen again, but in the less liquid commodity market.

George Soros believes that China looks eerily like the US in 2007-08 as Beijing embarks on another round of credit fueled growth. No doubt this won`t end well, but that end won`t come immediately. He admitted that the bubble “may be able to feed itself for some time”. The Chinese are throwing a party, so enjoy it (but watch for the signs that the neighbors are calling the cops).
Broad based global rally
One of the key tools used by chartists and technical analysts is breadth confirmation. We are seeing broad based breadth participation in rising risk appetite at a global level and across different asset classes. I interpret these conditions to mean that we are still in the early stages of a market rally.
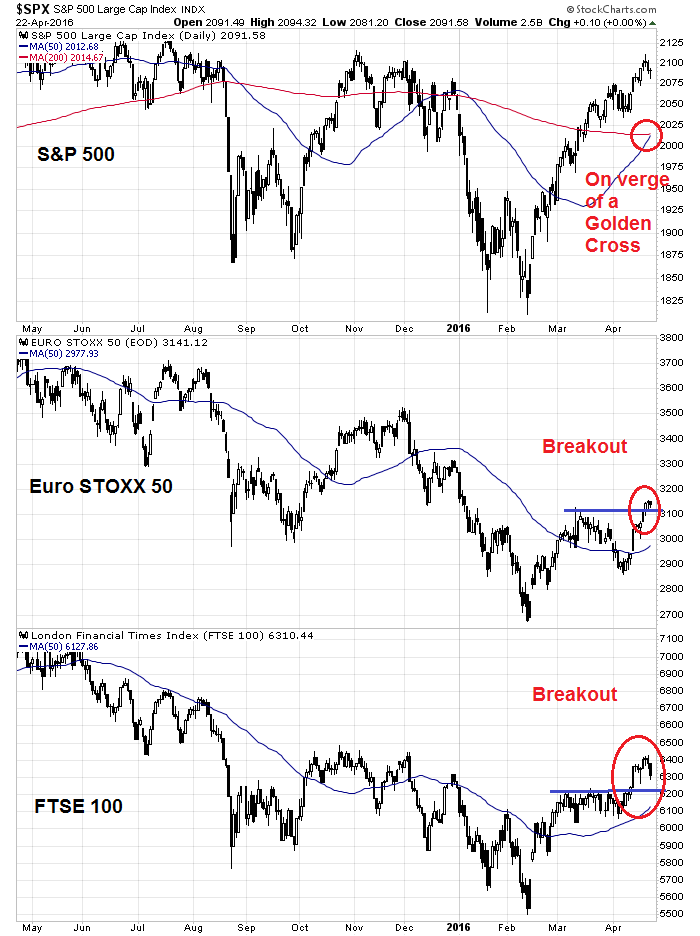
Consider, for example, the strength of US and European stocks, which are all in various stages of upside breakouts and other bullish developments.
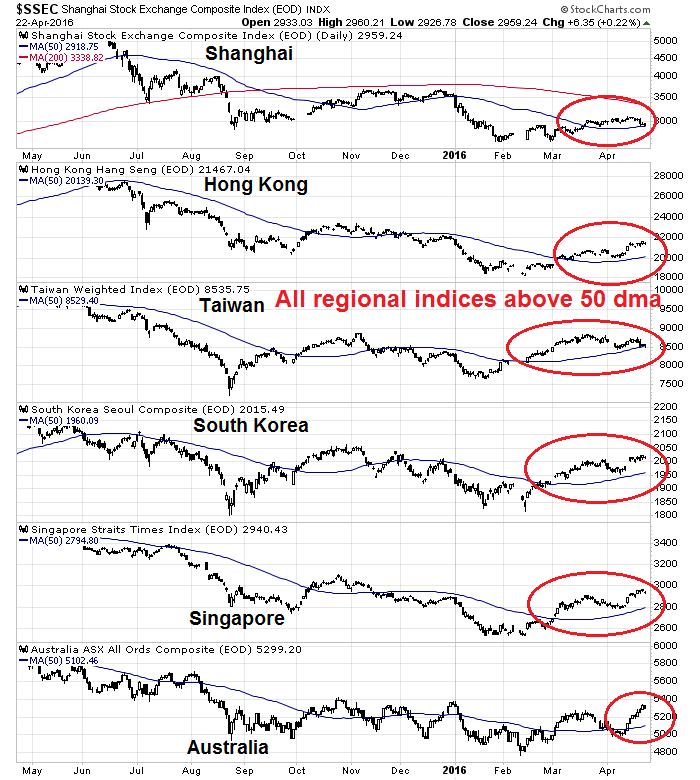
The stock indices of the major Chinese Asian trading partners are all showing strength and above their respective 50 dma.


Cam, we have been and are, singing the same tune except for one thing. You are in the “seventh year bull market now at late stage” camp. I see that every major index in every country of the world, including the NASDAQ and Russell 2000 went down the 20% bear market amount except the S&P 500 which was held up by high weightings in growth industries. So I believe the world ended a bear market in early 2016 and is now beginning a new bull market. That will take a few years rather than a dash to a final peak later this year as you envision.
How can we have three or four years? Wouldn’t that make stocks insanely expensive? Based on earnings yes, but something new is happening. I believe the market is morphing towards dividends as THE measure of value rather than PEs. This is occurring after the December FED raising of rates. At that time, everyone thought rates would ramp up quickly going forward. The Dot Plot would finally happen. Veterans saw a V bottom in rates and a return to ‘normal’ rates. We were all fooled and it’s dawning on us that something new is happening. Long term rate projections are falling. If one sees the current low long term interest rates as even remotely justified rather than totally manipulated by the Central Bankers, then the current dividend yield on stocks is extremely generous. 65% of S&P 500 stocks yield more than the 10 year treasury. In 2007, only 5% yielded more. Between 1950 and 2007, the world had gone from dividends much higher than bonds to a where dividends were almost inconsequential and earnings were the sole valuation measure.
Our eyes have been fixated on PE multiples versus history. The long term average has been 15 times. Today’s 17 times seems expensive. (Schiller CAPE is even worse) Invert 15 PE and you get a 6.7% earnings yield. 17 times is 5.9%. Since the dividend yield on the S&P 500 is just under 2%, that leaves a lot of room in profitability to raise dividends even if earning go down somewhat. And dividends have been going up at an 8% rate in that last five years. How much might they go up in the next ten years when compared to a ten year treasury or up for thirty years compared to 3% 30 year treasuries?
It has been a shocker to see the changing forecasts of the FED interest rate policy since the start of 2016. The consumer staples and utilities which are great, predictable dividend payers are leading the market along with commodities. They seem expensive given historical PE multiples but look at their dividend yields versus bonds and imagine their yields growing for decades. Who cares about the earnings?
Institutional investors have a landscape of low yielding or negative yielding fixed income choices. They are starting to envision a long term low interest rate environment rather than a V bottom on rates and a return to historical norms. This makes dividends they key driver on long term stock valuation. Something brand new.
How high might the market go on a dividend valuation basis? It would be the growth rate of dividends plus a revaluation process similar to PE expansion in a bull market. Corporations would see that institutions reward rising dividends and would respond by raising them faster. Right now you have about a 2% yield on the S&P 500 with a 5.9% earnings yield. There is lots of room to grow dividends.
Veterans would say that consumer durables and utility stocks will be the first casualty of the rise in rates during the “late-stage” bull market period they see us in now. The surprise is they could keep on leading as a new viewpoint on long term flat interest rates rather than rising rapidly dawns on investors. The rest of the market will follow as investors realize how positive the tame rate outlook is for all stocks.
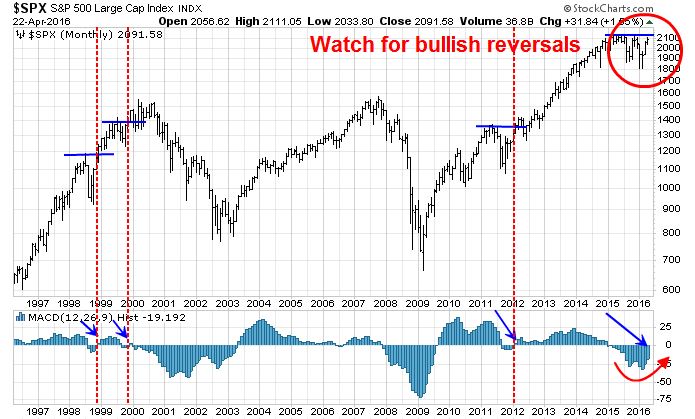
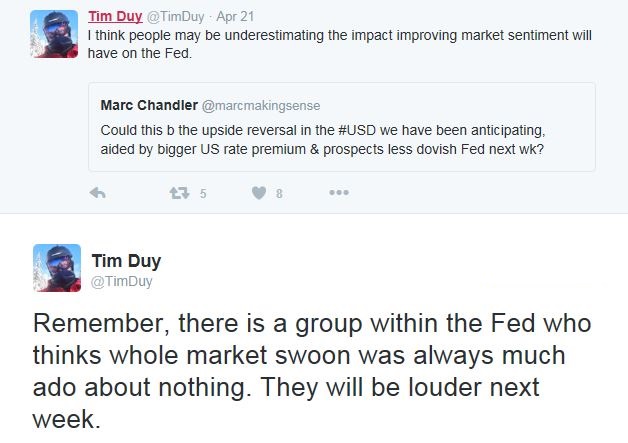
I love this analysis. Cam has bought the “hated market” meme — which is true for the attitude of the P/E guys who just can’t believe the valuations attractive enough to prop up another bull leg. But in actuality, investors have piled into and remain in this market with lots of love (see the article by Jesse Felder “It’s time to put an end to the ‘most hated market’ meme”: http://jessefelder.tumblr.com/post/142465852905/its-time-to-put-an-end-to-the-most-hated-bull). So in fact, the masses of muppets love the dividends. They keep buying the dip. If there is any hate, it’s because Fed policy is forcing the masses into risky assets to get a decent return. It’s going to take quite a market setback — more than the 10% February swoon — and much more hawkish Fed policy to break this love connection.
Ken, this is a fascinating thesis of yours. But in my mind it begs the following line of thought: Dividends require cash. Cash comes from earnings and profits. If the earnings and profits aren’t there, where does the cash for dividends come from? Maybe I’m missing the obvious.