Mid-week market update: I was wrong. I thought that the stock market was due for a pause and pullback last week (see A possible pause in the uptrend). Instead, it has strengthening on skeptical sentiment and improving breadth.
The combination of these conditions are suggestive that the current rally as a lot further to go in the short run.
Sentiment is still skeptical
I have been writing for several weeks about how sentiment readings have shown signs of skepticism. The latest data points come from Rydex and Mark Hulbert. The chart below of cash flows into Rydex defensive funds as a % of total cash flows indicate that caution is rising even as the market advanced. This is a classic sign of the market climbing the proverbial Wall of Worry.

As well, Mark Hulbert observed that his sentiment readings are incredibly subdued (vias USA Today):
To appreciate how subdued stock market optimism is right now, consider the average recommended stock market exposure among several dozen short-term market timers I monitor (as measured by the Hulbert Stock Newsletter Sentiment Index, or HSNSI). This average currently stands at 47%, which means that over half of the typical market timer’s stock market portfolio is in cash. That’s amazing, considering that the Dow is only 1.3% away from climbing to a new all-time high.
The mood then was far more update [I think he means upbeat] than it is today: The HSNSI that month got as high as 73%, which was one of the highest readings of the last two decades—and 25 percentage points higher than today’s level. Contrarians last summer were therefore not surprised by the market’s subsequent stumbles.
Josh Brown said the same thing, but at an anecdotal level:
The anger about the new all-time high the S+P 500 is currently approaching is palpable. Take my word for it, I read everything and everyone.
The 14.5% rally off the February lows, on nothing but worsening earnings and cuts to GDP forecasts has people utterly furious. I’m trying to remember a time in which stocks were on the verge of a breakout and people were so angry about it. The Dow just broke above 18,000 for the first time in nearly a year, and no one wants to even smile.
I call it skepticism. He goes further and calls it “anger”. Any way you look at it, there are way too many bears who haven’t capitulated.
Breadth confirms market strength
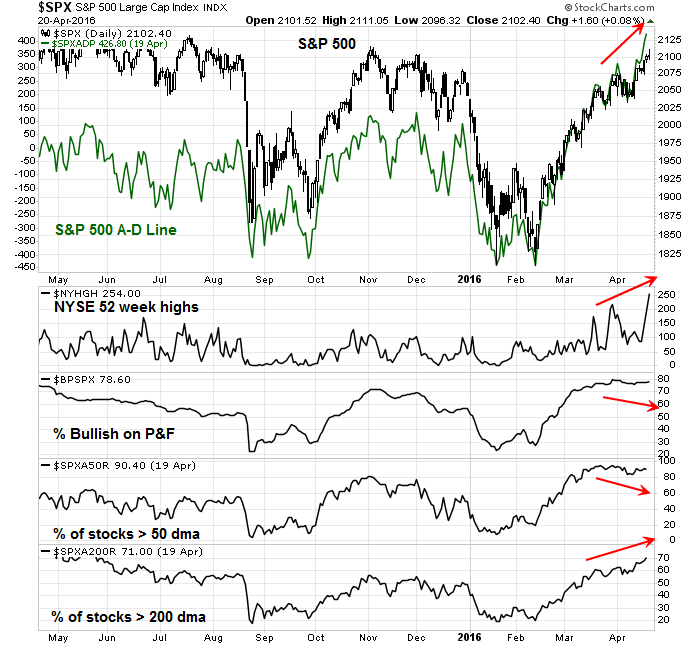
The stock market rally has been confirmed by improvement in market breadth metrics. The chart below shows that the SPX A-D Line, which is an apple-to-apples measure of breadth when compared to the NYSE A-D Line, making new highs even as the index advanced. Even though % bullish and % of stocks above the 50 day moving average (dma) did not confirm the market strength, other measures, such as NYSE new highs and % of stocks above the 200 dma did.
In his latest daily trading notes, Brett Steenbarger agrees with my interpretation of improving breadth. Moreover, he is not seeing signs of rising selling pressure:
Stocks moved to new highs for this run, with significantly expanded breadth. Across all exchanges, stocks making fresh 3 month highs vaulted to a new peak. (See below). The general rule is that peaks in breadth/momentum tend to precede price peaks for bull cycles. While breadth is stretched here–and indeed we’ve pulled back in overnight trade–we continue to see dips at successively higher price lows, which is what makes for bull moves…
A different way of looking at breadth tracks the number of NYSE stocks giving buy versus sell signals across a variety of technical trading systems. I keep those stats as a cumulative running total, which has also displayed unusual strength in recent sessions. (See below). What is equally noteworthy is that few shares are giving sell signals, which is a reflection of the low level of selling pressure evident in the upticks/downticks data. Bottom line, I’m not seeing signs of deterioration in this market at the present time.
A “good” overbought market
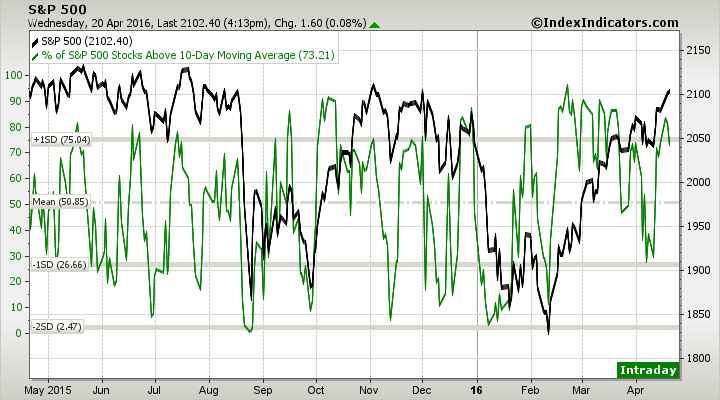
To be sure, the market is flashing overbought readings, which are cautionary signs. These charts from IndexIndicators tell the story of how extended breadth measures are. Here is the % of stocks above their 10 dma, which has retreated a bit from overbought extremes:
Here is a chart of the net 20 day highs-lows:

While these conditions show that the market is overbought, readings are not at excessively crowded long levels. This could be considered to be a “good” overbought state, where the market gets overbought and stays overbought for some time. The combination of investor skepticism and strong breadth also indicates to me that this rally could go further than most traders expect in the short term.
My inner trader, who went to all cash last week, has re-entered the market on the long side.
Disclosure: Long SPXL
Thanks so much for the email update today and for this timely follow-up. This is most helpful for those of us who are not in a position to follow Twitter through the day.
Point of correction:
My inner trader, who went to all cash last week, has not re-entered the market on the long side.
Disclosure: Long SPXL
I believe you meant to saw “has now re-entered the market on the long side” rather than “has not re-entered the market on the long side.
Thank you, Cam
Hi Cam,
I am slightly confused about your “plot for traders’ (1-2 weeks horizon) with arrows showing in or out of the market. Why doesn’t it show where you recently advised to be in cash last week and long this week ?
Thanks.
Short answer: I overrode the model in my trading account based on what I perceived to be excessively overbought conditions at the time (last week).
Hi Cam, do you think the current commodity rally will eventually hurt the equity market via fed expectation? this is kinda happening in China (local commodity and A Share markets). thx