Preface: Explaining our market timing models
We maintain several market timing models, each with differing time horizons. The “Ultimate Market Timing Model” is a long-term market timing model based on research outlined in our post Building the ultimate market timing model. This model tends to generate only a handful of signals each decade.
The Trend Model is an asset allocation model which applies trend following principles based on the inputs of global stock and commodity price. This model has a shorter time horizon and tends to turn over about 4-6 times a year. In essence, it seeks to answer the question, “Is the trend in the global economy expansion (bullish) or contraction (bearish)?”
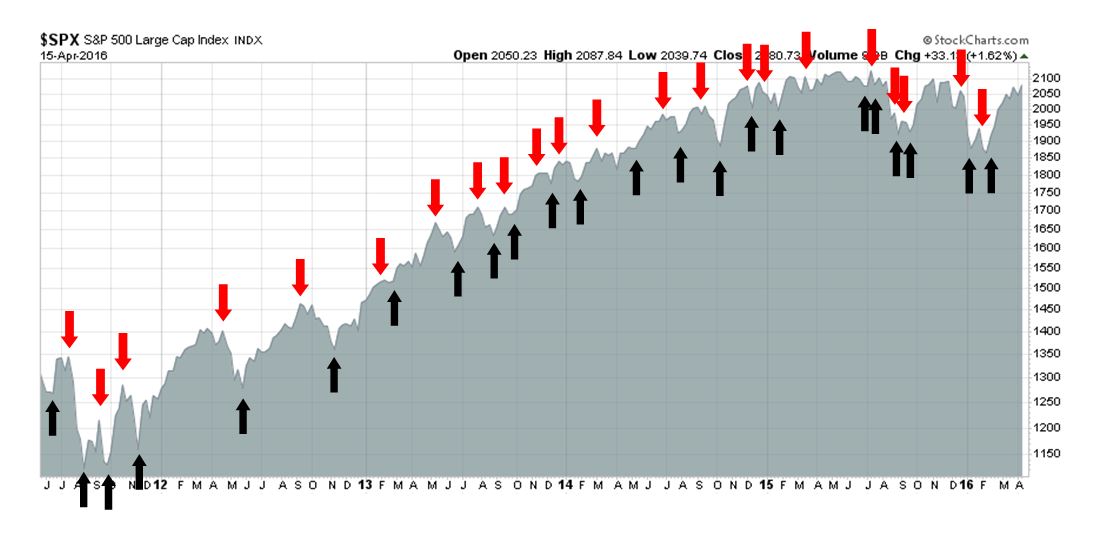
My inner trader uses the trading component of the Trend Model seeks to answer the question, “Is the trend getting better (bullish) or worse (bearish)?” The history of actual out-of-sample (not backtested) signals of the trading model are shown by the arrows in the chart below. Past trading of this model has shown turnover rates of about 200% per month.
The latest signals of each model are as follows:
- Ultimate market timing model: Buy equities
- Trend Model signal: Risk-on
- Trading model: Bullish
Update schedule: I generally update model readings on my site on weekends and tweet any changes during the week at @humblestudent. Subscribers will also receive email notices of any changes in my trading portfolio.
A roadmap, not a forecast
There has been a number of new subscribers who have come onto the site and I thought that it would be useful for me to review my outlook for the remainder of 2016 and into early 2017. I would characterize it as a roadmap, rather than a forecast, as there are far too many moving parts for this to be an actual forecast.
My base case scenario calls for the US equity market to form a cyclical top in 2016. The market is likely to rise and make marginal new highs this year, led by late cycle sectors such as capital goods and resource extraction. As inflationary pressures become evident, the Fed will respond with a series of rate hikes, which have the potential to push the American economy into recession. With European growth still fragile and Chinese growth decelerating and beset by a debt overhang, such Fed actions could drag there rest of the world into recession as well. Risky assets such as stocks would not behave well in such an environment and a major downleg in stock prices is well within the realm of possibility.
An analysis based on the Morningstar median stock fair value estimate, which shows the market to be trading at about fair value, is consistent with my roadmap. On one hand, the lack of gross under-valuation is unlikely to see stock prices rally significantly for the rest of this year. On the other hand, past history has shown that the market has been able to advance even under adverse conditions of over-valuation. Therefore a scenario of modest market gains, followed by a loss of macro momentum from changes in Fed policy, is well within the realm of possibility.

Let me expand on those points.
The Phillips curve and inflation
Our story begins with the Phillips Curve, which postulates a short-term tradeoff between inflation and unemployment. The Phillips Curve is also one of the key planks of Federal Reserve monetary policy, as numerous Fed speakers have made references to labor market dynamics in discussions of inflation and monetary policy. This is especially important as Janet Yellen was trained as a labor economist.
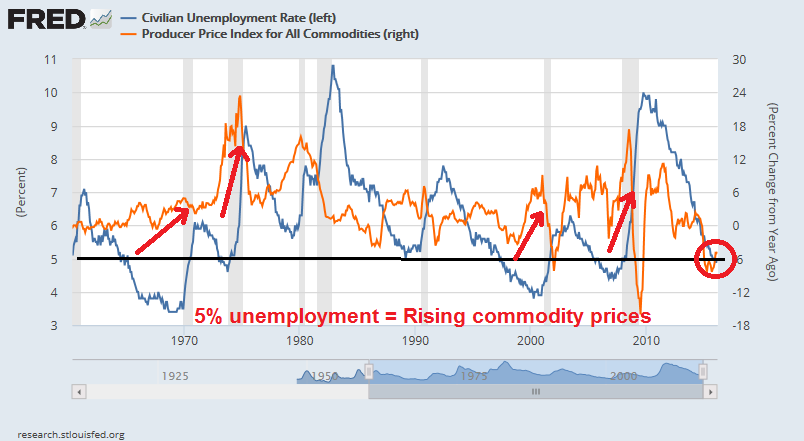
Here is an illustration of how theory meets reality. As the chart below shows, commodity inflation (orange line) has had a tendency to accelerate to the upside whenever the unemployment rate (blue line) has fallen below 5% in the past. Such episodes has been followed by recession, largely because the Fed responded to rising inflationary pressures with tight monetary policy, which eventually pushed the economy into economic slowdowns (annotations in red are mine).
USD weakness = Cyclical tailwinds
Every economic cycle behaves slightly differently. This cycle has seen USD strength, which began in 2014. As the USD has been inversely correlated with commodity prices, I would expect the current episode of commodity strength to be stronger than usual, propelled by the cyclical forces of Phillips Curve inflationary pressures and a weakening greenback. As the chart below shows, the Trade Weighted Dollar has decisively broken an uptrend. The days of a strong Dollar appear to be over.

Remember all the hand wringing in January and February about an imminent recession? Much of that can be attributable to USD strength. The chart below shows how ISM Manufacturing Purchasing Managers Index (blue line), as a proxy for manufacturing, is inversely correlated with the Trade Weighted Dollar (red lines, shown with an inverted scale).
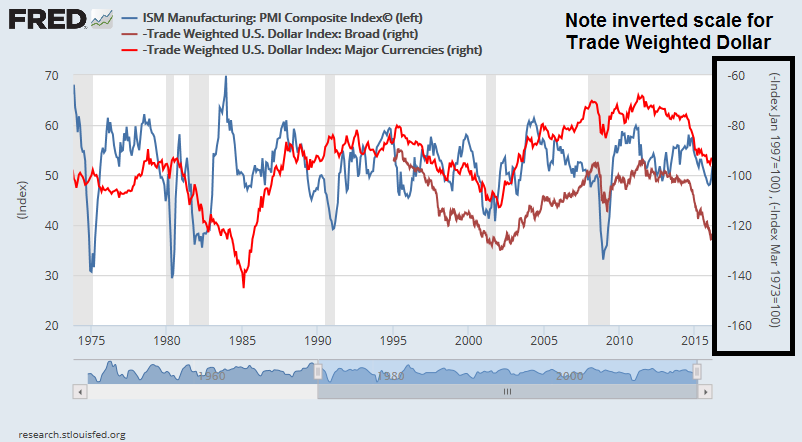
The strong USD effect on manufacturing was strong enough that it pushed the US economy underwent a mild industrial recession that began in Q4 2015, which it is now in the recovering from today (see my comment last week Equities in a macro sweet spot).
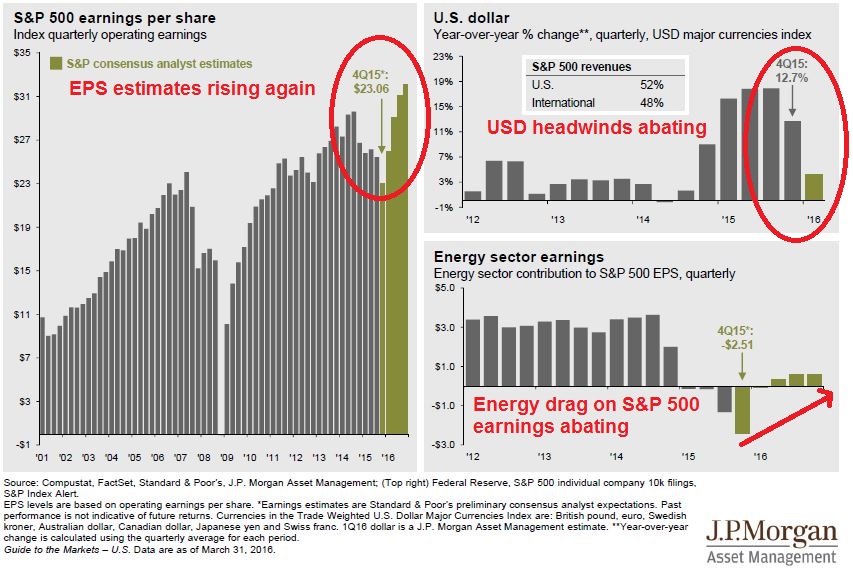
USD strength also created two very visible headwinds for equities. First, the strong Dollar pushed down commodity prices and cratered the earnings of energy and mining companies. In addition, it squeezed the margins of large cap exporters. As the greenback began to weaken, these headwinds shifted and turned into tailwinds. As the chart below shows, Street earnings estimates are rising again, aided by a falling dollar and stabilization in oil and other commodity prices (annotations in red are mine).
As the USD stalled, cyclically sensitive industrial metals have started to bottom and turn up. Tactically speaking, the USD Index is currently testing a key support level and some retracement of Dollar weakness and commodity strength would not be a surprise.

At this point, any stock market gains will depend largely on the evolution of earnings expectations, as my previous analysis showed that the market is trading at roughly fair value, based on the Morningstar median stock fair value estimate. The latest update from John Butters of Factset shows that forward 12-month EPS has been rising.

The latest results from Q1 Earnings Season are also encouraging. While results are highly preliminary as only 7% of the index has reported, both the EPS beat rate and, more importantly, the sales beat rate are coming in at above their respective 5-year averages.
So far, so good. The market is poised for a growth surprise.
Skeptical sentiment = More upside
Even as data is supportive of a cyclical rebound sentiment readings are showing a high degree of skepticism across all segments of market participants. The latest BoAML Fund Manager Survey of institutional investors show that cash levels are high and rising, which indicate disbelief about the broad based global market rally.

The latest NAAIM survey of RIAs who manage individual investor funds showed that equity exposure ticked down even as stock prices rose last week – another sign of skepticism.

Individual investors are skeptical too. The latest AAII sentiment survey shows that bullish sentiment actually fell despite the advance in stock prices (via Bespoke):

The bulls couldn’t ask for a better sentiment backdrop. Institutions, professional advisors and individual investors are all cautious in the face of improving fundamentals.
When does the Fed raise rates?
So far, the immediate bull case for stocks has been easy to make. The next part gets a bit trickier. In the past, the Federal Reserve has responded to signs of rising inflation and inflationary expectations by raising interest rates. The Yellen Fed has raised numerous objections on why it shouldn’t raise rates. The risks are asymmetric. Inflationary expectations may become un-anchored, but to the downside. The global economy is still fragile. The litany of excuses goes on and on.
It would be difficult to know when the Fed ultimately moves and begins its process of interest rate normalization. The chart below shows a wide gap between the market’s expectations and the FOMC projections of the Fed Funds rate. The most likely trajectory for Fed Funds sees Fed policy initially moving down towards market expectations, but as inflationary pressures build, market expectations converge upwards towards FOMC projections.
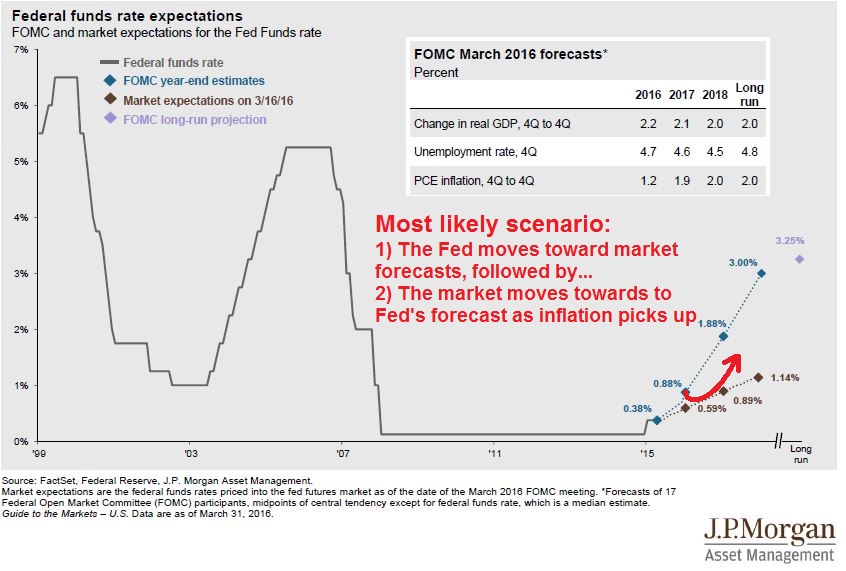
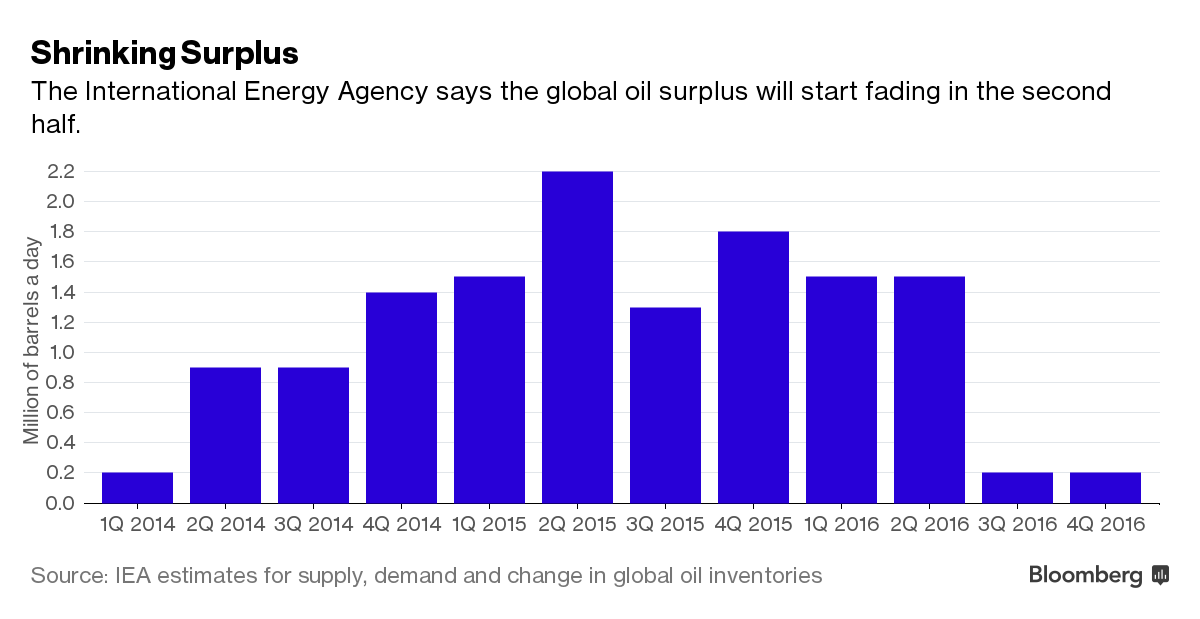
The big question is timing. That’s where my crystal ball gets a bit cloudy. My best guess (and it’s only a guess) is that we will start to see a change in the tone of Fedspeak in late 2016 or early 2017. It should be evident by then that the economy is growing well on its own. Employment growth should continue to improve or will have plateaued. Energy prices should have stabilized and recovered, aided by a drastic shrinkage of the supply glut, as per the latest IEA forecast (via Bloomberg).
Such an environment will prompt the Fed to continue its interest rate normalization process, especially if it feels that it is falling behind the inflation fighting curve. As a reminder, this analysis from Ned Davis Research shows that the stock market performs much better when the Fed takes a go-slow approach to its tightening process compared a fast one.

The risk of a Fed policy mistake is high. Should the European economies continue to be fragile and China continues its path of growth deceleration (see More signs of unbalanced Chinese growth), an overly aggressive Fed could push both the US and global economies into recession. If we were to see a global recession in 2017, the combination of unfinished business in the European banking system (the problems in Italian banks as a prime example), excess leverage in China and a whole host of other factors could serve to exacerbate the downside volatility of a downturn (see Why the next recession will be very ugly).
The likelihood of a Fed policy mistake is also high. The Fed is mainly composed of academics who monitor backward looking indicators. They tend to react slowly and cautiously (as they should, given the weight of their responsibility) to changes in economic circumstances. This kind of institutional culture tends to spawn a reaction function of policy overshoot.
What to watch for
For now, there is no need to panic. The Fed is still dovish. I am monitoring my Recession Watch indicators and the risk of a slowdown is still low. The latest update from New Deal democrat, who monitors high frequency economic releases, shows that the American economy is undergoing a number of tricky inflection points. It is bottoming out of a shallow industrial recession, but the long leading indicators are starting to see some very preliminary signs of weakness.
While the industrial recession has deepened (see industrial production), the improvement in the long and short leading indicators argues that we are near the bottom, and a rebound should begin shortly. The longer term issue remains that 2 of the long leading indicators, interest rates and corporate profits have failed to make new lows for a long enough time to be considered negatives, although interest rates are close enough to those lows to be positive for the shorter term “now-cast.”
As well, I am also carefully watching for the combination of over-valuation and insider selling as an sign that stock prices may have limited upside potential (see How worried should investors be about insider selling?). While the latest Barron’s report of insider activity shows that insider selling has spiked, no sell signal has been triggered yet.
Enjoy the equity party (for now), but watch for the macro turning point.
The week ahead: Watch for consolidation
Looking to the week ahead, I wrote on Wednesday that the stock market was encountering numerous negative divergences in breadth and momentum (see A possible pause in the uptrend). [Correction to that post: The SPX A-D Line did in fact make a new high, but the chart that I posted did not have the updated data – the fault is entirely mine.]

The combination of these negative divergences, which is bearish, and skeptical sentiment readings, which is bullish, suggests either a mild pullback or sideways consolidation. The next week is filled with event risk, starting with the Doha oil freeze talks. As well, 109 SPX and 14 DJIA components are scheduled to report earnings and the markets will undoubted react to the news of the day.
My inner investor remains bullish on stocks, with an overweight position in resource extraction sectors. My inner trader sold out of his long positions last Thursday and he is entirely in cash. He is opportunistically waiting to buy back into stocks at lower prices.
Disclosure: No trading positions
From a technical point of view, a monthly chart of the S&P 500 shows the MACD crossed under the signal line more than a year ago and has stayed there since. Also, the monthly chart shows the most recent rally did not make it back to the earlier high and the last low was lower than the preceding low, perhaps indicative of a change in the trend. So, I wonder whether we haven’t already seen the high for this cycle. Time will tell.
From a technical standpoint, I have a lot of sympathy for your analysis. From a fundamental standpoint, the upside potential is more than that.
Start with the Morningstar analysis that shows the market to be 1% overvalued. Let us suppose we want to get to a modest 10% overvaluation. Tack on a conservative 4-5% earnings growth between now and year-end, you can easily get upside potential of 2200-2300 on the S&P 500 before this is all over.
Hi Cam,
on April 14th you wrote “My inner trader stopped out and he’s outta ” but at the top of this page I can read “Trading model: Bullish” could you please explain?
Regards. Massimo
The trading model has a time horizon of 1-3 weeks and that remains bullish. However, there is a risk that the market may pull back and consolidate in the next week or so. Thus, my inner trader went to cash (did not short).
Different time horizons.
A pop-up to join the service appears even when I am logged on.
Hi Cam,
I’m not really understanding New Deal Democrat’s analysis. Could you help reword this phrase of his in a more intuitive manner:
“The longer term issue remains that 2 of the long leading indicators, interest rates and corporate profits have failed to make new lows for a long enough time to be considered negatives, although interest rates are close enough to those lows to be positive for the shorter term now-cast.”
For example, I don’t understand why new lows in corporate profit would be good in the longer term time frame. One possibility is mean reversion, but if that was the case is there any good explanation for it or is the relationship discovered through data mining?
Here is how he explains his approach: http://bonddad.blogspot.com/2015/11/forecasting-2016-election-economy-first.html
The confusion around the weakness in earnings while stock prices go up is caused by the trailing and forward earnings are going up for sectors outside energy. Therefore those sector’s stock prices should go up now that fears of a recession and a ramping up of interest rates are behind us.
That leaves the energy sector stock prices. Why are they going up when earnings are plunging? Here’s the answer. We in Canada see this type of action at the bottom of every bear market cycle. This is typical action with all types of commodity stocks which are our Canadian specialty. We learn to buy when profits plunge and dividends are being cut and sell later when profits are huge and dividends are being raised. Why haven’t American veterans learned the same lesson? It’s because historically S&P 500 energy stocks did not see a big dip in earnings when oil prices fell. Their earnings were impacted about the same as the general index during a recession because huge companies in the energy weighting like Exxon saw earning from their refining offset lower crude prices. But this cycle is different. When you drop from $110 a barrel to $27 EVERYBODY gets whacked. But just like past cycles in Canada, the drop in earnings is a buying indicator for this sector of the S&P 500. It marks the bottom.
So you have non-energy company stocks rolling along with higher profits in a Central Bank blessed economy and you have energy stocks past the bottom of their cycle and starting to climb a wall of worry, new bull market. Together you get a Merry Christmas.