Explaining our market timing models
We maintain several market timing models, each with differing time horizons. The “Ultimate Market Timing Model” is a long-term market timing model based on research outlined in our post Building the ultimate market timing model. This model tends to generate only a handful of signals each decade.
The Trend Model is an asset allocation model which applies trend following principles based on the inputs of global stock and commodity price. This model has a shorter time horizon and tends to turn over about 4-6 times a year. In essence, it seeks to answer the question, “Is the trend in the global economy expansion (bullish) or contraction (bearish)?”
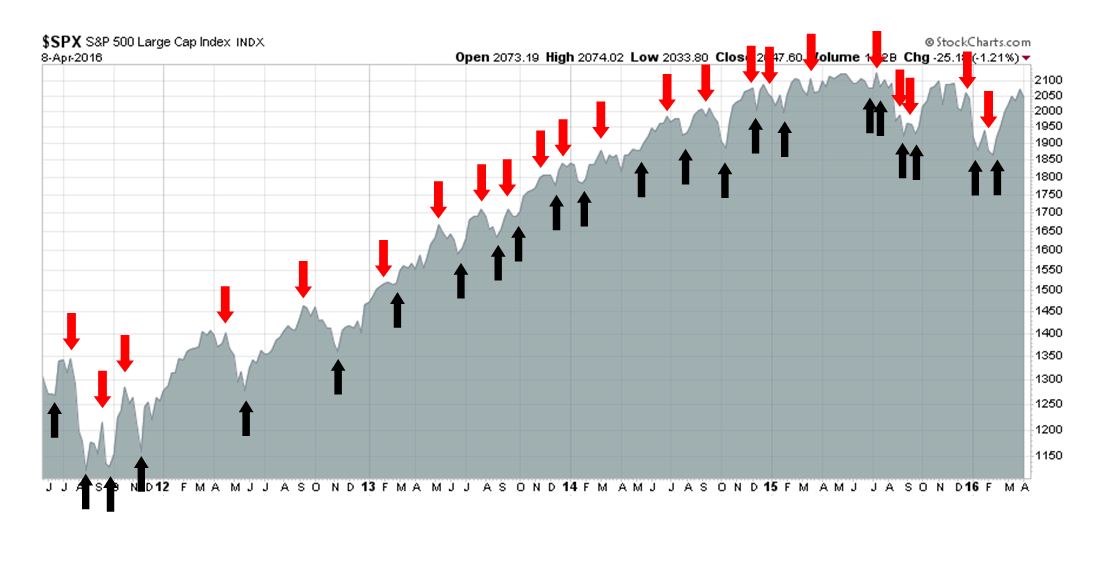
My inner trader uses the trading component of the Trend Model seeks to answer the question, “Is the trend getting better (bullish) or worse (bearish)?” The history of actual out-of-sample (not backtested) signals of the trading model are shown by the arrows in the chart below. Past trading of this model has shown turnover rates of about 200% per month.
The signals of each model are as follows:
- Ultimate market timing model: Buy equities
- Trend Model signal: Risk-on
- Trading model: Bullish
Update schedule: I generally update model readings on my site on weekends and tweet any changes during the week at @humblestudent. Subscribers will also receive email notices of any changes in my trading portfolio.
The earnings recession is over!
Back in the depths of the February market lows, Morgan Stanley strategist Adam Parker had become so despondent that he wrote that the “only bull case for equities was the was no bull case” (via Zero Hedge). I responded with a post (see Dear Morgan Stanley, here is the bull case) indicating that the bull case was a growth surprise:
If Parker had read my commentary last weekend, he would have understood the bull case (see Profit by thinking like Big Money). To put it very simply, the bull case for stocks can be summarized in two words: “Growth surprise”.
Subsequent to that post, the market seems to be starting to wake up to the growth surprise possibility. Today, most of the hand wringing about an imminent recession is gone as stock markets around the world have surged from their February lows. Nevertheless, I am still seeing widespread signs of investor skepticism, which represents potential buying power that can propel stock prices to new highs as growth recovers.
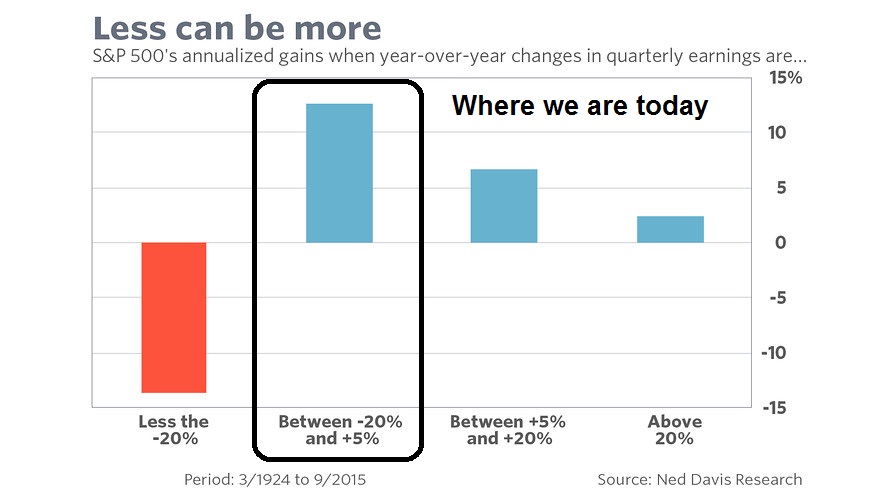
It may be trite to say that traders and investors should always look forward, rather than backwards, but that`s especially important in the current environment. That`s because the economy is starting to recover from a mild industrial recession, which has also been characterized as an earnings recession by a number of Street strategists. Mark Hulbert highlighted analysis from Ned Davis Research, who found that the stock market tends to have the best gains when it`s coming out of an earnings recession, which are the conditions we are seeing today.
Hulbert summarized the bull case this way:
Counter-intuitive as this inverse correlation may appear, however, there are good reasons for it, according to the late Marty Zweig, who is credited by Davis for documenting the phenomenon several decades ago.
The first is that the stock market discounts the future and foresees that a torrid pace of earnings growth cannot be sustained. The second, related to the first, is that faster earnings growth puts more pressure on the Federal Reserve to raise interest rates and tighten monetary policy.
This second reason, perhaps, is more relevant today, since an earnings recession gives plenty of cover to allow the Fed to slow the pace of rate increases. FactSet, for example, is projecting that earnings in the just-completed first quarter will be the fourth in a row in which earnings were lower than the previous year.
Let`s consider how the data supports Hulbert`s thesis for more market strength.
A weak economy in Q1
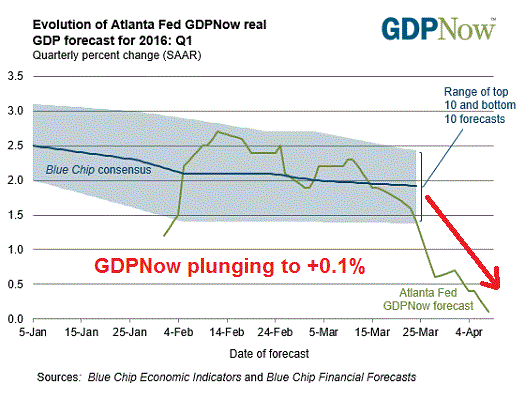
The backwards looking data is indeed bleak. The Atlanta Fed GDPNow nowcast of Q1 GDP growth is plunging and now stands at a barely positive 0.1%, which is an enormous drop from the 2%+ readings back in February. At this point, a negative Q1 GDP print would not be a big surprise.
As we approach Earnings Season, Factset reports that YoY Q1 2016 earnings growth is coming in at a dismal -9.1%:
The estimated earnings decline for Q1 2016 is -9.1%. If this is the final earnings decline for the quarter, it will mark the first time the index has seen four consecutive quarters of year-over-year declines in earnings since Q4 2008 through Q3 2009. It will also mark the largest year-over-year decline in earnings since Q3 2009 (-15.7%). Only three sectors are projected to report year-over-year growth in earnings, led by the Telecom Services and Consumer Discretionary sectors. Seven sectors are projected to report a year-over-year decline in earnings, led by the Energy and Materials sectors.
Looking backwards, these would be the kinds of headlines for bears to fret about.
Forward EPS recovering
Looking forward, the future looks brighter. New Deal democrat had laid out in the past the inventory correction scenario. Now he is seeing signs of recovery:
In the inventory correction scenario,
– pressure of the US$ eases – which it already has this year.
– commodity prices firm – which appears to have happened beginning last November.
– new orders increase – which we have from the ISM new orders index in the first three months of this year.
– inventory continues to decline – this is now established for wholesalers for the last 5 months.
– sales increase – not yet (as of February)!So while a negative GDP print for Q1 becomes more likely (as forecast by the Leading Indicators last summer), the progression of numbers gives me increased confidence that the shallow industrial recession that was caused in large part by the surge in the US$, is coming to an end.
In his weekly review of high frequency economic indicators. New Deal democrat reiterated his views about the likely end of the shallow industrial recession that the US economy recently went through:
As to the near term, the neutral to negative US$, the surge in new orders in the regional Fed indexes, the positive Gallup consumer spending, and the positive turn in steel production, are powerful evidence that the shallow industrial recession is ending. The recent big decline in BAA corporate yields is also something that typically happens late in a recession, as is the decline in spreads. Tax withholding has returned to being positive. Only shipping, rail, and temp staffing are big negatives.
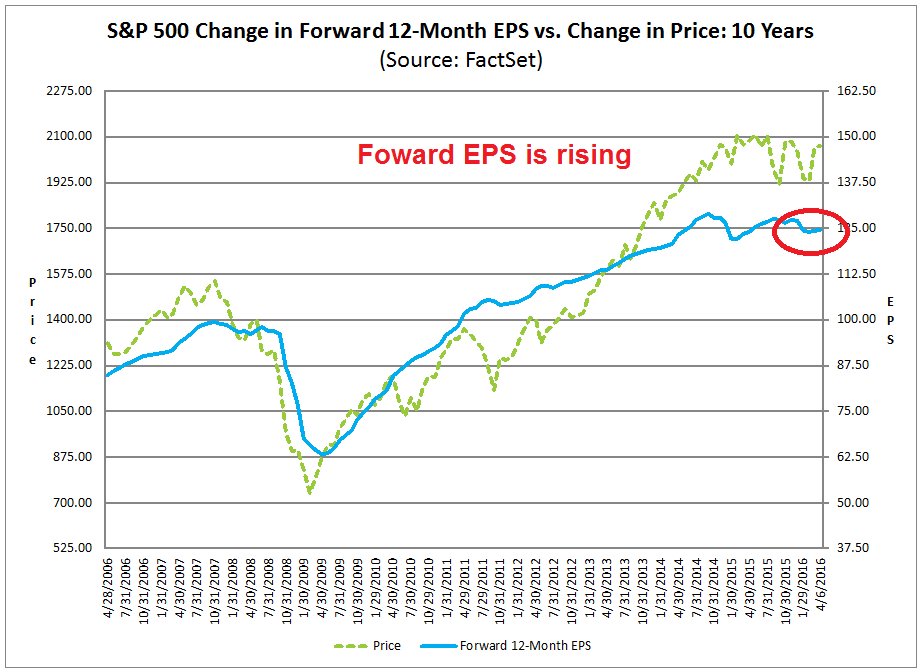
In addition, the same Factset report I cited above shows that optimism is returning to the Street. Forward 12-month EPS estimates are rising again, which is positive.
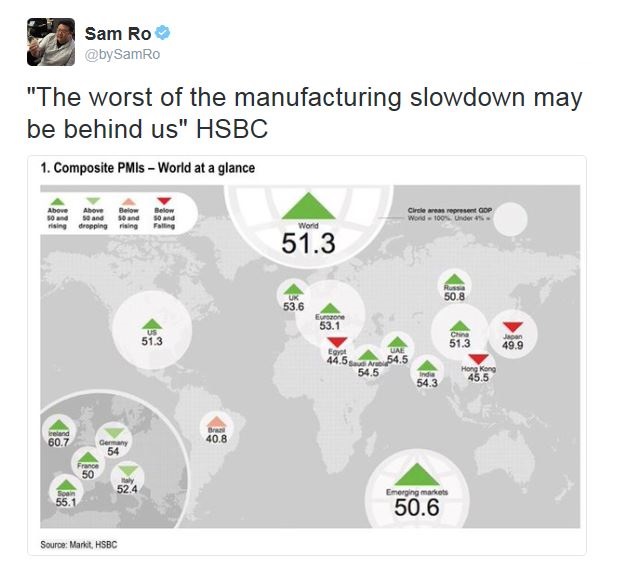
What’s more, the industrial recovery is not just localized to the US, but appears to be global. PMI readings are picking up all around the world (via Sam Ro).
A cautious Fed stays on hold
The economic weakness in Q1 will prompt the Fed to stay cautious about rate hikes, which is another bullish tailwind for equities in the next few months. Fed watcher Tim Duy concluded that the Fed is likely to stay on hold until it sees that the economy is strong enough to withstand further rate hikes, which will take a few more months for the data to come in. An April rate hike is definitely out. Don’t count on a June hike either.
The Fed is on hold for at least a few months until the data provides a more definite reason to justify another hike. With any luck, if the Fed continues to hold steady now, maybe they will get the chance to chase the long-end of the curve higher later – which is exactly what they need to be able to “normalize” policy. Expect officials to remind us that they expect a faster pace of a rate hikes than markets anticipate. But I think the bar for further hikes has risen since December. An appreciation of the asymmetric policy risks will prod them to seek more definitive signs inflationary pressures are growing to justify the next rate hike.
If a June hike is off the table because the Fed is waiting for signs of improvement from Q2 data, then we will be facing an election in November. Will the Fed judge that raising rates just ahead of the election be an overly political move? Just asking…
Supporting sentiment
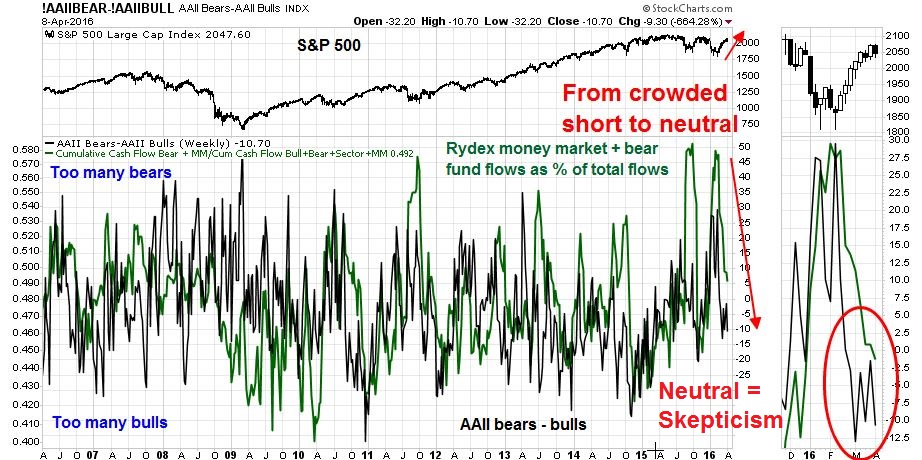
Further, sentiment readings are showing skepticism, which is supportive of more gains in stock prices. The latest readings from the AAII sentiment survey and Rydex funds flows show that readings have recovered from a crowded short to neutral. The lack of excessive bullish sentiment are more data points indicating that the combination of positive price and fundamental momentum can carry equity prices even higher. This seems to be a classic case of the market climbing the proverbial Wall of Worry as the economy recovers from the recent bout of weakness.
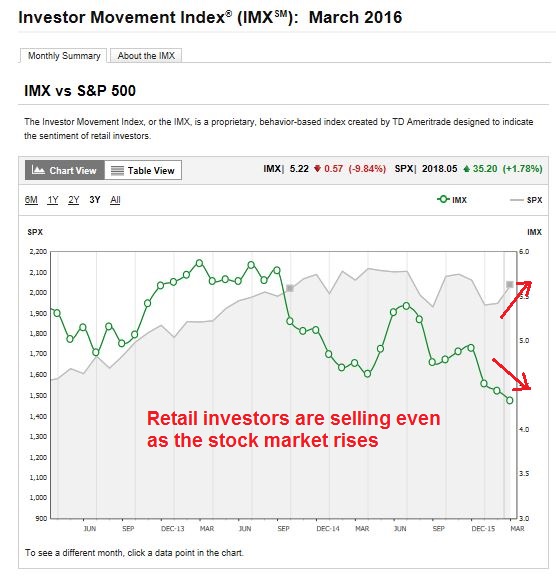
The latest March 2016 report from TDAmeritrade Investor Movement Index (IMX) confirms the level of public skepticism. IMX (green line), which tracks the degree of retail investor market participation, has been falling even as the market rallied off its February lows (annotations in red are mine).
In short, stock market bulls couldn’t ask for very much more. We now have:
- A shallow earnings and industrial recession, which depressed sentiment;
- Signs of macro and earnings recovery;
- A dovish Federal Reserve; and
- Skepticism about the recovery.
The week ahead
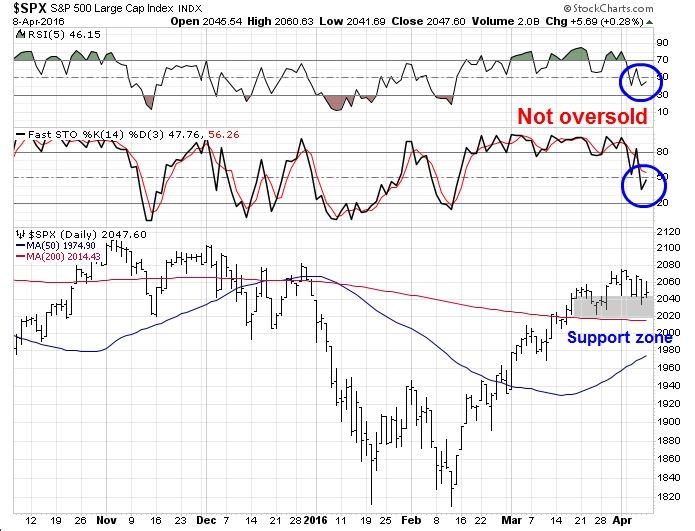
I wrote in my mid-week technical review that I was expecting a brief and shallow pullback (see How far can this pullback go?). So far, the market hasn’t disappointed me. The SPX fell into the support zone at 2015-2040 and that support has held so far. Short-term oscillator readings have weakened, but they’re not oversold, which allows for the possibility of more minor downside risk.
Next week is option expiry week (OpEx) and OpEx weeks have tended to see a bullish bias. Historical analysis from Quantifiable Edges shows that April OpEx is especially positive, which is another plus for the bulls.

Next week is also the kickoff for Earnings Season reports. While I expect some daily volatility as the market responds to the key earnings reports of the day, it will be a key test of my growth surprise thesis. If I am correct, expect better body language from corporate management about the Q2 and Q3 outlook.
My inner investor remains comfortably long equities, with an overweight position in the resource extraction sectors. My inner trader is also long stocks and expects to profit from the numerous short and medium term bullish tailwinds for the equity market.
Disclosure: Long SPXL
Hello graph of insiders of Barron ‘s (http://www.barrons.com/public/page/9_0210-instrans.html) would seem to show an increase in sales , how do you reconcile with your positive scenario ?
The insider trading data is noisy and readings can be volatile. I would wait a week or two before making any conclusions about any trends.
When markets recover, insider sales always go up. People who have been waiting when their company stock dipped, sell. Also the stats are sales minus purchases and we are in the blackout period for new purchases with first quarter earnings season upon us.
When it comes to earnings, I believe the S&P 500 stock market cycle is acting like the Canadian market has always acted. It’s been Canadianized!
The Canadian index has a 30% weighting in highly cyclical Energy and Materials. The S&P 500 has 9%. Plus our Materials Index is mainly cyclical mining stocks not the less cyclical U.S. chemical companies in their’s. Also the U.S. energy sub-index is dominated by less cyclical huge refining and marketing giants like Exxon. So you can imagine that during every past recession/bear market running earnings for the Canadian index would plunge and the index PE would soar. We Canadian veterans learned that this was the bottom of the bear and the time to buy. If the index PE went infinite with losses, so much the better.
This cycle, the extreme fall in oil. metal and other commodity prices has been so extreme that it has finally hit the running earnings of the S&P 500. Even the Exxon’s of the world are hit. Your little 9% weighting is a stone in your shoe this cycle. We Canadians say, “Welcome to our world”
U.S. gurus are warning that the current U.S. PE is above historical averages and markets will certainly fall as the PE goes to old norms on the reduced earnings. We Canadian laugh at that. That dip in earnings is a temporary thing due to a temporary recession in resource industries and other companies that support them. They have shifted to healing mode already. The U.S. stock market will do great and U.S. veteran investors will be confused.
And by the way, all of this works doubly well on the Canadian stock market. Remember our index is 30% in these wounded industries. That isn’t a stone in the shoe, that’s an anchor around the ankle that will be falling away. I believe we will have a very Merry Christmas.
So far 7 S&P500 companies have reported. 4 have missed GAAP EPS by an average of 21.7% while the three that beat beat on average by 3.3%… SO FAR bull case not good.
That’s so far in April.