Mid-week technical update: In my weekend market commentary, I wrote that I was intermediate term bullish on equities (see The trend is your friend (breadth, seasonality and sentiment too)). However, my inner trader was tactically watching the relative performance of the cyclical sectors for signs of market weakness.
Now that cyclical stocks have weakened and, in particular, oil prices seem to be rolling over, the key question is how much further can the current pullback go?
An examination of the daily SPX chart shows that it closed about 1% above a key support zone, bounded at the upper end at about 2040 and the lower end at the 200 day moving average (dma) at 2015. RSI-5 (top panel) flashed a short-term sell signal, but readings are not oversold yet indicating further downside potential.
Will the decline stop at 2015-2040 or is this the start of a deeper correction?
Cyclical stocks weak, but…
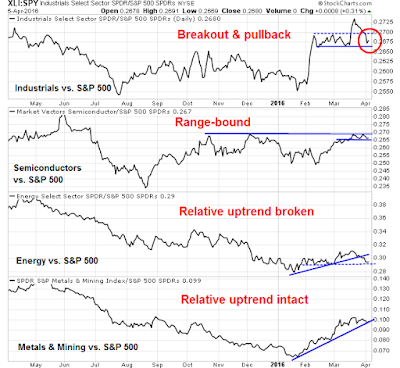
As my stated trading indicator was the relative performance of cyclical stocks. Let`s take a look at their relative performance and see how they are holding up in light of the current episode of market weakness.
A glance at some of the key cyclical groups show that, with the exception of the energy sector, their recent relative performance can be term as constructive and there is no need to panic. Industrial stocks staged a relative breakout and they have now pulled back to test the breakout, but these stocks remain in a trading range. Similarly, semiconductor stocks have struggled by trying a relative breakout, but remain range-bound on a relative basis. Energy stocks broken a relative uptrend and they are now testing a key relative support level. The relative performance of the other important resource extraction industry of metals and mining shows its uptrend to be still intact.
Arguably, the weakness in energy can be attributed to the specifics of the oil market and the news that OPEC producing countries failed to agree to freeze production.
In addition, it has been no surprise to see the commodity extraction sectors pause and pull back here. The USD Index, which has shown a historical inverse correlation to commodity prices, is testing a support zone. In addition, it is showing some minor positive divergences on RSI. A reversal and bounce can be expected here.
Possible rotation into high beta underway
One constructive data point for the bullish outlook is the nature of the sector rotation underway. As cyclical stocks have started to falter, high beta stocks appear to be taking over the leadership mantle, which is an encouraging sign for the bulls.
As the chart below shows, each of the high-octane and high beta groups, with the exception of IPO stocks, have staged upside relative breakouts out of downtrends and they are in various stages of undergoing relative strength revivals.
Still constructive on equities
In addition, Brett Steenbarger also had some encouraging comments for the bull camp in his daily market comment. Breadth weakness is not in evidence and momentum continues to hold up well:
We’ve seen a pullback in stocks and, with Monday’s close, now have fewer than 50% of SPX shares closing above their 3- and 5-day moving averages. With 831 monthly new highs and 288 new lows, we’re still not seeing significant deterioration in the breadth data. Energy stocks have been the weakest group given the recent oil weakness, but I’m not seeing significant weakness among any of the sectors. Financials have been relatively flat of late, so I have a close eye on those…
I noticed that, as of yesterday’s close, we had an elevated number of buy signals on the StockSpotter site. I continue to be impressed with their work. Their forecast model for SPY also is bullish. When those two factors have been present since late 2013, when I first began tracking their numbers, returns five to ten days out have been bullish. Specifically, we’ve been up 19 times, down 8 over the next ten trading sessions for an average gain of +1.17%.
When I put all this together, the weight of the evidence points to a brief and shallow pullback. My inner trader remains long the SPX. Drawdown sensitive traders may wish to consider reducing their long positions as there may be some more minor downside ahead in the next few days.
Disclosure: Long SPXL


What do you think the impact of the Panama Papers will be? Just a general slow down in the markets?
F
There doesn’t seem to be any big political surprises, either in the US or EU. So my take is that life goes on as usual, at least in the markets.
We have OPEX next week – which could be the end of the short term dt no? Cam, what do you think about range bound similar to Oct – Dec.
Probably. Pullback likely to be short and shallow.
We also have Yellen speaking after the close on Thursday. She is on a panel with Bernanke, Greenspan & Volcker. That should be interesting. Likely stock market effect is either neutral or bullish.
Why am I getting a pop-up prompt to subscribe both before and after I have logged in as a subscriber?
That shouldn’t be happening. Is that the same session?
Please email me and I will try and diagnose.