Explaining our market timing models
We maintain several market timing models, each with differing time horizons. The “Ultimate Market Timing Model” is a long-term market timing model based on research outlined in our post Building the ultimate market timing model. This model tends to generate only a handful of signals each decade.
The Trend Model is an asset allocation model which applies trend following principles based on the inputs of global stock and commodity price. This model has a shorter time horizon and tends to turn over about 4-6 times a year. In essence, it seeks to answer the question, “Is the trend in the global economy expansion (bullish) or contraction (bearish)?”
My inner trader uses the trading component of the Trend Model seeks to answer the question, “Is the trend getting better (bullish) or worse (bearish)?” The history of actual out-of-sample (not backtested) signals of the trading model are shown by the arrows in the chart below. Past trading of this model has shown turnover rates of about 200% per month.

The signals of each model are as follows:
- Ultimate market timing model: Buy equities
- Trend Model signal: Risk-on
- Trading model: Bullish
Update schedule: I generally update model readings on my site on weekends and tweet any changes during the week at @humblestudent. Subscribers will also receive email notices of any changes in my trading portfolio.
The trend is your friend
My trading model turned bullish on stocks on February 28, 2016 (see the faabove chart of out-of-sample trading model signals and The market bottom 2-step: 1 forward, 1 back). Since then, the stock market has been rising and I see few reasons for investors to deviate from a bullish position.
The Trend Model analyzes global stock markets and commodity prices to see how risk appetite is evolving. This week, I take my readers for a tour around the world to show how risk appetite is improving. In addition, I find that improving breadth, positive seasonality and skepticism about the rally are also supportive of further market gains.
To start, the chart below shows the US, the European stock indices and commodity prices. The SPX has rallied above its 50 and 200 day moving averages (dma), which indicates an uptrend. European stocks, as measured by the FTSE 100 and Euro STOXX 50 are all strengthened above their 50 dma lines. Commodity prices, as measured by the CRB Index and Industrial Metals, have also rallied above their 50 dma. Even though commodities did weaken a little last week, the 50 dma lines are holding as support.
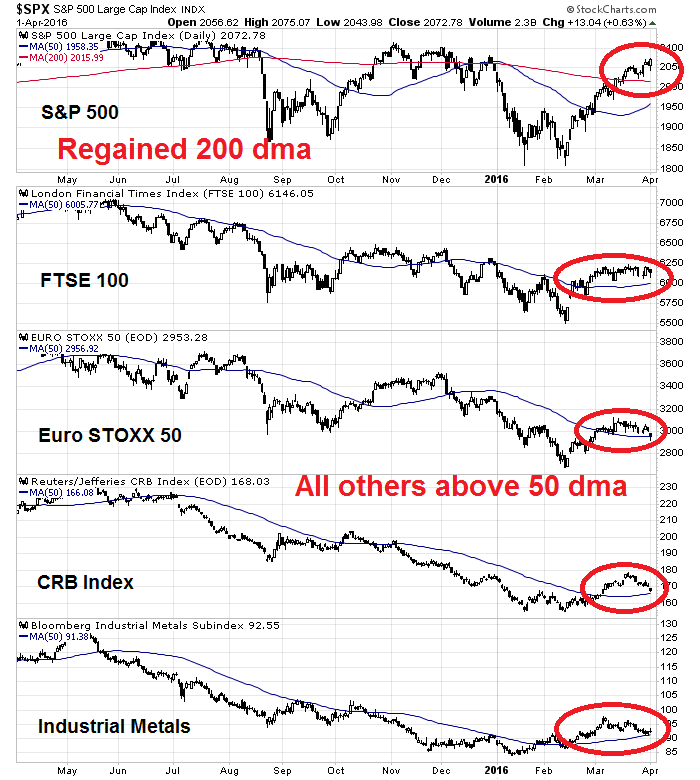
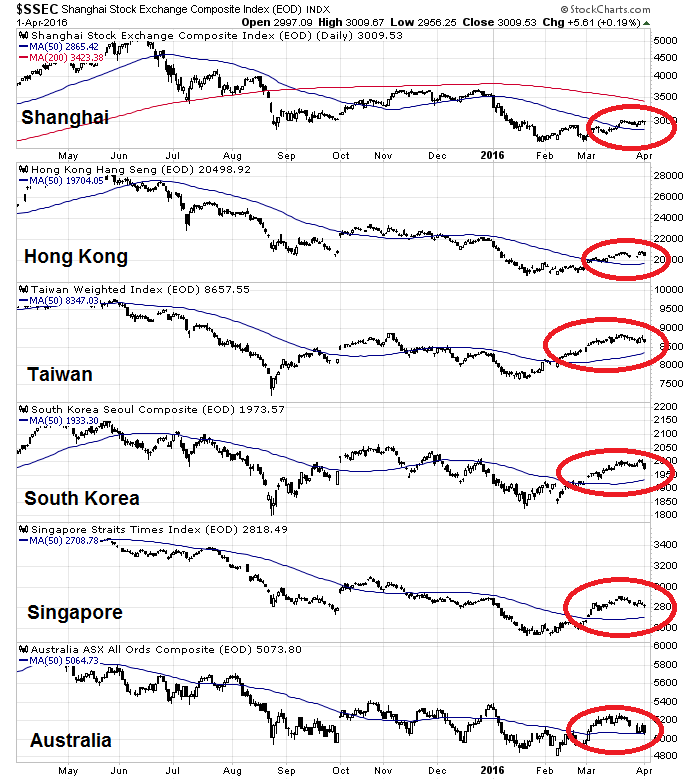
In Asia, we are seeing a similar pattern of market strength in China and the markets of her major Asian trading partners. All of those regional indices have rallied above their 50 dma lines.
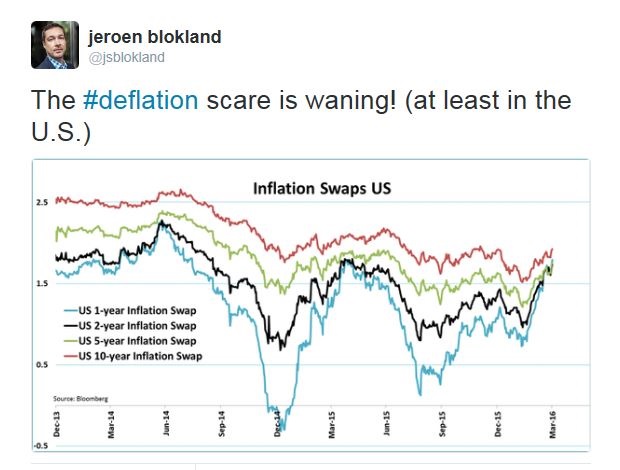
Signs of global reflation and improving risk appetite are everywhere. We are also seeing the reflationary theme evident in other asset classes. Jeroen Blokland recently pointed out that deflationary fears in the fixed income markets have receded, at least in the US.
The trend is your friend – and it`s pointing upwards for stock prices all around the world.
Breadth is positive
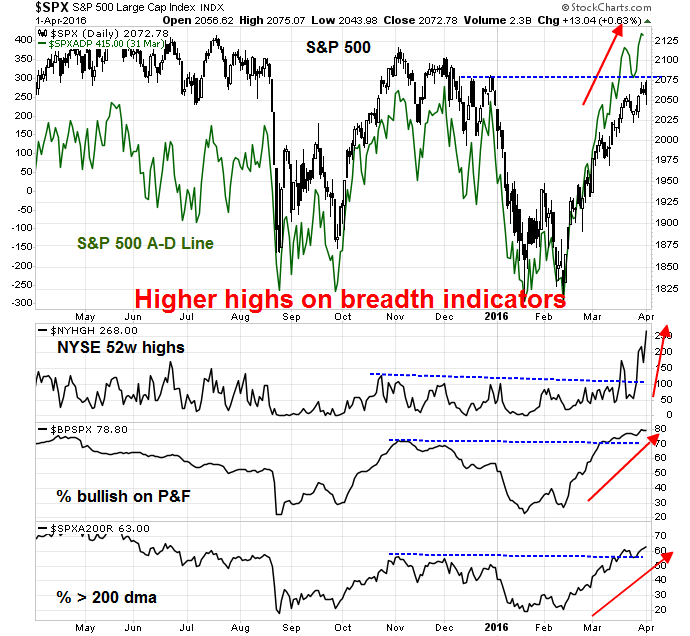
In addition, improving breadth indicators are supportive of further gains. The chart below shows the SPX along with a number of breadth metrics, namely the SPX A-D Line, NYSE 52 week new highs, % bullish and % of stocks above the 200 dma. Even as the SPX languishes below its highs, all of the other breadth measures have surged to new highs. These kinds of positive divergences are highly suggestive of further intermediate term market strength,
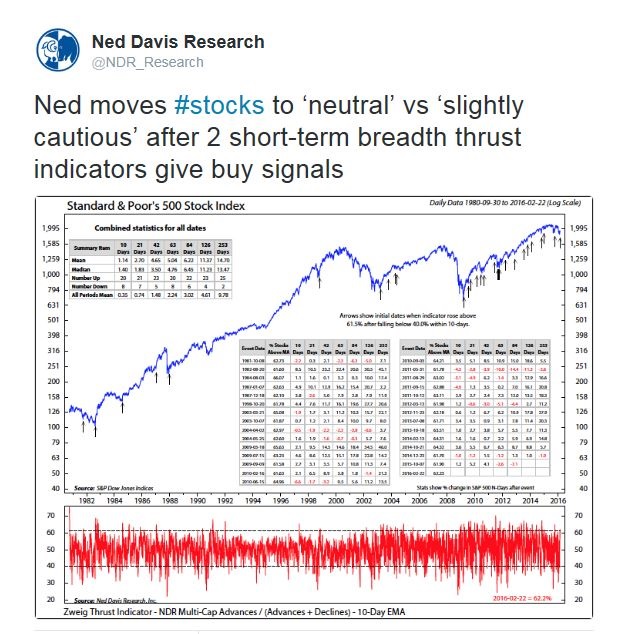
Breadth has also turned sufficiently positive that Ned Davis Research upgraded its tactical view from cautious to to neutral. Their analysis of stocks above the 50 dma shows a breadth thrust, which has historically shown bullish implications.
Positive seasonality
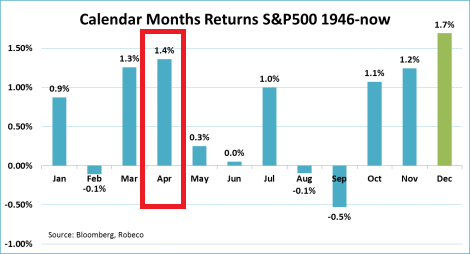
As we head into April, stock prices could benefit from a positive seasonality tailwind. Jereon Blokland analyzed monthly returns using different time frames. In all cases, April has been a standout in terms of average returns. Here are the monthly returns starting from 1946. April has historically been the second best month for stock returns after December (annotations in red are mine).
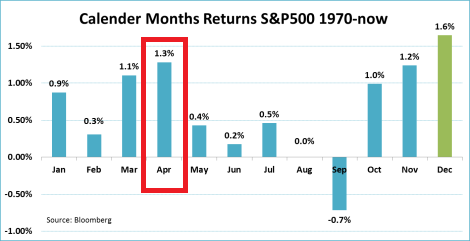
When Blokland shortened the time frame and starts from 1970, the results are about the same:
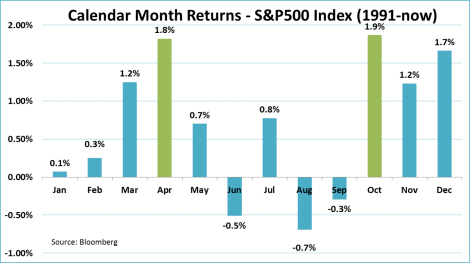
Zooming in further with a lookback period starting from 1991, the picture changes slightly. The best monthly return is no longer December, but September. But April stays as the second best month.
Marketwatch also highlighted analysis from Jeff Hirsch of the Stock Trader’s Almanac and Ryan Detrick of LPL Financial that came to a similar conclusion on April seasonality. What’s more, Detrick’s found that equity returns were even better when the market rebounded the way it did in March:
And while historical data have no bearing on future performance, Detrick pointed out that since 2002, a month that gains at least 6%—which happened in March—is typically followed by a strong month, with an average return of 3%.
And Detrick detected an even more interesting pattern going back to World War II—if stocks are weak in January and February but rebound in March, then the market tends to rise 8 out of 10 times with average gains of 3.4%.
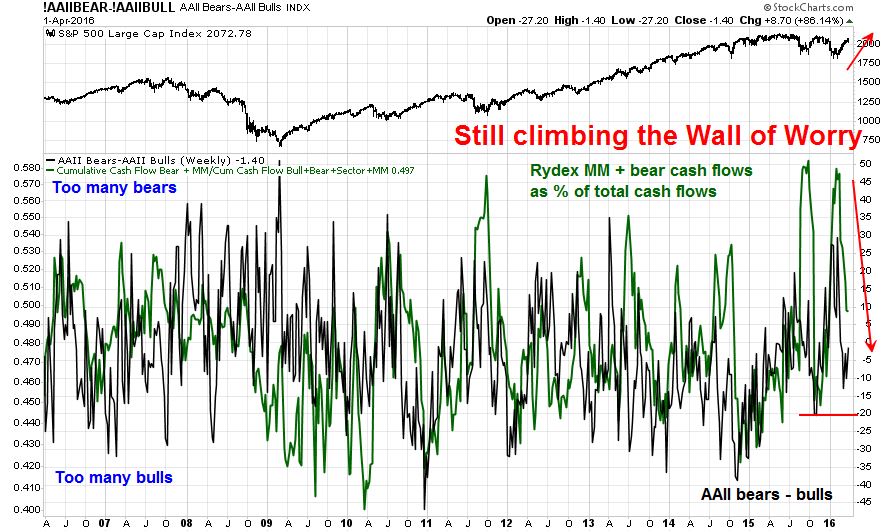
Climbing a Wall of Worry
In addition, I am also seeing a healthy dose skepticism about the latest rally, which is contrarian bullish. The chart below shows the AAII bear-bull spread (in black) and Rydex money market + bear fund cash flows as a % of total cash flows (in green), which is a better sentiment metric as it measures how traders are actually deploying their money. Both are in neutral territory and readings are not as bullish when the market last topped out in October/November. These neutral readings in the face of the recent strong market has to be interpreted as being constructive for further gains in stock prices.
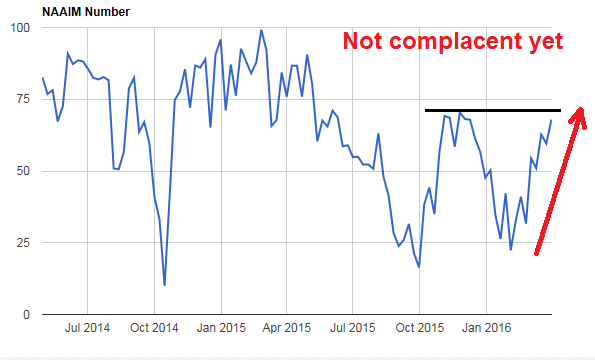
We can see a similar pattern of skepticism in the NAAIM survey of RIA sentiment. RIAs have become more bullish, but readings are below the levels of October/November when the market last topped out.
The latest report from Barron’s of insider trading tells a similar story, but from the flip side of the coin. This group of “smart” investors have pulled back from their heavy buying. Their activity level is in the neutral zone and there are no warning signs of excessive insider selling, which would be a bearish warning.
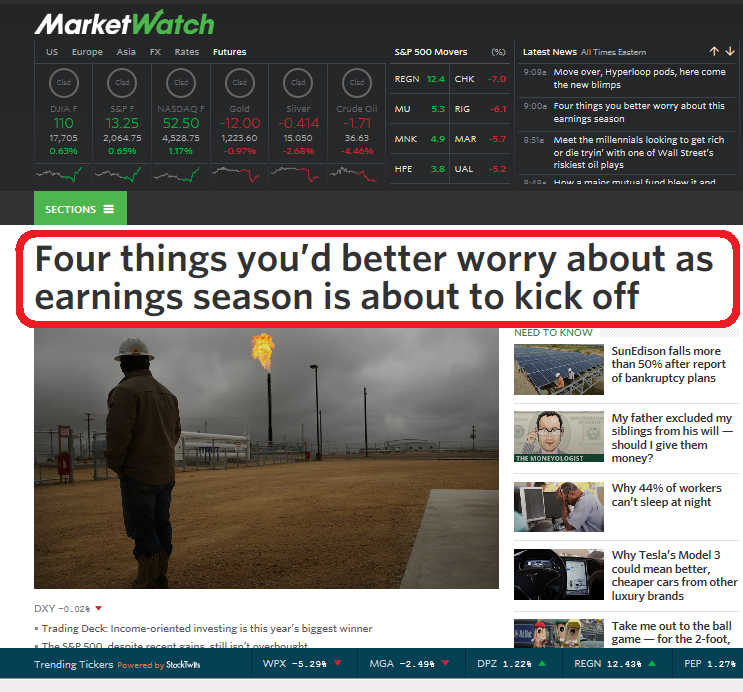
Earnings Season skepticism
As we approach Earnings Season, there seems to be a lot of caution, which is lowering the bar on market expectations. The weekend Marketwatch headline captures those fears well.
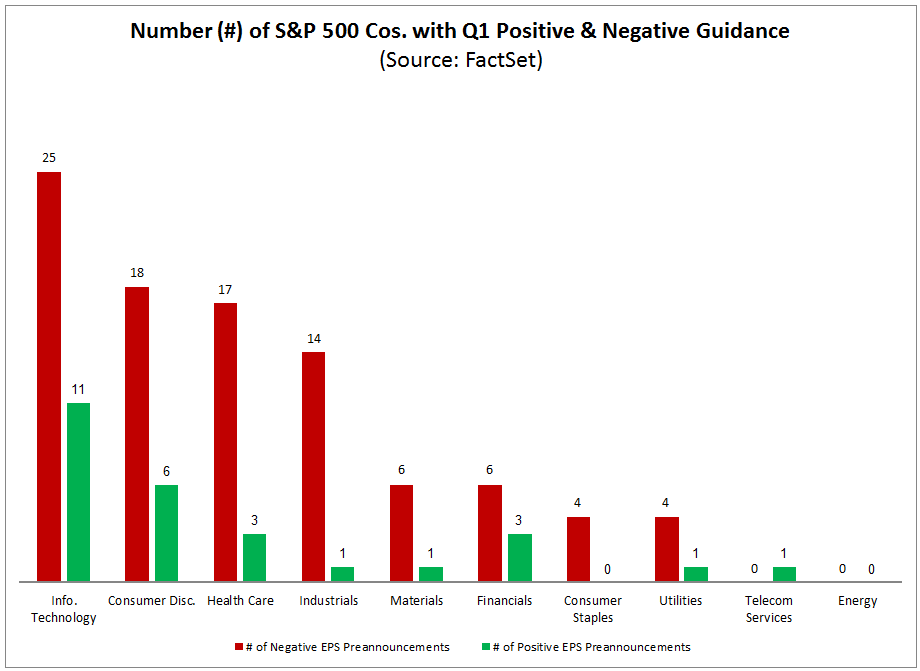
Factset reported that the level of negative guidance has been extraordinarily high:
In addition, a higher number and percentage of SP 500 companies have lowered the bar for earnings for Q1 2016 relative to recent averages. Of the 121 companies that have issued EPS guidance for the first quarter, 94 have issued negative EPS guidance and 27 have issued positive EPS guidance. If 94 is the final number for the quarter, it will mark the second highest number of SP 500 companies issuing negative EPS guidance for a quarter since FactSet began tracking the data in 2006. The percentage of companies issuing negative EPS guidance is 78% (94 out of 121), which is above the 5-year average of 73%.
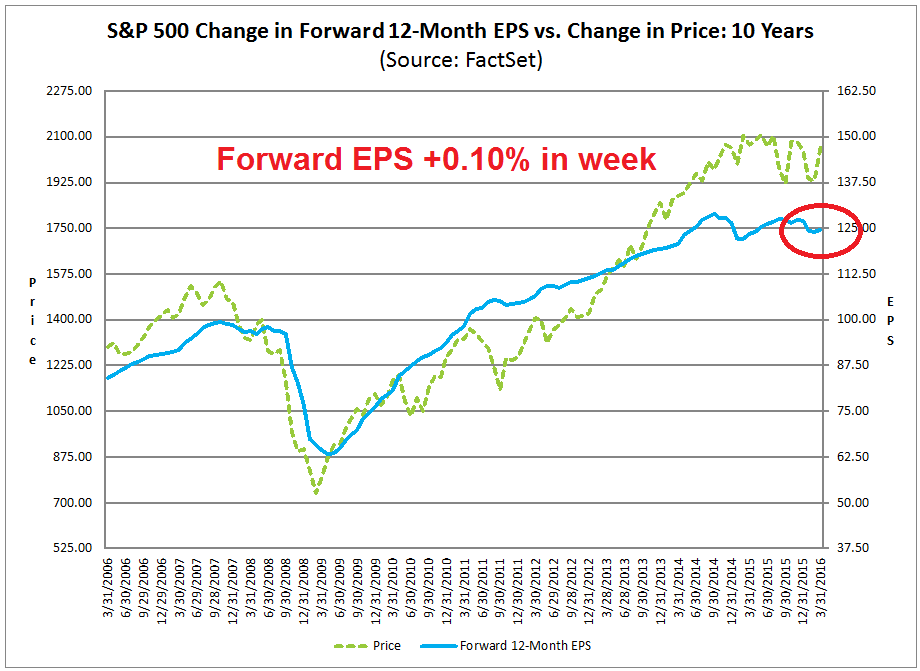
With such high levels of negative guidance, the Q1 earnings outlook must be really, really bad, right? Not so fast! The evolution of street consensus forward 12-month EPS estimates, which comes from the same Factset report, tells a different story. Forward EPS has been rising, which is supportive of the global reflation trend that I have been writing about in the last few weeks (annotations in red are mine).
When the stock market enjoys the combined tailwinds of a bullish global reflationary trend, positive breadth, a dose of healthy skepticism and an easy Fed, how worried should investors be?
The week ahead: A possible pause?
For traders, it may be a different story. As we peer into the week ahead, the market remains overbought, though readings from IndexIndicators show that they have backed off a little from extreme levels.
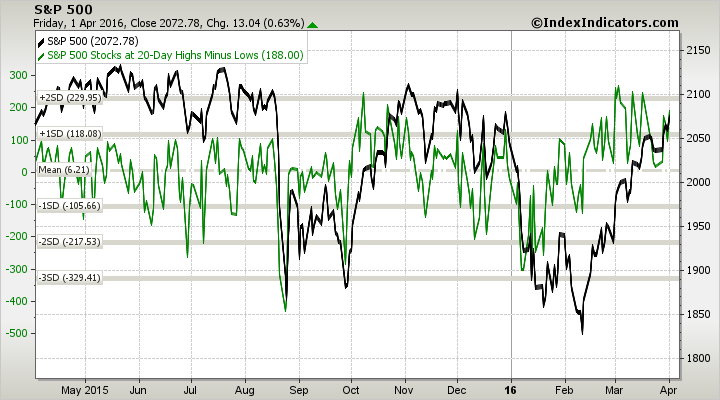
A glance at the SPX shows that the index is approaching a key resistance zone from below. RSI-5 remains overbought, but these may represent “good” overbought conditions that are typical of breadth thrusts identified by Ned Davis Research (see above). Both RSI-14 and the VIX Index are holding to their trend lines, which my inner trader is nervously watching.

One key concern for short-term traders is the the faltering performance of cyclical leadership. The chart below shows that, despite continued USD weakness, which should help the cyclical rebound, the relative performance of cyclical groups are starting to weaken. Industrial stocks staged a relative breakout and have now pulled back to test the relative breakout level. Semiconductor stocks are struggling with relative resistance. Energy experienced a minor violation of a relative downtrend on Friday, but the break is not definitive. Should these sectors weaken further in the near future, it may signal a period of pullback and consolidation, though weakness will most likely be shallow as the intermediate term outlook remains bullish. Under such a scenario, drawdown sensitive traders may want to either partially or fully de-risk their positions, or perhaps even go tactically short the market.

My inner investor remains long stocks, with an overweight position in the resource extraction sectors. My inner trader is nervously long as he watches the short-term internals, which may be showing signs of technical deterioration.
Disclosure: Long SPXL
April 26-27 is the next Fed meeting. When they do nothing, the resource extraction sectors might start the next leg up. As an intermediate term investor, I stay long also with a high resource weighting. I made a huge switch back to Canada with my client portfolios in mid-January. Canada will be the big story in 2016. The economy will surprise and grow more than the U.S., commodity industries will be healing and the currency will go up.
If at any time, we break out to new highs, it will confirm January/February was an important low and a new longer term bull market is in force. With a very Dovish Fed, no recession in sight, and interest rates tame at microscopic levels, I expect a buying stampede. Most stocks yield more than 10 year Treasuries with growing dividends. That is cheap to your average investor. Worries about how today’s PE is too high compared to when rates were normal, won’t hold back investors when a new trend becomes obvious. Look at the high PEs of the safe dividend sectors of utilities and consumer staples. The PEs of other industries are normally much higher than theirs. That offers a lot of capital gains as they realign.
Ken — is there a particular Canada ETF you might recommend?
Webmaster note: Martin is based in Europe.
EWC trades in U.S. It is the MSCI Canada Index. In Canada, HXT is the S&P/TSX 60 Total Return ETF (dividends automatically reinvested) with very low MER.
Thank you!
I think I will be the last hold out. I yet think that we are having an overall strong rally in a bear market. While the S&P 500 is close to its all time high the other major indexes like the New York Composite, the Nasdaq and the Value Line are quite a ways away. However, a 12% rally is nothing to sneeze at. Ken is right at some point it the rally continues us bears will have to throw in the towel. A point to remember – in bear markets the short covering rallies are fast and furious.