Explaining our market timing models
We maintain several market timing models, each with differing time horizons. The “Ultimate Market Timing Model” is a long-term market timing model based on research outlined in our post Building the ultimate market timing model. This model tends to generate only a handful of signals each decade.
The Trend Model is an asset allocation model which applies trend following principles based on the inputs of global stock and commodity price. This model has a shorter time horizon and tends to turn over about 4-6 times a year. In essence, it seeks to answer the question, “Is the trend in the global economy expansion (bullish) or contraction (bearish)?”
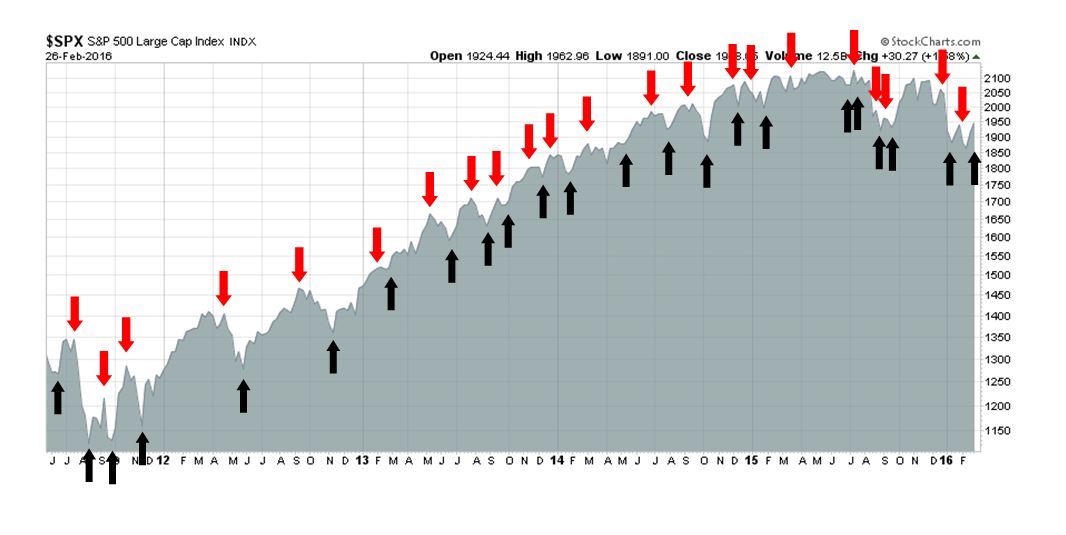
My inner trader uses the trading component of the Trend Model seeks to answer the question, “Is the trend getting better (bullish) or worse (bearish)?” The history of actual out-of-sample (not backtested) signals of the trading model are shown by the arrows in the chart below. Past trading of this model has shown turnover rates of about 200% per month.
The signals of each model are as follows:
- Ultimate market timing model: Buy equities
- Trend Model signal: Neutral (upgrade)
- Trading model: Bullish (upgrade)
Update schedule: I generally update model readings on my site on weekends and tweet any changes during the week at @humblestudent. Subscribers will also receive email notices of any changes in my trading portfolio.
The reversals continue
In the last few weeks, I have been highlighting the improving macro-economic and fundamental backdrop, while voicing concerns over the technical damage suffered by the stock market. I had concluded that the market was undergoing a W-shaped choppy correction.
Last week brought a number of reversals. The macro and fundamental picture suffered a number of setbacks, which creates a number of longer term concerns. On the other hand, a review of the technical conditions showed considerable improvement.
Macro wobbles
The macro reversals came mainly from signs of decelerating economic growth momentum. One major concern came from the Q4 GDP revision report released Friday. Q4 GDP growth was revised upward from 0.7% to 1.0%, but the report was marred by indications of building inventory and a slight slowdown in real consumer spending.
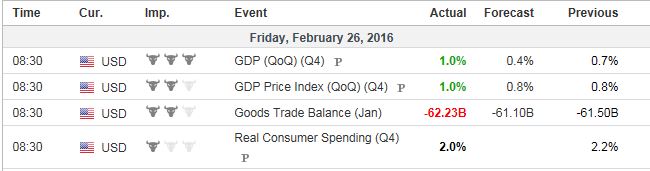
The report was negative enough that the Atlanta Fed’s GDPNow estimate of Q1 GDP growth slid from 2.5% to 2.1% because of the effects of the inventory buildup.
New Deal democrat, who monitors real-time economic releases, noted that a second week of growth deterioration:
Several recent reversals intensified this week. Real M1 has decelerated to the point where it is barely positive. Withheld taxes also decelerated even further to less than +1% YoY, suggesting payrolls have turned negative. On the other hand, both rail carloads and steel production YoY have turned positive or almost positive, strongly suggesting they have bottomed.
Among long leading indicators, interest rates for corporate bonds are neutral, while treasuries, real estate loans, mortgage applications, Real M2, and mortgage rates are positive. In fact, mortgage rates and applications are now strongly positive. Real M1 has decelerated to the point of being only slightly positive.
Among short leading indicators, the interest rate spread between corporates and treasuries remains very negative, although it has improved in recent weeks. Jobless claims remain positive. Oil and gas prices, and usage, remain very positive. Commodities, while negative, appear “less worse” on a YoY basis. The US$ as against major currencies has turned neutral while on a broad basis it remains quite negative.
Among coincident indicators, bank rates, staffing and shipping remain negative, Consumer spending was positive although Gallup was down slightly this week. The big news here is that withholding taxes have deteriorated badly, suggesting that payrolls, or at least hours worked, have turned negative. On the other hand, steel production has almost turned positive, and rail transport actually positive on a YoY basis, suggesting these have bottomed.
The bifurcation of decent consumer economy, poor industrial economy (at least that portion tied to commodity extraction and exports) that began one year ago, looks to be changing. Negatives have spread to withholding taxes, and money supply has weakened. But commodity production and transportation look like they have turned positive.
Rising inflation = More hawkish Fed
Another ominous sign for equities came from the Personal Consumption Expenditure (PCE) report. Core PCE (ex-food and energy) and Trimmed Mean PCE jumped up to 1.7% and 1.9% respectively, which are getting very close to the Fed’s 2% inflation target. Core PCE is the Fed`s favorite measure of inflation and this latest data release points to rising inflationary pressures, which is supportive of the case for a faster pace of interest rate hikes.

EPS growth uncertainty continues
In past cycles, the negative effects of Federal Reserve induced rate increases have been offset by the positive effects of better earnings growth. While that may still be true, the short-term earnings growth outlook remains uncertain.
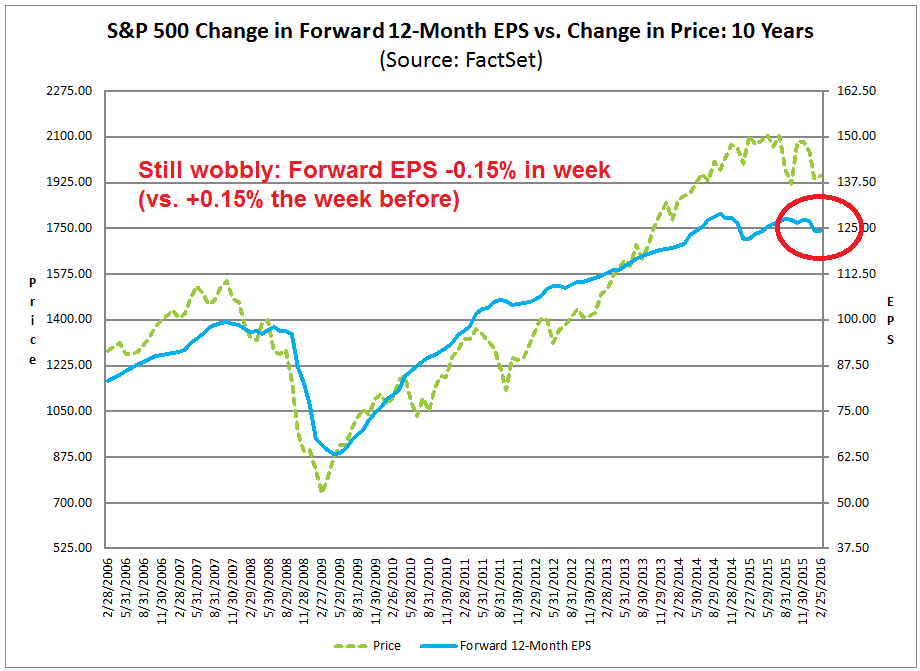
My inner investor got very excited last week when forward 12-month EPS rose and he eagerly awaited this week’s forward EPS update for confirmation that the increase in consensus earnings estimates was not a data blip. Alas, John Butters of Factset reported that forward EPS fall back in the latest week. The Street’s outlook for earnings growth remains wobbly.
A recent research note by UBS strategist Julian Emanuel also highlighted a trend of rising EPS estimate volatility, which indicates rising uncertainty over the earnings outlook (via Business Insider):
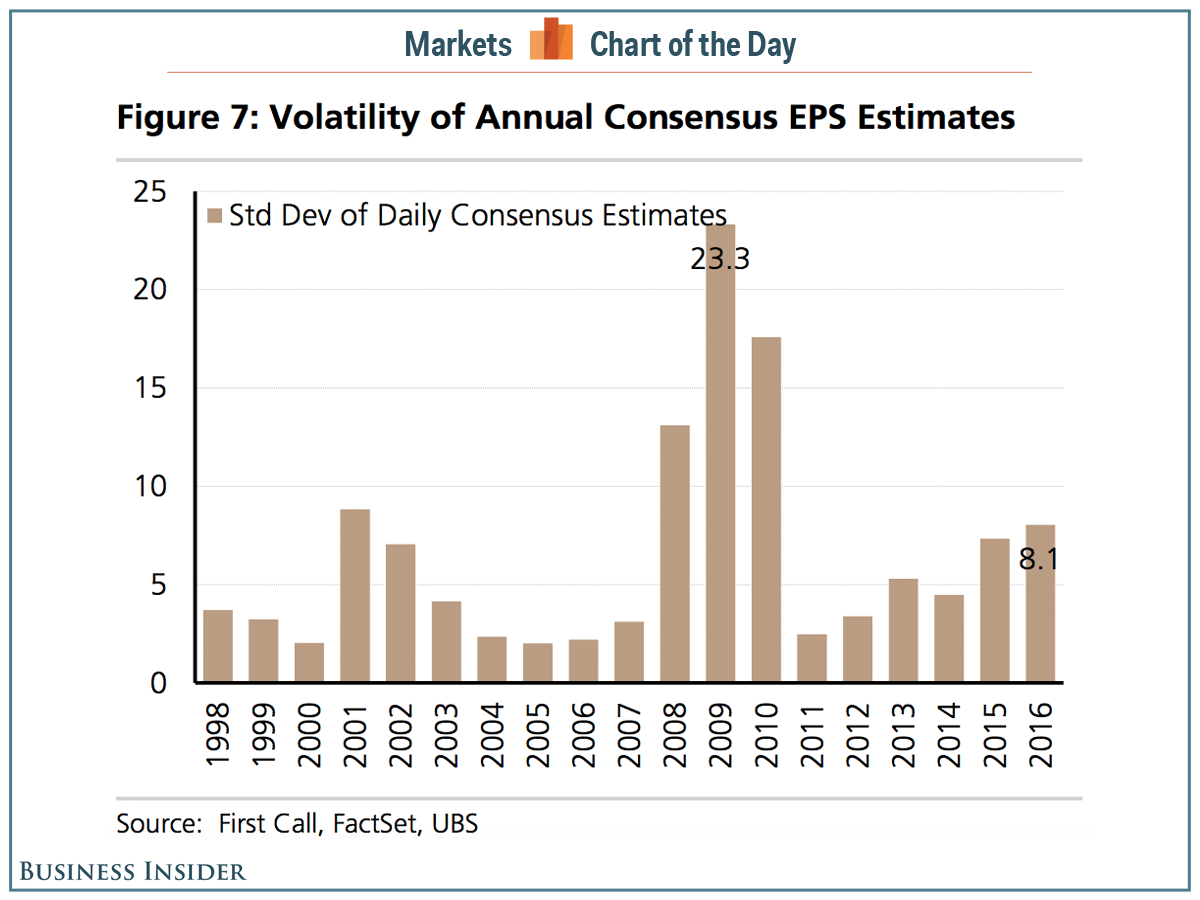
Until we see a consistent pattern of rising forward EPS, stocks will find it difficult to stage a sustainable advance.
Technical healing
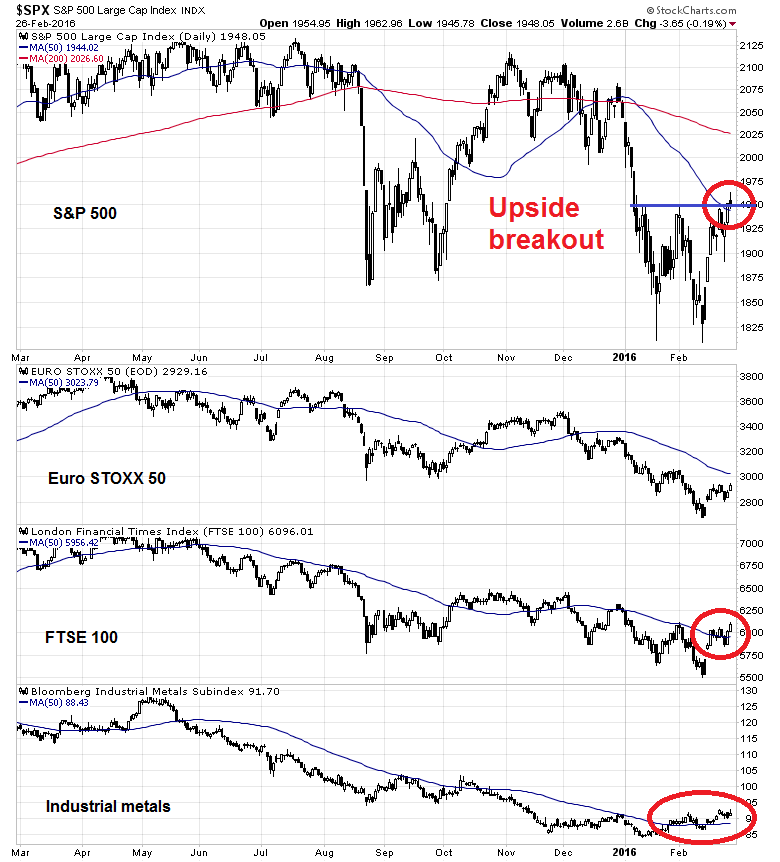
While these indications of macro and fundamental setbacks represent bad news for the bulls, they have been offset by signs of healing on the technical front. First, the stock market rally last week saw the SPX stage an upside breakout through resistance and its 50 day moving average (dma). Equally encouraging were signs of global technical healing. Both the FTSE 100, which “should” be struggling with uncertainty over the upcoming Brexit referendum, and the cyclically sensitive industrial metals also rose to regain their 50 dma levels.
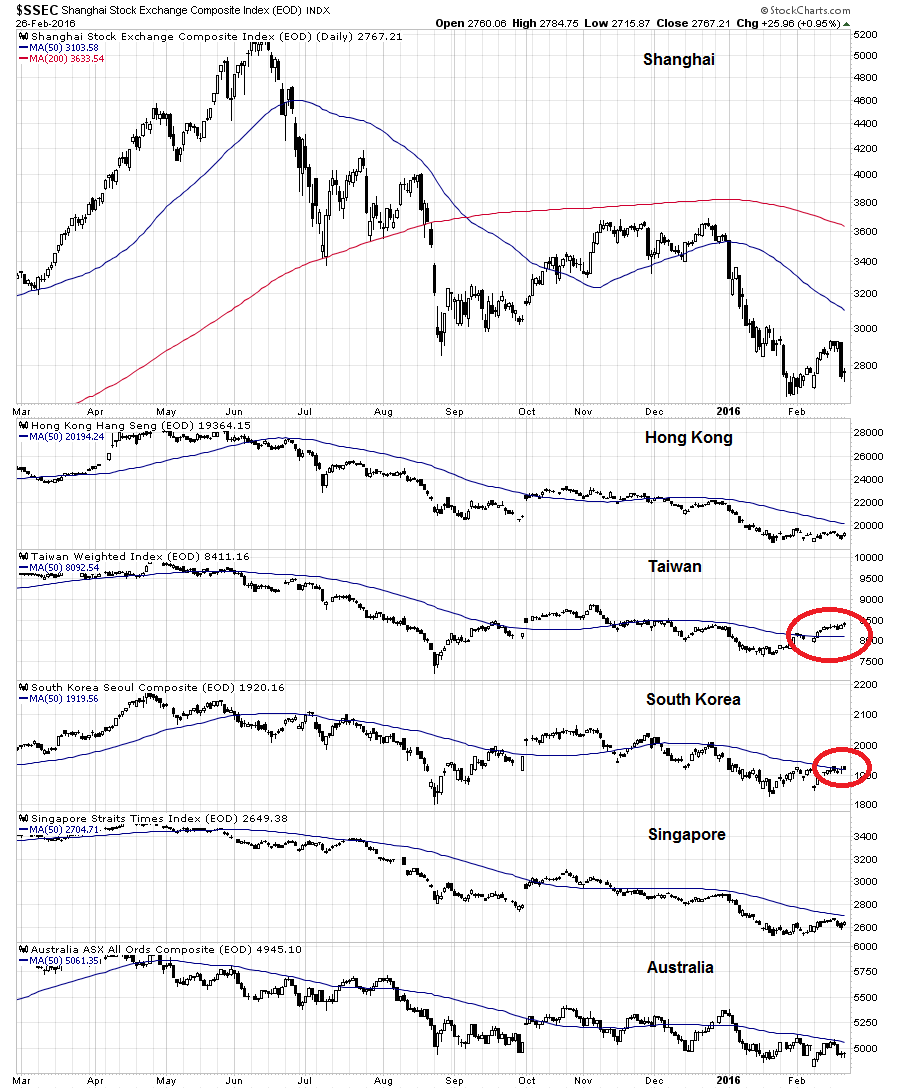
We are also seeing sporadic signs of technical healing in Asia as well. Even though the Shanghai Composite struggled, the stock indices of a couple of China`s major Asian trading partners, namely Taiwan and the cyclically sensitive South Korea, rallied above their 50 dma levels.
As a consequence of these improvements in the technical tone of the markets, the Trend Model’s readings has been upgraded from risk-off to neutral. As the trading model keys off changes in the direction of the Trend Model, it has changed from bearish to bullish.
A market bottom next Wednesday?
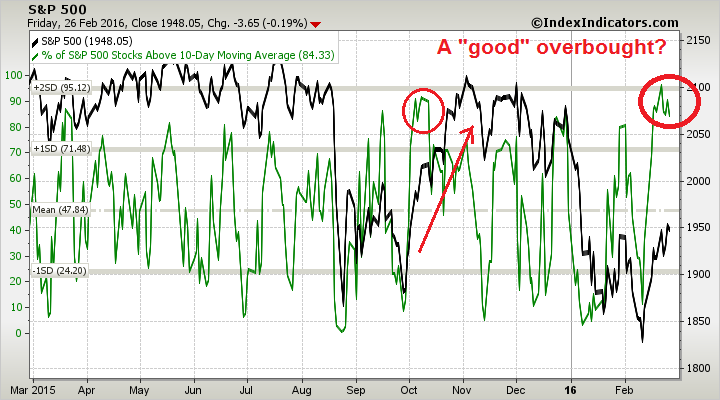
Looking to the week ahead, the chart from IndexIndicators shows that the stock market is overbought after the recent strong advance. However, there are signs that this represents a “good” overbought condition where the market remains overbought as it rallies, much like what occurred when the market rose off the September 2015 bottom.
I wrote last week that the market had until last Friday to flash a Zweig Breadth Thrust buy signal (see Mind the gaps), which it failed to do so. However, Simon Maierhofer, writing in Marketwatch, alerted us last week to an equally bullish “kickoff” signal, in which the SPX rose for 1.5% or more for three consecutive days. He pointed out that such conditions have represented a bullish impulse in the past where stocks were substantially higher a year later.

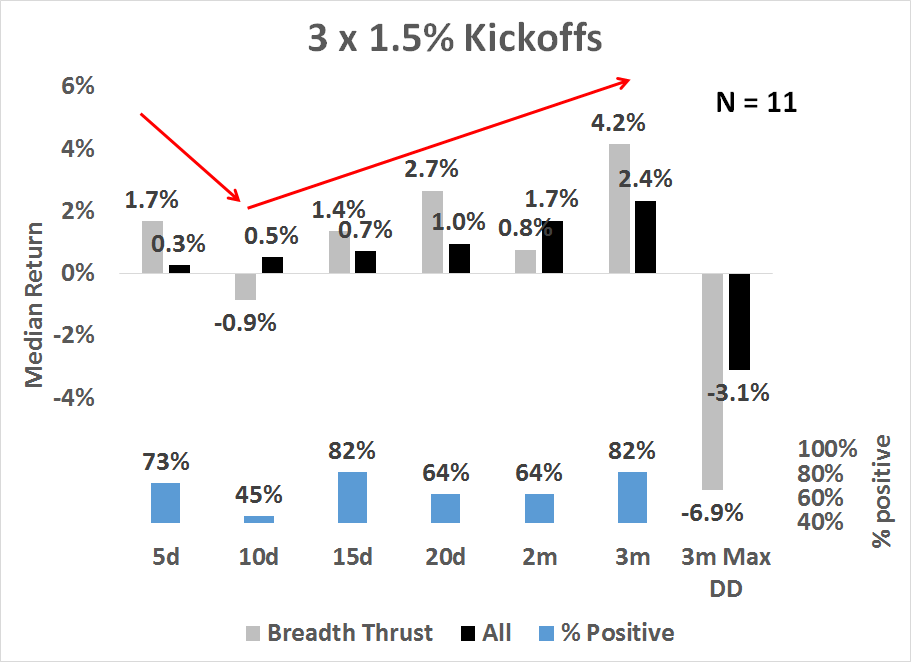
I went back to 1950 and studied past “kickoffs” where the SPX rose for three consecutive sessions of 1.5% or more. I found 11 episodes (other than the most current) and the results are summarized in the chart below. Indeed, stock prices were typically higher one, two and three months later, but the market tended to pull back about 10 days after the “kickoff” date. Even though the index was higher 82% of the time after three months, with a median return of 4.2%, the median maximum loss during that period was 6.9%, indicating heightened volatility during past “kickoff” episodes.
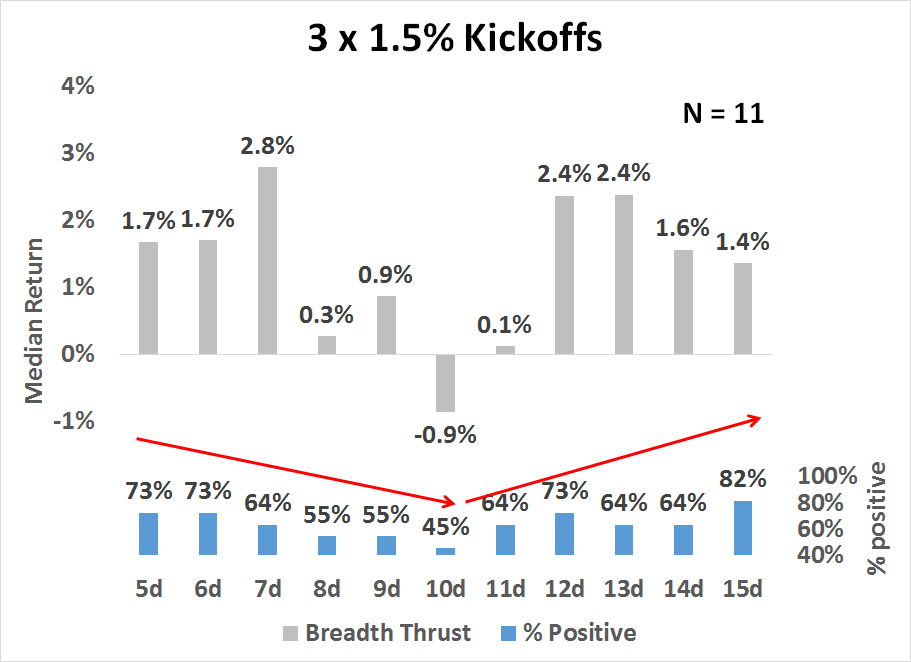
As returns seem to dip after 10 days, I paid particular attention to the post-“kickoff” return period of between 5 and 15 day. The top panel of the chart below shows that returns were volatile, but if we focus on the % positive metric shown in the bottom panel, the market tended to bottom out 10 days after kickoff.
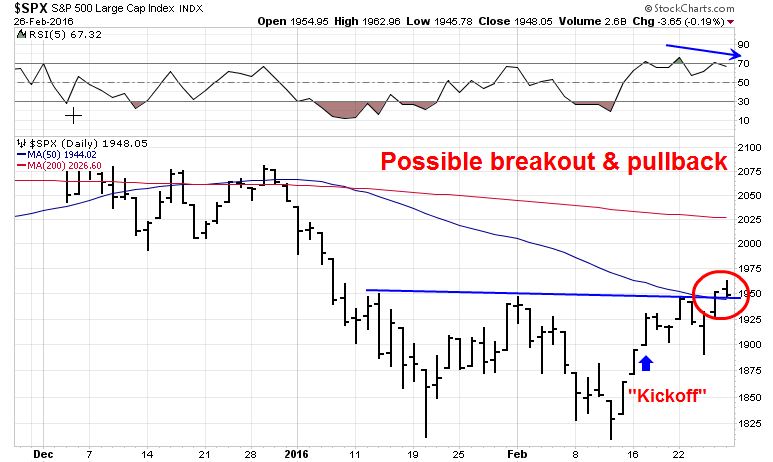
With the caveat that the “kickoff” study has a very small sample size, that conclusion makes sense in the current circumstances. As the chart below shows, the SPX staged an upside breakout through resistance and its 50 dma, which are intermediate term bullish. On the other hand, market conditions are overbought and the 5-day RSI has flashed a negative divergence, which is bearish from a short-term trading perspective. If history were to repeat itself, the market is likely to pull back after its breakout and bottom out next week on Wednesday March 2, or which represents 10 trading days after the “kickoff” date of February 17, 2016.
My inner investor is still constructive on stocks and he remains in accumulation mode. He is casting his lot with the “smart money” insiders, who are still doing more buying than selling (via Barron’s).
My inner trader missed the trading model signal change from bearish to bullish because I conducted this review on the weekend after the market closed. He has a small SPX short position, but he expects to cover his short next week and reverse to the long side.
Disclosure: Long SPXU
Hi Cam
Being mainly a trend follower I can only point to the chart of the S&P 500 and the Shanghai that you have shown above. The definition in my book is that when the 50 day moving average is below the 200 day you are in an established down trend. Calling the bottom one gets rewarded once if one is correct! On the other hand the loss of being incorrect is manifold.
There are two things that one has to consider: (1) The Algos control the market short term and they don’t care about averages. (2) In technical analysis a phenomena that is very common is the undercut or over cut lows and highs. Where an index goes above a previous high or low and reverts back to the bigger trend. I would therefore watch the next few days to see if the trend has changed. Most likely it has not.
There is nothing wrong with being cautious. The trouble with being overly cautious is you miss the first move. On the other hand, you will also miss the kinds of whipsaw action that you are exercising caution over.
No right or wrong answers: It all depends on your time horizon and comfort level.
The ZBT conditions (0.4;0.615;10d) were chosen to give sufficient expectation of sufficient gain. ZBT came within a whisker twice intraday. (Just observing, supporting “good overbought”.)
Close but no cigar, but we have the “kickoff” as a substitute…
Several sentimentrader.com studies are showing lift-off type action towards an intermediate upleg.
Gold they say is at an important juncture. Action similar to the last few years would have it correcting substantially from the current overbought state. But if it pulls back just a little or corrects sideways before a new upleg starts, it would be a sign of a long term bull market’s birth.
Hello Cam, thank you for this highly investible advice.
I recently looked back at your prescient 2009 “Phoenix Rising” call, in which you identified beaten-down stocks that were big enough and self-assured enough (i.e. via insider buying) to warrent a wager. I wonder if you might consider applying your filter to the present-day situation. Sure, you won’t find many equities that have suffered an 80% loss, but perhaps at 50% to 60% we might be talking?
The Phoenix strategy was one based on buying beaten up low priced stocks with good insider buying. That’s a useful tool for circumstances where the economy is in a deep recession, or discounting a deep recession/end of world.
I would not use that today as the macro conditions are nowhere near what they were then. The previous historical instance when such a strategy was appropriate was late 2001, between 9/11 and the end of year.
What about Phoneix for commodities?
The idea behind Phoenix is that the economy is so bad that it is nearing an inflection point. So you take a bet by buying companies that look like they’re nearly bankrupt. The late Joe Granville used to call this his “low-priced stock” strategy.
While I appreciate that may be what’s happening in commodities, not sure if you really want to do that because you are not getting the macro lift from the same kind of turnaround in global growth.