Explaining our market timing models
We maintain several market timing models, each with differing time horizons. The “Ultimate Market Timing Model” is a long-term market timing model based on research outlined in our post Building the ultimate market timing model. This model tends to generate only a handful of signals each decade.
The Trend Model is an asset allocation model which applies trend following principles based on the inputs of global stock and commodity price. This model has a shorter time horizon and tends to turn over about 4-6 times a year. In essence, it seeks to answer the question, “Is the trend in the global economy expansion (bullish) or contraction (bearish)?”
My inner trader uses the trading component of the Trend Model seeks to answer the question, “Is the trend getting better (bullish) or worse (bearish)?” The history of actual out-of-sample (not backtested) signals of the trading model are shown by the arrows in the chart below. Past trading of this model has shown turnover rates of about 200% per month.
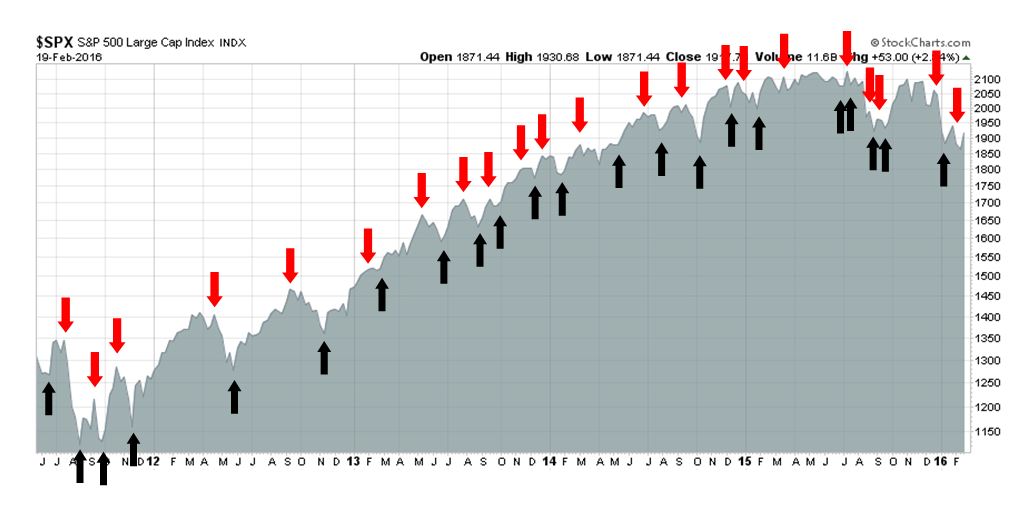
- Ultimate market timing model: Buy equities
- Trend Model signal: Risk-off
- Trading model: Bearish
Update schedule: I generally update model readings on my site on weekends and tweet any changes during the week at @humblestudent. Subscribers will also receive email notices of any changes in my trading portfolio.
Here is the bull case
Last week, Morgan Stanley strategist Adam Parker admitted defeat. He conceded that “our portfolio advice has been pretty horrendous lately. As my 90-year old Latin teacher used to tell the class in 1985, `son, you are in left field, without a glove, with the sun in your eyes.`” (via Zero Hedge). Beaten and battered, he concluded that the only bull case for stocks was there was no bull case:
What’s the bull case? The positives are this: no one is articulating a bull case for US equities with conviction. Earnings expectations are potentially low. There is some fiscal stimulus this year (vs. drag previous years). The Presidential candidates don’t appear to be multiple expanders now, but they will get more centrist and the riffraff will be removed in a few more weeks. Sentiment is low (two weeks ago an investor on a panel we moderated said “It is a multi-variable world and every variable is negative”.) The US probably looks relatively better than other parts of the world. So maybe, the bull case is just that no one can articulate a bull case.
If Parker had read my commentary last weekend, he would have understood the bull case (see Profit by thinking like Big Money). To put it very simply, the bull case for stocks can be summarized in two words: “Growth surprise”.
So bearish it’s bullish
In a way, Adam Parker was correct in the sense of everything is so bearish it’s bullish. Sentiment readings have been deteriorating to a crowded short position, which is contrarian bullish.
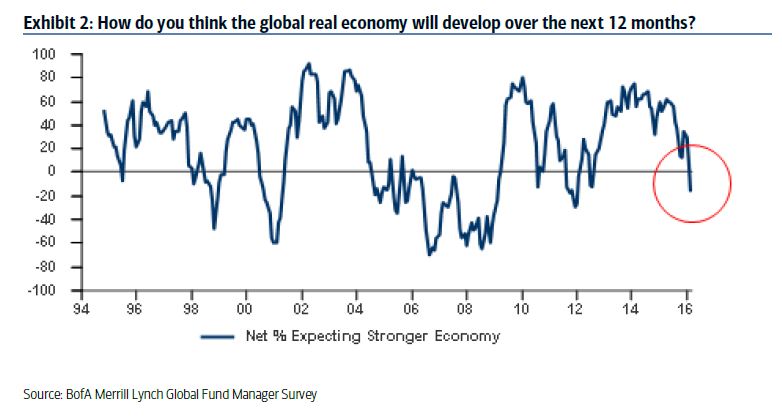
The latest BoAML Fund Manager Survey, whose sample consists mainly of global institutional managers, show that they are thrown in the towel on the macro outlook. As the chart below shows, growth expectations have tanked…
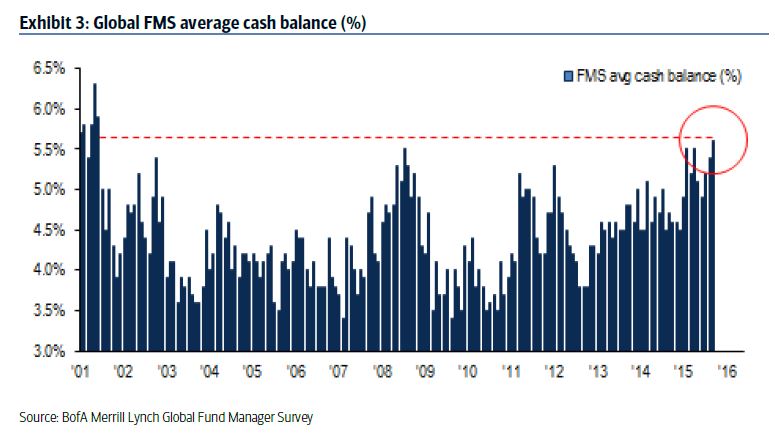
As a consequence, cash positions have spiked to an extreme high…
…and portfolio positioning has become highly defensive with a concentration in cash and severe underweight in cyclical stocks (annotations in red are mine).

Not only are institutions bearish, so are retail investors. Individual market timers, as measured by Rydex traders, have also moved to a crowded short. If history is any guide, similar readings have put a floor on the market in the past.

Here comes the growth surprise
The good news is that, with sentiment and market positioning so bearishly stretched, we are starting to see elements of a positive growth surprise. I wrote before that consensus forward EPS estimate revision is the most important metric to watch during the current period of uncertainty (see If I had to watch just ONE THING), If it does turn up, it would be an indication of a revival of fundamental and macro momentum, which has the potential to propel stock prices to new highs.
The latest report from John Butters of Factset shows that forward EPS had ticked up last week after several weeks of decline. Could this be the long awaited turnaround? A single week rise could be a blip, but if forward EPS estimates were to improve again next week, my inner investor is ready to take that as a confirmation that the correction is over and sound the all-clear signal.

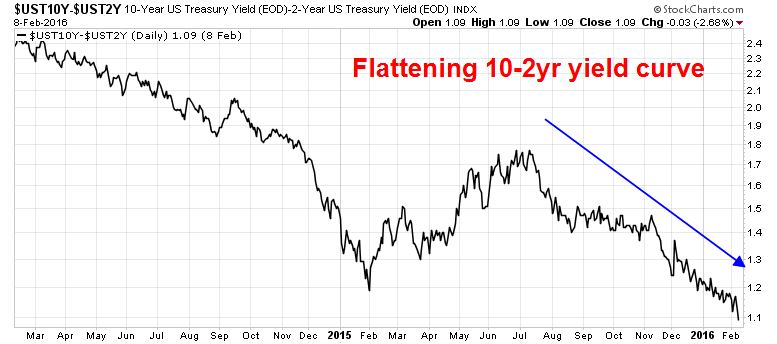
To be sure, the bond market isn`t quite ready to jump on the growth surprise bandwagon just yet. The gap between the 10 year Treasury and the 2 year Treasury yields continues to narrow, indicating a flattening yield curve and expectations of decelerating growth.
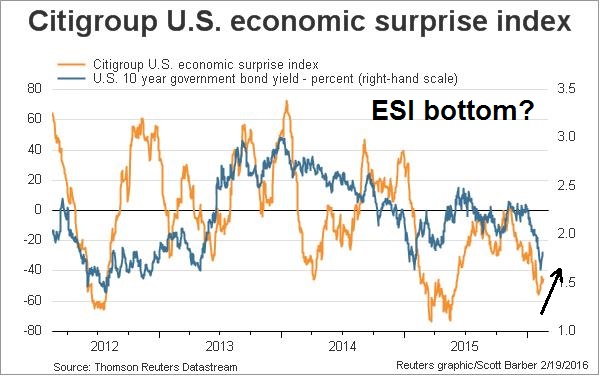
However, the Citi Economic Surprise Index (ESI), which measures whether high frequency economic releases are beating or missing expectations, is showing signs of a bottom and turnaround. The ESI (gold line) has been positively correlated with the 10-year Treasury yield (blue line). A rising ESI could push up 10-year yields, which would likely steepen the yield curve.
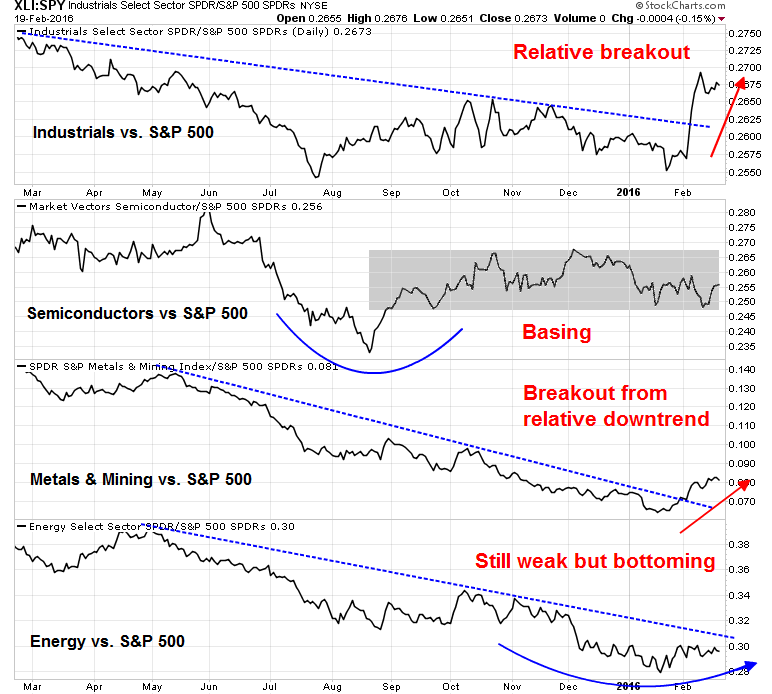
The relative performance of cyclically sensitive equity sectors and industries are also signaling a possible growth surprise. The chart below shows the relative returns of different cyclical sectors and groups. Industrial stocks have been the strongest and they staged a rally and upside relative breakout; Semiconductors having bottomed on a relative basis and now consolidating sideways; Metals and Mining have broken out or a relative downtrend; and Energy is the only sector that is in a relative downtrend, though it does seem to be bottoming.
My inner investor is getting very excited. He has been accumulating stocks with overweight positions in the resource sectors. He is ready to go all-in should he get confirmation of a cyclical upturn should forward EPS revisions continue to improve next week.
The week ahead: Unfinished downside business?
My inner trader is cognizant of the positive news from forward EPS and he was tempted to close out his small SPX short position on Friday (see Why I tactically shorted stocks today). In the end, his analysis of the technical picture led him to believes that the market may still have some unfinished business to the downside before the current corrective episode ends.
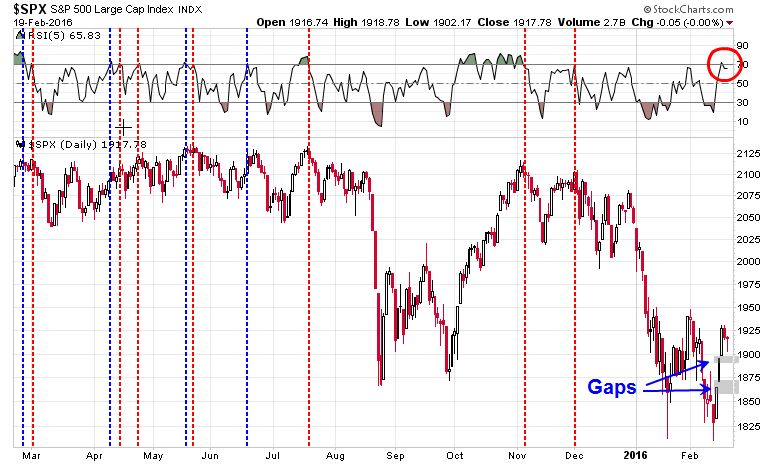
From a technical standpoint, the short-term outlook for stocks still looks iffy. The 5-day RSI indicator flashed a sell signal by moving above 70, an overbought reading, and then falling below. The chart below shows the instances in the past year when the same sell signal was triggered. The red vertical lines marked instances when the market fell right away and the blue lines marked instances when they did not. There were far more red lines than blue lines and even the blue lines were followed shortly by market declines. I am also concerned about the two downside gaps depicted in the chart below, which are just asking to get filled in the next few days.
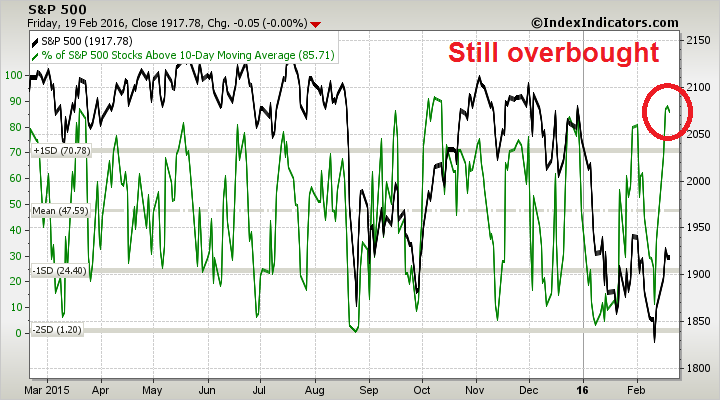
Further, breadth indicators like this one from IndexIndicators shows that the market is overbought, which will make it difficult for equities to advance next week.
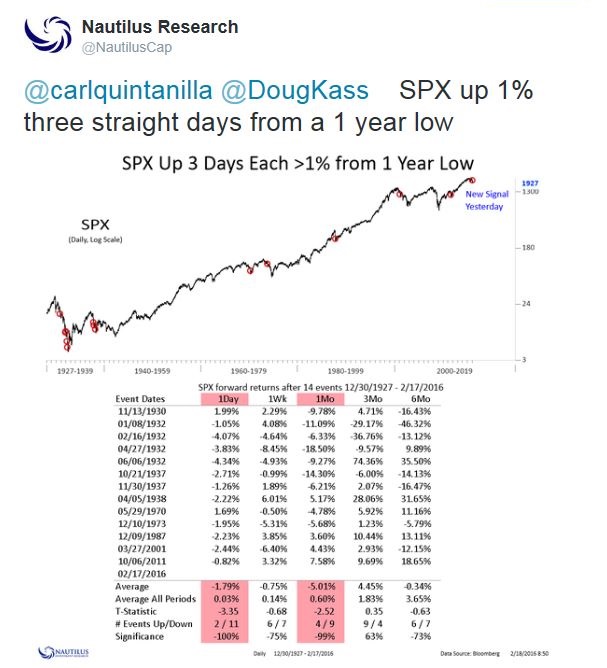
In addition, Nautilus Research pointed out that the kind of strong rallies off a bottom that we saw last week tends to be typical of a bear market rally and prone to further weakness.
The only short-term hope that the bulls have is the market could flash another rare Zweig Breadth Thrust buy signal (ZBT) which has had an uncanny bullish record (for full details see Bingo! We have a buy signal!). The chart below shows the ZBT signal in the top panel, the ZBT Indicator and real-time estimate of the ZBT Indicator in the bottom two panels. The ZBT Indicator has 10 trading days to move from 0.40 to 0.615 to trigger a buy signal. The clock is ticking and time is quickly running out. (Interested readers can follow the progress of the ZBT signal by using this link.)

Based on the combination of my macro, fundamental and technical analysis, a more likely scenario would see SPX weaken again to test the lows again before a sustainable advance begins. My inner trader is short the SPX, but he is using the ZBT Indicator as his stop loss. Should we get a ZBT buy signal, he will cover his short and go long. Otherwise, he will wait for oversold conditions before taking profit on his short position.
Disclosure: Long SPXU
Dear Cam: it hurts me to disagree with you. I just came back from a week at Disney World (Florida). I have never in 17 years seen it so crowded. I saw persons that recently could not afford a county fair now patronizing Disney Resorts. This would be wonderful, of course, if these people could really afford it. Unfortunately, it was obvious they could not, they are just borrowing from the future. We know that the bill collector always come and this time will be no exception and there will be hell to pay. Anecdotal evidence, for sure, but anecdotal evidence is all we have at the turning point.
To summarize: it is so good that it can’t last.
Desperately hoping you are right.
EB
Articulate. well reasoned. Thank you Cam!
I continue in the thought that we are no longer in a industry sector synchronized stock market now that Central Bankers fear rising rates and are sitting on their hands. With them out of the picture, which I call a ‘Moonless’ economy and stock market, each industry has its own business and stock market cycle. By tracking sectors rather than THE market, I was able to buy the new bull market cycles in gold mining, base metals mining and the Canadian stock market recently. The bottom of the bear market on gold mining was January 19 and the others were January 20. Here is a dynamically linked chart which I monitor, that will update automatically every day;
http://product.datastream.com/dscharting/gateway.aspx?guid=d3467db5-4b3e-4f4a-b64c-8665317f002c&action=REFRESH
At that low mid-month point, the Canadian stock market had hit bear market territory (minus 20%) and the two miners minus 70% plus from their peaks. Cam had a great piece on energy possibly making a long term turn around that time. Mining fundamentals (mine closings, dividend cuts, etc.) had reached normal turning point conditions. I thought we could be approaching a long term low. I was on alert for these sectors to bottom at an extreme sentiment low reading. It didn’t matter to me what condition THE market was in. These sentiment extremes arrived January 20th, when SentimentTrader.com reported that sentiment towards commodities, the Canadian dollar and Canadian stock market hit never before seen sentiment lows. When stocks turned up strongly on the 21st, I bought.
You can see in the above chart, there has been huge moves which are getting very little attention. For example, the Canadian market is up 7% in Canadian dollars (13% in $U.S.) since the bottom and Canadian financial media are still crying the blues. I suspect, the TSX has made an important turn. This would be a complete shock to most. Economic fundamentals, are also turning up. I was 100% non-Canadian on January 1, with client portfolios. I switched to about 50-50 if you count as I do, global base and gold mining in Canadian-type investments. I am a portfolio manager in Canada so my stance to be mostly out of Canada in 2015 was very atypical but correct.
I now check this chart every day to make sure these sector ETFs are still outperforming the S&P 500 to confirm the bull markets in these continues. If they fall below the S&P 500 line, I will exit and admit that this was just a failed rally in a continuing downtrend. I do, however, suspect that we have seen a very important bear market low in these, especially gold where Central Bankers are ……. (don’t get me started!)
My experience with the birth of new bull markets will see gold and gold mining stocks (if it is a new bull) stay between overbought and very overbought for the next six months without going oversold. This is because late comers want to get in but are waiting for the magic pullback to where prices used to be. But the shear numbers of bidders doesn’t allow it to fall back like it used to when it was in a bear market.
Energy may have made a turn as well but the geopolitics are too unstable for my taste.
Cam, what I don’t understand is that while you believe we are still in a bull market, you are willing to accept and use bear market set-ups. Don’t you find this approach a bit inconsistent? If we are in a bull market, the recent weakness is a clear buy – even without capitulation. If we are in a bear market, even after such strong rallies we have had, it’s still a sell.
My work suggests that we have put in a solid bottom – but it’s still a bear market rally. Based on WSJ block trade data, institutions have been accumulating DJIA components since January and continues to do so. OEX traders (whom I follow as the smart money) is now a lot less bearish and tactically bullish on Friday at the close (and have been decently bullish on a tactical basis since late January). Dumb shorts in SH have skyrocketed and despite the 120 handle rally in SPX, total holdings are still only at 0.98% off record high. I think we are set for a massive short squeeze here.
On the flip side, OEX traders started to become bearish from middle of Oct and DJIA block trades have seen distribution from middle Oct till late December. If we are in a bear, I don’t think a similar setup would take 3 months to come fruition. If we are still in a bull market, this sort of behaviour would lead a trading range potentially for a month or two before it breaks again for a correction.
It’s all a matter of differing time horizons.
Cam: I wonder how useful Rydex is as a sentiment indicator these days. I think it may have gotten small enough, and the number of market timers switching back and forth between bull, bear, and cash funds have gotten few enough, that it may be misleading.
Every sentiment indicator that is useful has a characteristic of reacting to daily fluctuations. So when the market has a big up day the indicator should show more optimism, and a big down day produce pessimism. Those reactions by themselves don’t tell us much. It is only if sentiment fails to follow the market, or even gets more pessimistic as the market goes up, that we get a useful bullish signal, and the opposite in the other direction.
Rydex figures used to do that, swing around day to day in consonance with the daily action. In the last year or so it seems to have stopped doing that. The ratio of cash flow into or out of the various funds seems disconnected from daily action. The Rydex cash flow of bear funds + MMF has stayed in a very tight range of 0.57 to 0.58 for a few weeks now, despite some pretty wild swings. I suspect we are now measuring the sentiment not of many market timers, but of just one or two of them slowly moving their portfolios from one stance to another.
I’m curious whether you also think we should downgrade the weight of any messages from that indicator until it starts behaving like a normal sentiment indicator again?
I have wondered that myself at times, but Rydex data has been roughly in line with the readings of other sentiment models.
I use it because I prefer to use data where people are actually putting actual money on the line, rather than to express an opinion, e.g. AAII, II, etc.
Looks like we may have another gap up today and if we break above 1950 zone we would likely have the ZBT signal to the upside. Have to see how things change if at all when Europe closes.
Cam, I finally joined you on the (lightly) short side at the close today. I think by grouping Rydex money market with bear funds you can be misled. Clearly, Rydex investors are not even net short. They are at levels that will turn a correction, and they did increase shorts after the 3 day market rise, which is bullish. But, to turn a bear market, Rydex traders are not only net short, but heavily so. We are nowhere near those levels.
Perhaps we can say they are a crowded neutral based on their MMF levels.