Recently, Business Insider featured a chart of long-term equity returns based on data from Bob Shiller.

The lesson was, the longer your time frame and the more patient you are, equities win. That`s been a lesson taught to generations. Based on this data, equities has become the foundation of any portfolio for anyone building a long-term investment plan.
While I would not necessarily disagree with equities being a major portion of a long-term portfolio, I would content that Shiller`s analysis is at best, exaggerated because of survivorship bias, and at worst, deceptive. It is reminiscent of glossy brochures and offering memorandums promising great things, but leaving out key details.
Survivorship bias exaggerates returns
I always laugh whenever someone cites the history of US equities as a template for calculating future equity return expectations. The latest Credit Suisse Global Investment Return Yearbook 2016 provides some perspective. The chart below shows the relative sizes of equity markets in 1900 and in 2015. The top 5 markets in 1900 were (in order): UK, US, Germany, France and Russia. In 2015, the size of the American market dwarfs all other markets.

How would you feel if you found out that someone sold you an investment by citing the most successful market (or stock) in the last 115 year? Would you feel ripped off?
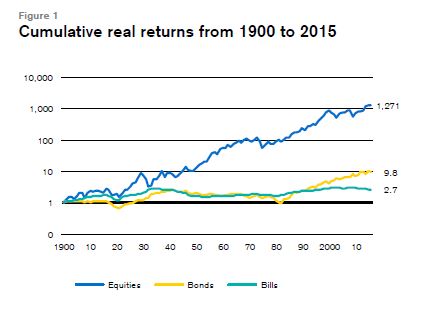
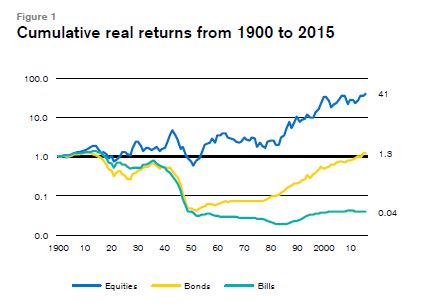
Here is how Credit Suisse characterized the returns of US equities. If you had invested $1 in 1900, you would have received $1,271 after inflation in 2015. Sounds good?
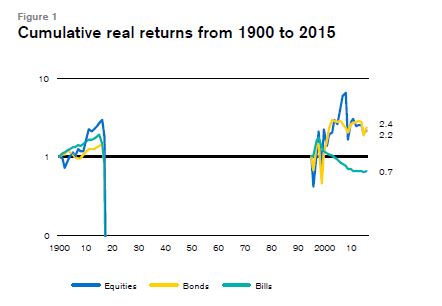
Let`s consider how you might have fared had you invested in the fifth largest stock market in 1900, Russia. For a Russian holding stocks during that period, the depletion of your portfolio would have been the least of your worries after about 1917.
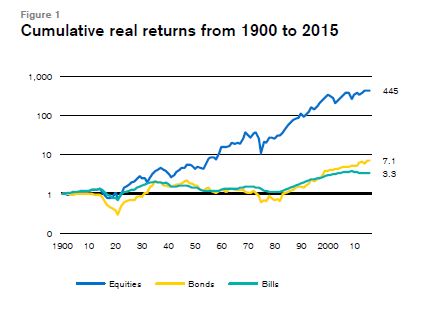
What if you had invested in the largest market in 1900? A terminal portfolio value of 465 after 115 years wouldn’t be bad, but it dramatically lagged the terminal value of a US portfolio at 1271.
For completeness, here are the other two major markets in 1900, namely Germany…
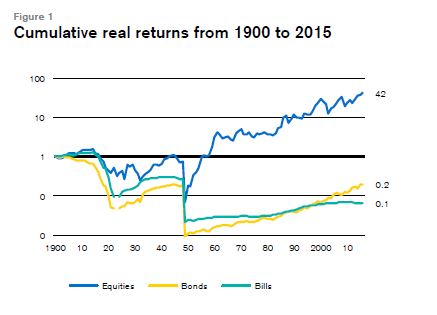
…and France, both of which suffered dramatically during the Second World War. Just like the Russian example, there were periods when the devastation of your stock portfolio would have been the least of your worries.
Imagine the next 100 year
This little exercise illustrates my point about survivorship bias in returns data. I am not questioning the accuracy of the return data of US equities during the 20th and 21st Centuries, but to hold them up as the model template for what investment returns might look like in the next 100 years is, at best, guesswork.
There is another level of survivorship bias that a lot of analyst neglect, namely survivorship bias at the asset class level. At the dawn of the 20th Century in 1900, most investments went into the bond market. Stock markets were relatively immature and equity investment culture was not well developed. If you went back in time to 1900 and knew nothing about financial markets, would you necessarily put a major portion of your portfolio into what amounted to an under-developed asset class?
Consider the following scenario 100 years from now. China becomes the dominant global economic power, after a number of fits and starts. Maybe someone 100 years from now will be showing a chart like this, but for Chinese real estate. Maybe real estate becomes the dominant asset class and takes over from equities. After all, we learned in Econ 101 that the three classic factors of production are Labor, Capital (stocks and bonds) and Rent (real estate). Why not property as a major asset class?

There are several morals to this story:
- Beware of survivorship bias
- Consider asset classes beyond the stocks and bonds when forming an investment plan
- Diversify, diversify, diversify
Cam: Brilliant post, one of your best. Survivorship bias is huge looked at from a very long term perspective.
To put it another way, every economy (of every country, of every time period) plays within the rules and environment set by its government. Why? Because the government has people with guns, and companies don’t. You might own shares in every one of the fastest growing, best managed companies in Russia in 1918, but it did you no good when the Bolsheviks confiscated them and gave shareholders nothing.
And governmental change is not predictable by statistical techniques. History was continuous for decades, and then suddenly it became discontinuous; a wise observer could have predicted that the Tsar would fall and communists take over, but that involved human judgement, not anything detectable using a chart or statistics.
Besides political change, there are limits that things can go before they must stop. Aggregate revenues of all the companies in an economy cannot grow faster than the economy itself, except to the extent that they are gaining market share overseas, but that is usually a minor factor. If an economy is growing at 3% (which we haven’t in a while), then that or maybe 3.5% is the most one can expect out of revenue growth.
Profit margins can grow to some extent, but there are limits – a company still has to pay for raw materials, wages, interest, etc, and there are never more than 100 cents in a dollar, so profit margins can only get so high before they top out. Once at peak margins, operating earnings can only grow as fast as revenues.
Then there are P/Es, and they can swing more wildly than revenue growth, but are also self limiting. Once a country’s stock market reflects strong revenue growth, maximum profit margins, and extremely high P/Es, then the best that the market can hope for is growth in line with revenue growth, and any setback anywhere can result in a steep bear market.
Those who say equities are inherently best always based on history are in effect either promising that corporate revenues will keep growing faster than the economies in which they operate (basically impossible), plus profit margins will expand ad infinitum (also impossible), and P/Es will expand to previously unheard of heights (possible if the central bank is printing money like mad, but high stock prices–>ease of capital raising—>more capacity built–>supply overwhelms demand—>profit margins collapse, so P/Es are self limiting too.)
The last 41 years since the deep bear market bottom in late 1974 (the post-WW2 equivalent of 1932) have shown good growth in revenues, profit margins going from tiny to large, and P/Es going from tiny to large. Add those up and there was a huge move up for stocks. To think that today’s situation has as much long term upside potential as existed in 1974 is to not understand how the stock market works.
“Beware of survivorship bias — Consider asset classes beyond the stocks and bonds when forming an investment plan —
Diversify, diversify, diversify”
…which is why, despite recent underperformance, I still like Meb Faber’s Ivy Portfolio approach, which invests in 5 non-correlating asset classes. Especially when you add a MA filter to it.
Which leads me to a question I have been wanting to ask Cam about his lovely Market Timing approach. I am not just worried about a recession, or about the Fed grabbing my punch bowl. I am also afraid of living in Japan in 1989. Would the Market Timing method prevent a 90% drawdown as caused by a combination of bursting bubble and demographic shrinkage?
If you are asking about the US becoming Japan, or the global economy becoming Japan, then the short answer is “yes”. The timing system is designed to sidestep that kind of slow growth or no growth environment. Its main inputs are global stock prices and commodity prices, who should give us signals of that kind of slowdown.
However, if you were to backtest that system on Japan itself, it would not have worked because the Japanese market was uncorrelated with global markets so its slowdown did not affect the global economy as much and vice versa.
Your answer is much appreciated, Cam. But sorry — what I actually meant was your new “ultimate market timing model”, whereas the long-term investor only needs to sell when a recession looms, or when the Fed tightens too much. And I assume the the answer to that might have been: the BoJ was too tight during all the 1990s.
With the caveat that nothing works all the time, I believe that the “Ultimate Market Timing Model” should be able to navigate a Japan-style slowdown.
Thank you for this post, Cam. It so reminds me of this little metal strong box my parents kept in their bedroom. In that box, aside from family mementos were the Russian bonds my grandfather escaped Russia with. He ran for his life with nothing but the shirt on his back and these Czarist bonds tucked under that shirt because he believed so strongly they would be worth something. I think we know how the story ends. My parents kept them to teach their children that nothing is certain and nothing is forever.
Recognition day.